")
Back to Journals » Cancer Management and Research » Volume 16
Prognostic Nutritional Index (PNI): A More Promising Nutritional Predictor for Patients Undergoing Surgery for Retroperitoneal Liposarcoma
Authors Xue GQ, Li CP, Lv A, Wu JH, Tian XY, Qiu H , Hao C
Received 20 April 2024
Accepted for publication 4 July 2024
Published 13 August 2024 Volume 2024:16 Pages 1021—1030
DOI https://doi.org/10.2147/CMAR.S474801
Checked for plagiarism Yes
Review by Single anonymous peer review
Peer reviewer comments 2
Editor who approved publication: Professor Yong Teng
Guo-Qiang Xue, Cheng-Peng Li, Ang Lv, Jian-Hui Wu, Xiu-Yun Tian, Hui Qiu, Chunyi Hao
Key Laboratory of Carcinogenesis and Translational Research (Ministry of Education/Beijing), Department of Hepato-Pancreato-Biliary Surgery/Sarcoma Center, Peking University Cancer Hospital & Institute, Beijing, People’s Republic of China
Correspondence: Hui Qiu; Chunyi Hao, Department of Hepato-Pancreato-Biliary Surgery/Sarcoma Center, Peking University Cancer Hospital & Institute, Beijing, People’s Republic of China, Tel +861088196182, Fax +861088196548, Email [email protected]; [email protected]
Background: Extended surgery with multi-visceral resection is the standard treatment for retroperitoneal liposarcoma (RLPS). Malnutrition tends to result in increased surgical complications and reduced survival. The aim of this study was to identify the prognostic role of nutritional status in patients with RLPS.
Patients and methods: Data from 189 consecutive patients with RLPS who underwent surgical treatment at the Peking University Cancer Hospital Sarcoma Center between April 2011 and August 2022 were retrospectively reviewed. The following nutritional parameters were calculated: nutritional risk index, prognostic nutritional index (PNI) and Nutrition Risk Screening 2002. Time-dependent receiver operating characteristic (time-ROC) curve analysis was conducted to compare the prognostic utility of nutritional indicators. The associations between nutritional indicators and major complications, local recurrence-free survival (LRFS) and overall survival (OS) were investigated.
Results: Based on the time-ROC curve analysis, the PNI was superior to other nutritional indices at predicting OS. The optimal cut-off value of PNI was 41.2. The PNI was significantly inversely associated with tumor size, tumor grade, and histological subtype. Patients in the low PNI group (< 41.2) had significantly shorter LRFS and OS than those in the high PNI (≥ 41.2) group, with higher major morbidity and mortality rates. The PNI was found to be a unique nutritional predictor that independently predicted LRFS and OS in the multivariate analysis.
Conclusion: The PNI is an effective tool for nutritional assessment in patients with RLPS. A low PNI value in patients with RLPS predicts worse survival outcomes.
Keywords: nutritional status, prognostic nutritional index, retroperitoneal liposarcoma, major complication, survival
Introduction
Retroperitoneal sarcomas (RPS) are a set of heterogeneous tumors that comprising more than 100 different histological types.1 The predominant form of RPS is retroperitoneal sarcoma (RLPS), accounting for roughly 40–60% of RPS.2 Considering the wide potential space of the retroperitoneum, liposarcoma is most frequently asymptomatic and often discovered as an incidental finding of a huge abdominal mass during check-up.2 Subtle symptoms such as abdominal discomfort, fatigue, dyspepsia or constipation are occasionally reported, but patients with RLPS seldomly present with clinically evident hydronephrosis or bowel obstruction.3 Therefore, accurately evaluate nutritional status in patients with RLPS is quite difficult.
Given that RLPS is prone to encase or abut vital viscera and major vessels, complete resection in a high-volume center is the cornerstone of the management of RLPS.4 Extended surgery with multi-visceral resection commonly involves gastrointestinal resections and has a high postoperative morbidity rate, highlighting the necessity of nutritional evaluation.5 Nutritional status has been recognized as a critical role in tumor progression and prognosis in various cancers.6–8 For the patients with RLPS, the real weight loss can be balanced by the increasing weight of the tumor.9 For this reason, the malnutrition in RLPS patients is easily neglected. Hence, a reliable nutritional screening tool is needed to identify patients with a high risk of malnutrition and to optimize their nutritional status preoperatively when possible.
The screening of nutritional status is crucial in the treatment of RLPS. Various nutritional screening tools, such as the nutritional risk index (NRI), prognostic nutritional index (PNI) and Nutrition Risk Screening 2002 (NRS-2002) have been explored in various type of cancers.7,10,11 The PNI, calculated based on a combination of serum albumin and lymphocyte count, has been used as a prognostic tool for survival in cancer patients.6 The NRI (derived from serum albumin level and the ratio of the actual to usual body weight) has also been reported to be a useful nutritional tool in patients with soft tissue sarcoma (STS).8 To date, standard nutritional assessment has not been thoroughly explored in patients with RLPS.
Owing to its rarity, histology-tailored outcomes of nutritional status for RPS have seldom been reported. Therefore, the study aimed to explore the prognostic utility of nutritional parameters in patients with RLPS.
Materials and Methods
Study Population
This cohort enrolled all consecutive patients operated at Peking University Cancer Hospital Sarcoma Center for RLPS between April 2011 and August 2022. Clinical data was extracted from a prospectively maintained database. None of the patients received neoadjuvant and adjuvant chemotherapy or radiotherapy in this study. The inclusion criteria included pathologically diagnosed liposarcoma, available medical records and follow-up data, absence of metastasis, and not received preoperative chemoradiotherapy or targeted therapy. Patients were excluded: a) who received prior antitumor treatment (n=5), b) lost to follow-up (n=2), c) diagnosed with acute infection or chronic inflammatory diseases (n=4), d) had incomplete laboratory results (n=3). Finally, 189 patients were included in the current study.
The study was performed in compliance with the Declaration of Helsinki. Ethical approval was acquired from Peking University Beijing Cancer Hospital. All patients signed the informed consent prior to surgery.
Diagnosis and Definitions
The histology of the patients was diagnosed by two specialized pathologists in sarcomas. MDM2 (mouse double minute 2) amplification was performed to confirm the diagnosis if needed.2 Pathological subtypes were evaluated based on the 2020 World Health Organization criteria for soft tissue tumors.12 Surgical resections were grouped as macroscopically complete (R0/R1) or macroscopically incomplete (R2). Tumor size was defined as the sum of the largest tumor diameters. Tumor grading was determined based on the grading system of the French Federation of Cancer Centers Sarcoma Group (FNCLCC).13 Multifocality was defined as the presence of more than one noncontiguous tumor through pathological confirmation.
The parameters to assess short-term clinical outcomes were: length of postoperative hospital stay, estimated blood loss, operation time, and major morbidity. The postoperative complications were evaluated based on the Clavien–Dindo classification and recorded “major” if grade III or higher occurred.14
Definition of Nutritional Indices
Preoperative laboratory test results, comprising serum albumin, lymphocyte count, weight and height were obtained within a week before operation. Nutritional indicators were calculated as following formula: The PNI15 = albumin (g/L) + 5*lymphocyte count (109/L); NRI16 = 1.487 * albumin level (g/L) + 41.7 * preoperative weight/ideal body weight (kg). We defined ideal body weight as 22 *height (m)2 based on previously described methods.7
BMI was calculated as weight (kg)/height (m)2,17 Briefly, NRS-2002 incorporates three parameters: impaired nutritional status (0–3 points), severity of disease (0–3 points), and age (0–1 points). A total score of ≥3 points represents that the patient is at risk of malnutrition.18
Follow-up
Patients were regularly followed up every 3 months during the first 2 years after discharge and every 6 months thereafter. During each follow-up, blood test, physical examination, abdominopelvic computed tomography (CT) or magnetic resonance imaging (MRI) were routinely conducted.
The primary outcomes were major complication rate, LRFS and OS. LRFS was regarded as the time between surgery and the local recurrence or last follow-up. OS was regarded as the time between surgery and death or last follow-up.
Statistical Analysis
Continuous variables are presented as median (interquartile range, IQR) and were compared using the two-sided Chi square test or Fisher’s exact test. Categorical variables are given as absolute number (percentage) and were performed using the Mann–Whitney U-test. The area under the ROC curve (AUC) was estimated to compare prognostic ability of nutritional indicators in predicting OS by using time-dependent receiver operating characteristic (time-ROC) curve analysis.19 X-tile analysis was performed and the largest point of the log-rank statistic for 5-year OS determined the optimal cut-off values of nutritional indicators.20 The independent risk factors on major complications were determined by performing univariate and multivariate logistic regression analyses and reported as odds ratios (ORs). The independent predictors of LRFS and OS were identified via univariate and multivariate Cox regression analysis and expressed as hazard ratios (HRs). Kaplan–Meier method was used to plot survival curves and the Log rank test was conducted to compare the differences. Results was considered statistically significant at p-value < 0.05. X-tile software (version v3.6.1, Yale University) were utilized to perform X-tile analysis. Other statistical analyses were performed using SPSS version 26.0 (Chicago, IL, USA) and R software (version 3.6.1).
Results
Baseline Clinicopathological and Treatment Characteristics
A total of 189 consecutive patients operated for RLPS in the study period enrolled the study (Table 1). The proportion of male and female was 55% and 45%, respectively. The median age was 57 (IQR 48–63) years, with a median BMI of 23.4 (IQR:21.5–25.8). The median tumor size was 20 (IQR 14–28) cm. The most common histologic subtype was DDLPS (64.6%), followed by WDLPS (25.9%), MLPS (4.2%), and PLPS (5.3%). Furthermore,111 patients (58.7%) had primary tumors and 71 patients (37.6%) presented with multifocality. The G1, G2 and G3 tumors were identified in 47 (24.9%), 80 (42.3%) and 62 (32.8%) patients, respectively. 91% of patients underwent complete resection and the median number of resected organs was 5 (IQR 4–7). The majority of patients were classified as NRS-2002 < 3 (79.4%).
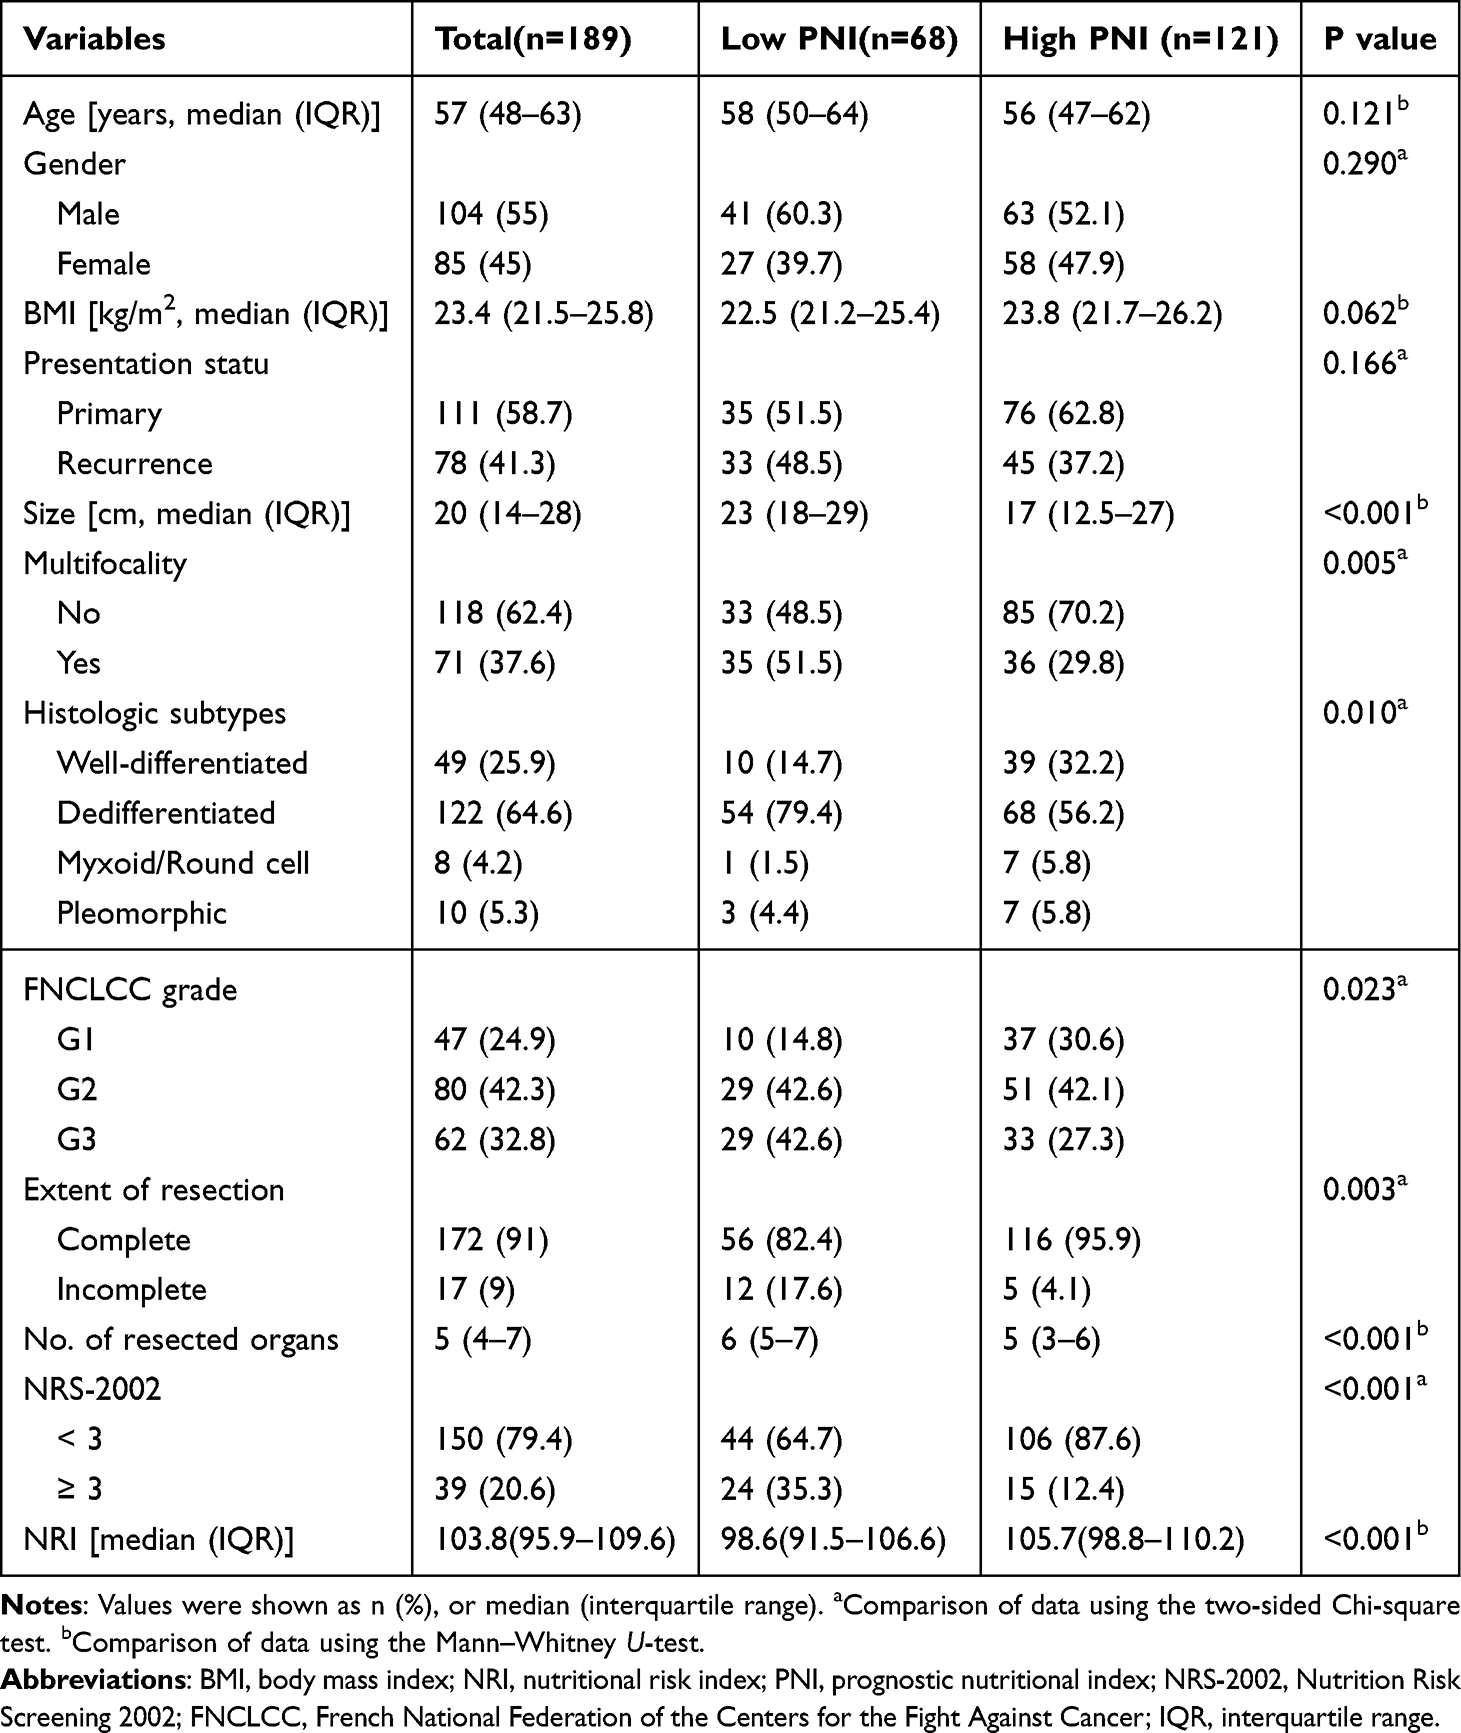 |
Table 1 The Baseline Clinicopathologic and Treatment Characteristics of All Patients, as Well as Patients in the Low (< 41.2) and High (≥41.2) PNI Groups |
Comparison of the Ability of Nutritional Indicators in Predicting OS
As shown in the Figure 1, the AUC of the PNI for predicting OS was markedly greater than those of the BMI, NRI and NRS-2002 at all tested timepoints. Therefore, the PNI was superior for predicting OS in RPLS patients than any other markers assessed. The AUCs of the PNI in predicting the 1-, 3-, and 5-year OS were 0.682, 0.673, and 0.723, respectively. The results for the NRI, BMI and NRS-2002 were shown in Supplementary Table 1.
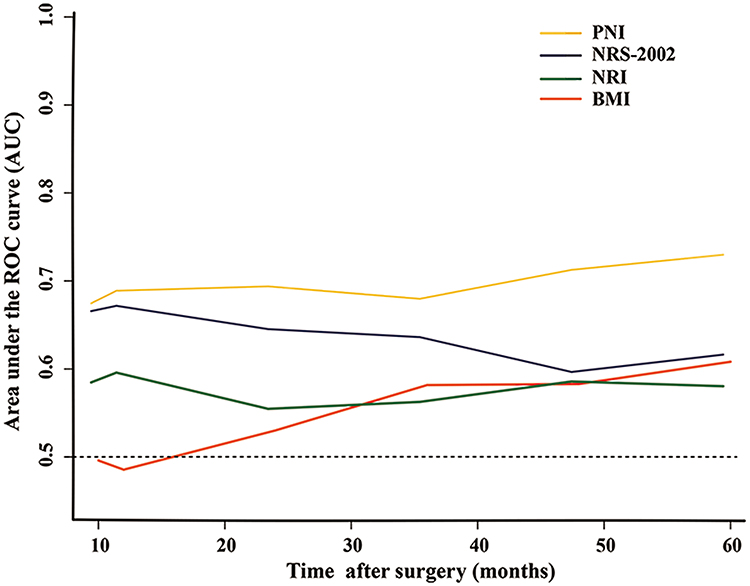 |
Figure 1 Time-ROC curve analysis to compare the ability of PNI, NRS-2002, NRI and BMI in predicting overall survival. The horizontal axis depicts the time after surgery, and the vertical axis depicts the corresponding area under the ROC curve for survival at different time points. Abbreviations: BMI, body mass index; NRI, nutritional risk index; PNI, prognostic nutritional index; NRS-2002, Nutrition Risk Screening 2002. |
X-tile Analysis to Assess the Optimal Out-off Values
The optimal cut-off values of nutritional indicators were determined by applying X-tile analysis for 5-year OS. Accordingly, patients were divided into low and high groups in terms of the optimal cut-off values. The optimal cut-off values of PNI and NRI were 41.2 and 90.5, respectively (Supplementary Figure 1). Therefore, based on the optimal cut-off value of the PNI, the whole cohort were divided into low (< 41.2, n = 68) and high (≥ 41.2, n = 121) PNI groups.
Association Between PNI and Clinicopathologic Characteristics
The correlation between PNI and clinicopathologic characteristics were shown in Table 1. Compared with patients in high PNI group, those in low PNI group were more likely to have larger tumors (p < 0.001), advanced FNCLCC grade (p = 0.023), and multifocality (p = 0.005). The patients in high PNI group were more likely to receive complete resection (p = 0.003) and less number of resected organs (p < 0.001). More important, the low PNI group also had markedly lower NRI (p < 0.001) and higher proportion of NRS-2002 ≥3 (p < 0.001). Nevertheless, no remarkably association were detected between the two groups in terms of BMI, presentation status, age, and gender.
Short- and Long-term Outcomes
Operative data and the short- and long-term surgical outcomes of all the patients are presented in Table 2. The patients experienced longer median operative time (537 vs 420 min, p<0.001) and greater median estimated blood loss (1800 vs 800 mL, p<0.001) in the low PNI group. The major morbidity and 60-day mortality rates in the low PNI group were higher than that in the high PNI groups (32.4% vs 19%, p = 0.039; 5.8% vs 0.8%, p=0.038; respectively). The reoperation rates and postoperative hospitalization time were comparable between the low and high PNI groups.
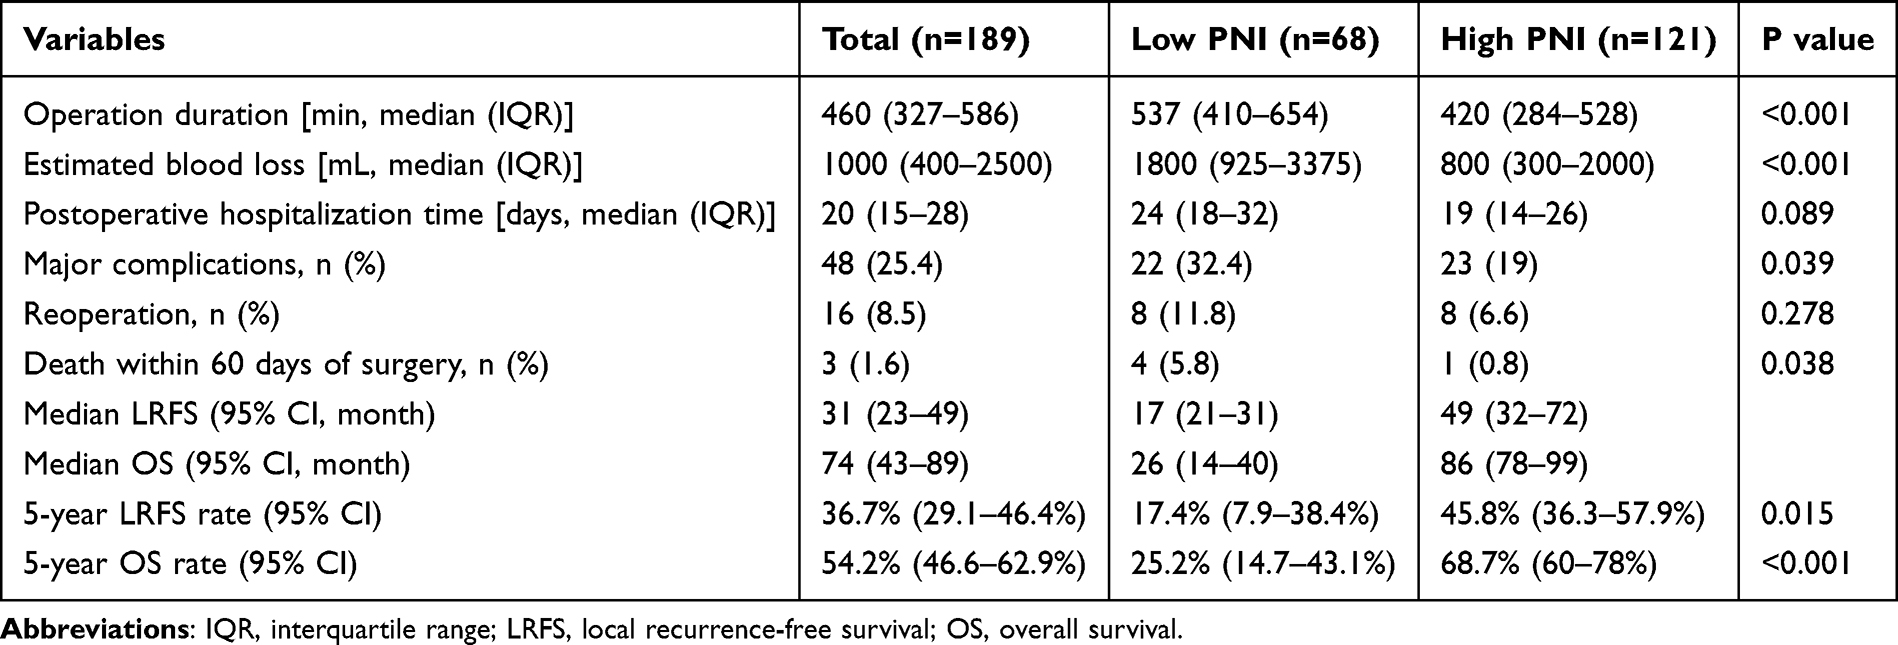 |
Table 2 Short- and Long-Term Outcomes in Patients Undergoing Surgery for Retroperitoneal Liposarcoma |
With a median follow-up of 55 (IQR 29–80) months, the median LRFS and 5-year LRFS rates in the low PNI group was markedly worse than that in the high PNI group (17 vs 49 months, p<0.001; 17.4% vs 45.8%, p=0.015; respectively) (Figure 2A). Meanwhile, the low PNI group was observed with significantly worse median OS and 5-year OS rates than that of the high PNI group (26 vs 86 months, p<0.001; 25.2% vs 68.7%, p<0.001; respectively) (Figure 2B).
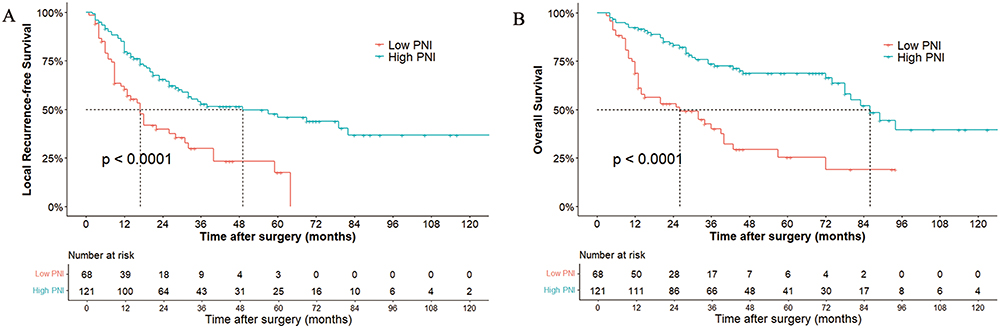 |
Figure 2 Comparison of local recurrence-free survival (A) and overall survival (B) between patients with high and low PNI groups in the entire patient cohort. |
Univariable and Multivariable Analyses
We performed univariate logistic regression analyses to evaluate risk factors on major complication. The results showed that none of clinical features as significantly prognostic parameters were associated with major complication (Supplementary Table 2). Clinical features including gender, presentation, histological subtypes, multifocality, FNCLCC grade, extent of resection, NRS-2002, NRI, and PNI were studied in the multivariate analysis for LRFS. The results revealed that presentation, multifocality, FNCLCC grade, extent of resection and PNI were independent predictors for LRFS (Table 3). Moreover, variables including age, presentation, histological subtypes, multifocality, FNCLCC grade, extent of resection, the number of resected organs, NRS-2002, NRI, and PNI were incorporated into the multivariate analysis for OS. Age, presentation, FNCLCC grade, extent of resection, and PNI were independent factors affecting OS (Table 3).
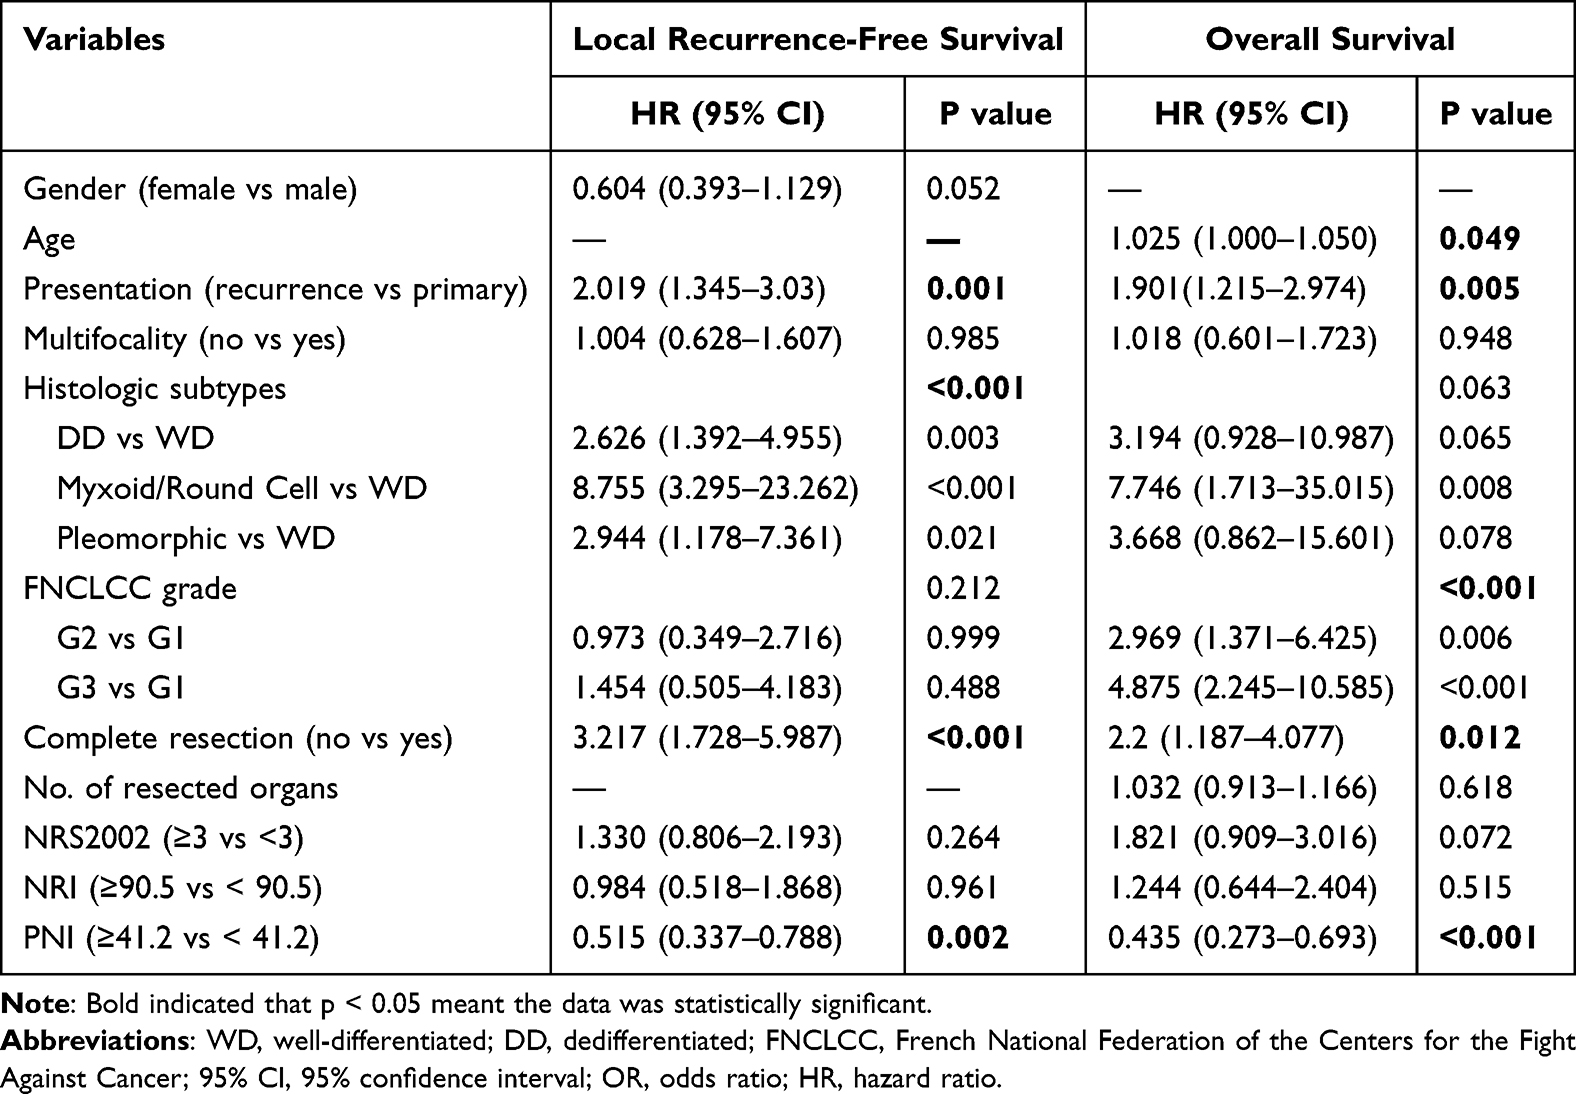 |
Table 3 Multivariate Analysis of Variables Influencing LRFS and OS |
Clinical Utility Assessment of PNI in Predicting LRFS and OS via Subgroup Analyses
To investigate the clinical utility of the PNI, subgroup analyses were performed via univariate Cox regression. As shown in Figure 3, we found that the PNI was significantly inversely associated with LRFS and OS across nearly all different clinicopathologic characteristics. The detail clinicopathologic characteristics were as follows: gender (female or male), age (≤60 or >60 years), presentation status (primary or recurrence), multifocality (no or yes), histological subtypes (well-differentiated, Dedifferentiated, Myxoid/Round cell or Pleomorphic), FNCLCC grade (G1, G2 or G3), and extent of resection (complete or incomplete). Although it failed to acquire statistical significance in subgroup analyses based on specific clinical features, the trend of decreased survival in patients with low PNI value was consistent.
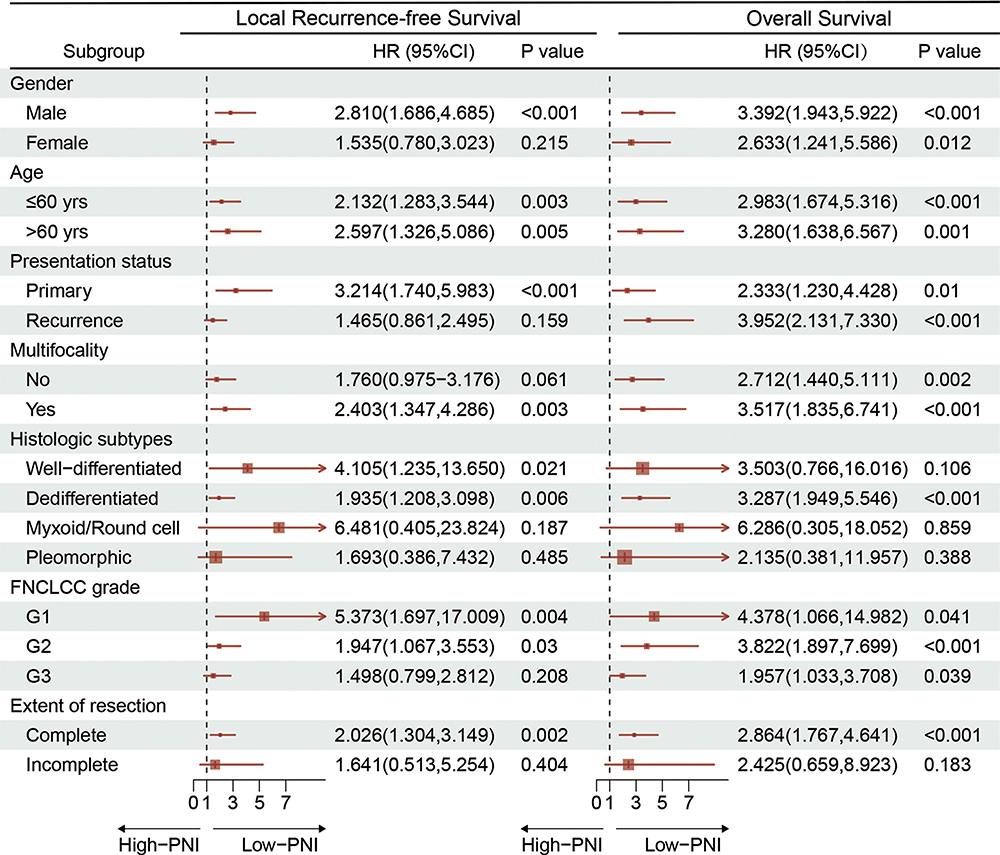 |
Figure 3 Subgroup analyses using univariate Cox regression to assess the discrimination ability of PNI for local recurrence-free survival and overall survival in patients with different clinical characteristics. Abbreviations: FNCLCC, French Federation of Cancer Centers Sarcoma Group; HR, hazard ratio; 95% CI, 95% confidence interval. |
Discussion
Nutritional status is considered vital to the prognosis of patients with STS.8,21,22 Nevertheless, the methods to accurately evaluate nutritional status in patients with RPS are remain controversial.9,11,23 To the best of our knowledge, our study is the most extensive study evaluating the prognostic value of various nutritional indices in a homogeneous population of patients undergoing surgery for RLPS.
The surgical policies for patients with RPS have been well described.24,25 However, there has been growing interest in the nutritional assessment of patients with RPS in recent years.9,11,23,26,27 RLPS is a rare sarcoma that originates from mesenchymal cells. It tends to reach a large size at diagnosis and affects body weight with its volume.2 Surgery is the mainstay of treatment for RLPS. An extended surgical procedure necessitates en bloc resection of the surrounding organs, commonly involving the gastrointestinal tract.5 Therefore, assessing nutritional status is particularly important in the global management of RLPS. Considering that real weight loss can be masked by the increasing weight of the tumor, assessing weight loss is difficult in patients with RLPS.9 Thus, a comprehensive and detailed nutritional assessment is required for patients with RLPS.
Recently, numerous nutritional indices, such as NRI, NRS-2002, and PNI, are available to assess and score nutritional status in variety of cancers.9,11 In our study, time-dependent ROC analysis showed that the PNI is a preferred tool to assess the nutritional status of patients with RLPS. Compared to NRS-2002 and NRI, PNI was also identified as an independent predictor of LRFS and OS in multivariable analyses. The prognostic performance of BMI is limited, likely because BMI is based on weight and height, without taking into account the actual body composition.28 The NRI, which is derived from serum albumin level and the ratio of the actual to usual body weight, has been reported to be a predictor of prognosis in various types of cancer.7 However, a study from France reported that the NRI fails to show an independent prognostic value for patients with RPS, which is consistent with the finding of our study.11 The NRS-2002 have been used to predict prognosis in patients undergoing gastrointestinal surgery.29 But its prognosis utility was found to be limited in our study. The poor predictive ability of these nutritional indices may be because they are characterized by weight-based classifications. Given the low proportion of weight loss in RLPS patients, changes in weight as a standard to assess nutritional status seem inadequate in predicting the prognosis. Here, the use of a combination of specific laboratory markers was useful in patients for predicting the prognosis with RLPS.
The PNI, which combines albumin levels and lymphocyte counts, reflects nutritional status of cancer patients and predicts prognosis.6,30,31 In this study, the PNI showed prognostic superiority in patients with RLPS. Patients in the low PNI group were more likely to have larger tumors, advanced FNCLCC grade, and multifocality, indicating that aggressive tumors correlated with decreased nutritional status. Similar to our findings, in a series of 100 patients, a low PNI value was remarkably associated with adverse outcomes.22 The reason why the PNI is associated with cancer prognosis is not completely understood, but the speculations for this association are listed below. Serum albumin is an important indicator of nutritional status and it reflects a negative catabolic state of the body.32,33 Whereas peripheral lymphocytes help prevent the proliferation, and invasion by cancer cells, and contribute to establish the immune response.34
Extended surgery with multi-visceral resection for RLPS commonly comprises gastrointestinal resections. Accordingly, the rate of postoperative morbidity is high and the occurrence of complications is potentially exacerbated by malnutrition.26,35 In the present study, patients in the low PNI group experienced a longer median operative time and greater estimated blood loss. As for the short-term outcomes, the major morbidity and 60-day mortality rates in the low PNI group were higher than that in the high PNI groups. Despite reoperation rate and postoperative hospitalization time failed to show significant differences between the low and high PNI groups, the trend of unfavorable outcome was observed in the low PNI group. This may be due to the invasive surgical strategy for RLPS, which involves pancreas and major vessel resection.36 Therefore, greater attention should be paid to preoperatively nutritional evaluation and support to mitigate complications. Undoubtedly, further large-sample studies are needed to clarify the role of PNI in predicting major complications in patients with RLPS.
More importantly, multivariable analyses identified the independent prognostic value of PNI for LRFS and OS in patients with RLPS. The 5-year LRFS rate of patients in the high-PNI group was 28% higher than that in the low-PNI groups (45.8% vs 17.4%, P = 0.015). Whereas, the 5-year OS rate of patients in the low-PNI group was lower than that in the high-PNI groups (25.2% vs.68.7%, P<0.001). Moreover, PNI showed good clinical applicability in patients across different clinicopathological features. Accordingly, the PNI was able to better identify a high-risk population with unpromising prognosis, which can guide clinicians to monitor disease progression accurately and to plan individualized treatment strategies.
Taken together, our findings offer valuable insights into the prognostic utility of the PNI in the comprehensive nutritional assessment of patients with RLPS. However, our study has several limitations. First, this study was performed retrospectively and inherent selection bias could not be avoided. Second, the optimal cut-off values for the nutritional indices may fluctuate with different sample size. In addition, some patient-specific variables, such as age, alcoholism, mental health issues, medical comorbidities, smoking status, poor socioeconomic status, and access to healthy food, may affect the evaluation of nutritional status using the PNI. Third, although this is the largest cohort focused on RLPS reported to date, the sample size was limited. Hence, further studies involving multi-institutional and international collaborations are required to confirm the results of the current study.
Conclusion
The preoperative PNI is the preferred tool to assess the nutritional status of patients with RLPS, as it is objective, economical, reproducible and has robust predictive ability. The PNI independently predicts poor survival and offers valuable information to aid in the perioperative nutritional management of patients with RLPS. Further large-sample studies were warranted to confirm the findings.
Data Availability
The datasets used and analyzed during the current study are available from the corresponding author on reasonable request.
Ethics Approval and Informed Consent
The study was conducted in accordance with the Declaration of Helsinki and approved by the Ethics Committee of the Peking University Cancer Hospital. All patients provided written informed consent before surgery.
Author Contributions
All authors made a significant contribution to the work reported, whether that is in the conception, study design, execution, acquisition of data, analysis and interpretation, or in all these areas; took part in drafting, revising or critically reviewing the article; gave final approval of the version to be published; have agreed on the journal to which the article has been submitted; and agree to be accountable for all aspects of the work.
Funding
This work was supported by a grant from Science Foundation of Peking University Cancer Hospital (approval No.PY202308), Beijing Municipal Administration of Hospital’s Ascent Plan (approval No. DFL20181104), and Science Foundation of Peking University Cancer Hospital (approval No.XKFZ2421).
Disclosure
The authors declare that they have no competing interests in this work.
References
1. de Bree E, Michelakis D, Heretis I, et al. Retroperitoneal soft tissue sarcoma: emerging therapeutic strategies. Cancers. 2023;15(22):5469. doi:10.3390/cancers15225469
2. Danieli M, Swallow CJ, Gronchi A. How to treat liposarcomas located in retroperitoneum. Eur J Surg Oncol. 2023;49(6):1068–1080. doi:10.1016/j.ejso.2022.04.020
3. Lee ATJ, Thway K, Huang PH, Jones RL. Clinical and molecular spectrum of liposarcoma. J Clin Oncol. 2018;36(2):151–159. doi:10.1200/JCO.2017.74.9598
4. Tirotta F, Bacon A, Collins S, et al. Primary retroperitoneal sarcoma: a comparison of survival outcomes in specialist and non-specialist sarcoma centres. Eur J Cancer. 2023;188:20–28. doi:10.1016/j.ejca.2023.04.004
5. Radaelli S, Baia M, Drohan A, et al. Six surgical stages in the resection of primary right retroperitoneal liposarcoma: a standardized comprehensive approach. Ann Surg Oncol. 2023;30(11):6896–6897. doi:10.1245/s10434-023-13660-8
6. Luo Z, Zhou L, Balde AI, et al. Prognostic impact of preoperative prognostic nutritional index in resected advanced gastric cancer: a multicenter propensity score analysis. Eur J Surg Oncol. 2019;45(3):425–431. doi:10.1016/j.ejso.2018.09.004
7. Guo Y, Wang R, Wu P, et al. Preoperative nutritional risk index predicts recurrence of oligometastatic prostate cancer in patients undergoing cytoreductive radical prostatectomy. Nutr Cancer. 2021;73(8):1440–1447. doi:10.1080/01635581.2020.1795694
8. Jiao Z, Liang C, Luo G, et al. Prognostic utility of nutritional risk index in patients with head and neck soft tissue sarcoma. Nutrients. 2023;15(3):641. doi:10.3390/nu15030641
9. Casirati A, Baia M, Vandoni G, et al. Risk of misclassification during diagnosis of malnutrition in retroperitoneal sarcoma patients. Clin Nutr ESPEN. 2022;49:459–465. doi:10.1016/j.clnesp.2022.02.125
10. Wan M, Zhang L, Chen C, et al. GLIM criteria-defined malnutrition informs on survival of nasopharyngeal carcinoma patients undergoing radiotherapy. Nutr Cancer. 2022;74(8):2920–2929. doi:10.1080/01635581.2022.2044059
11. Kirov KM, Xu HP, Crenn P, et al. Role of nutritional status in the early postoperative prognosis of patients operated for retroperitoneal liposarcoma (RLS): a single center experience. Eur J Surg Oncol. 2019;45(2):261–267. doi:10.1016/j.ejso.2018.07.001
12. Kallen ME, Hornick JL. The 2020 WHO classification: what’s new in soft tissue tumor pathology? Am J Surg Pathol. 2021;45(1):e1–e23. doi:10.1097/PAS.0000000000001552
13. Neuville A, Chibon F, Coindre J-M. Grading of soft tissue sarcomas: from histological to molecular assessment. Pathology. 2014;46(2):113–120. doi:10.1097/PAT.0000000000000048
14. Dindo D, Demartines N, Clavien P-A. Classification of surgical complications: a new proposal with evaluation in a cohort of 6336 patients and results of a survey. Ann Surg. 2004;240(2):205–213. doi:10.1097/01.sla.0000133083.54934.ae
15. Onodera T, Goseki N, Kosaki G. Prognostic nutritional index in gastrointestinal surgery of malnourished cancer patients. Nihon Geka Gakkai Zasshi. 1984;85(9):1001–1005.
16. Bouillanne O, Morineau G, Dupont C, et al. Geriatric nutritional risk index: a new index for evaluating at-risk elderly medical patients. Am J Clin Nutr. 2005;82(4):777–783. doi:10.1093/ajcn/82.4.777
17. Renehan AG, Tyson M, Egger M, Heller RF, Zwahlen M. Body-mass index and incidence of cancer: a systematic review and meta-analysis of prospective observational studies. Lancet. 2008;371(9612):569–578. doi:10.1016/S0140-6736(08)60269-X
18. Kondrup J, Rasmussen HH, Hamberg O, Stanga Z. Nutritional risk screening (NRS 2002): a new method based on an analysis of controlled clinical trials. Clin Nutr. 2003;22(3):321–336. doi:10.1016/s0261-5614(02)00214-5
19. Blanche P, Dartigues J-F, Jacqmin-Gadda H. Estimating and comparing time-dependent areas under receiver operating characteristic curves for censored event times with competing risks. Stat Med. 2013;32(30):5381–5397. doi:10.1002/sim.5958
20. Camp RL, Dolled-Filhart M, Rimm DL. X-tile: a new bio-informatics tool for biomarker assessment and outcome-based cut-point optimization. Clin Cancer Res. 2004;10(21):7252–7259. doi:10.1158/1078-0432.CCR-04-0713
21. Hendrickson NR, Mayo Z, Shamrock A, et al. Sarcopenia is associated with increased mortality but not complications following resection and reconstruction of sarcoma of the extremities. J Surg Oncol. 2020;121(8):1241–1248. doi:10.1002/jso.25898
22. Matsuyama Y, Nakamura T, Yoshida K, et al. Role of the prognostic nutritional index in patients with soft-tissue sarcoma. Vivo. 2021;35(4):2349–2355. doi:10.21873/invivo.12511
23. Zhao M, Lv M, Fang Y, et al. Sarcopenia is associated with worse surgical complications but not relapse-free survival and overall survival in patients with retroperitoneal liposarcoma. World J Surg Oncol. 2022;20(1):404. doi:10.1186/s12957-022-02846-1
24. Munoz P, Bretcha-Boix P, Artigas V, Asencio JM. Surgical principles of primary retroperitoneal sarcoma in the era of personalized treatment: a review of the frontline extended surgery. Cancers. 2022;14(17):4091. doi:10.3390/cancers14174091
25. Perhavec A, Provenzano S, Baia M, et al. Inoperable primary retroperitoneal sarcomas: clinical characteristics and reasons against resection at a single referral institution. Ann Surg Oncol. 2021;28(2):1151–1157. doi:10.1245/s10434-020-08789-9
26. Nasirishargh A, Grova M, Bateni CP, et al. Sarcopenia and frailty as predictors of surgical morbidity and oncologic outcomes in retroperitoneal sarcoma. J Surg Oncol. 2023;127(5):855–861. doi:10.1002/jso.27199
27. Previtali P, Fiore M, Colombo J, et al. Malnutrition and perioperative nutritional support in retroperitoneal sarcoma patients: results from a prospective study. Ann Surg Oncol. 2020;27(6):2025–2032. doi:10.1245/s10434-019-08121-0
28. Landi F, Calvani R, Cesari M, et al. Sarcopenia: an overview on current definitions, diagnosis and treatment. Curr Protein Pept Sci. 2018;19(7):633–638. doi:10.2174/1389203718666170607113459
29. Schiesser M, Müller S, Kirchhoff P, Breitenstein S, Schäfer M, Clavien P-A. Assessment of a novel screening score for nutritional risk in predicting complications in gastro-intestinal surgery. Clin Nutr. 2008;27(4):565–570. doi:10.1016/j.clnu.2008.01.010
30. Mohri Y, Inoue Y, Tanaka K, Hiro J, Uchida K, Kusunoki M. Prognostic nutritional index predicts postoperative outcome in colorectal cancer. World J Surg. 2013;37(11):2688–2692. doi:10.1007/s00268-013-2156-9
31. Kanda M, Fujii T, Kodera Y, Nagai S, Takeda S, Nakao A. Nutritional predictors of postoperative outcome in pancreatic cancer. Br J Surg. 2011;98(2):268–274. doi:10.1002/bjs.7305
32. Don BR, Kaysen G. Serum albumin: relationship to inflammation and nutrition. Semin Dial. 2004;17(6):432–437. doi:10.1111/j.0894-0959.2004.17603.x
33. Barreto-Andrade JC, Medina-Franco H. Serum albumin is an independent prognostic factor for survival in soft tissue sarcomas. Rev Invest Clin. 2009;61(3):198–204.
34. Ray-Coquard I, Cropet C, Van Glabbeke M, et al. Lymphopenia as a prognostic factor for overall survival in advanced carcinomas, sarcomas, and lymphomas. Cancer Res. 2009;69(13):5383–5391. doi:10.1158/0008-5472.CAN-08-3845
35. Ruff SM, Grignol VP, Contreras CM, Pollock RE, Beane JD. Morbidity and mortality after surgery for retroperitoneal sarcoma. Curr Oncol. 2022;30(1):492–505. doi:10.3390/curroncol30010039
36. Lv A, Liu D-N, Wang Z, et al. Short- and long-term surgical outcomes of pancreatic resection for retroperitoneal sarcoma: a long-term single-center experience of 90 cases. J Surg Oncol. 2023;127(4):633–644. doi:10.1002/jso.27160
 © 2024 The Author(s). This work is published and licensed by Dove Medical Press Limited. The
full terms of this license are available at https://www.dovepress.com/terms.php
and incorporate the Creative Commons Attribution
- Non Commercial (unported, 3.0) License.
By accessing the work you hereby accept the Terms. Non-commercial uses of the work are permitted
without any further permission from Dove Medical Press Limited, provided the work is properly
attributed. For permission for commercial use of this work, please see paragraphs 4.2 and 5 of our Terms.
© 2024 The Author(s). This work is published and licensed by Dove Medical Press Limited. The
full terms of this license are available at https://www.dovepress.com/terms.php
and incorporate the Creative Commons Attribution
- Non Commercial (unported, 3.0) License.
By accessing the work you hereby accept the Terms. Non-commercial uses of the work are permitted
without any further permission from Dove Medical Press Limited, provided the work is properly
attributed. For permission for commercial use of this work, please see paragraphs 4.2 and 5 of our Terms.