")
Back to Journals » Drug Design, Development and Therapy » Volume 19
Proteomic Analysis of Retinas in a Rat Model of High-Fat Diet-Induced Type 2 Diabetes: Implications of Interventional Targets for Nonproliferative Diabetic Retinopathy
Authors Pang X, Bai S, Feng Z, Zhang Y, Hu B , Zhang Y
Received 1 November 2024
Accepted for publication 25 February 2025
Published 17 April 2025 Volume 2025:19 Pages 2979—2999
DOI https://doi.org/10.2147/DDDT.S501318
Checked for plagiarism Yes
Review by Single anonymous peer review
Peer reviewer comments 2
Editor who approved publication: Prof. Dr. Georgios Panos
Xueyi Pang,* Siqiong Bai,* Zhinan Feng, Yumin Zhang, Bojie Hu, Yan Zhang
Tianjin Key Laboratory of Retinal Functions and Diseases, Tianjin Branch of National Clinical Research Center for Ocular Disease, Eye Institute and School of Optometry, Tianjin Medical University Eye Hospital, Tianjin, 300384, People’s Republic of China
*These authors contributed equally to this work
Correspondence: Bojie Hu; Yan Zhang, Tianjin Key Laboratory of Retinal Functions and Diseases, Tianjin Branch of National Clinical Research Center for Ocular Disease, Eye Institute and School of Optometry, Tianjin Medical University Eye Hospital, Tianjin, 300384, People’s Republic of China, Tel +86 22 86428700 ; +86 22 86428863, Fax +86 22 86428777, Email [email protected]; [email protected]
Purpose: This study aimed to establish a high-fat diet (HFD)-induced rat model of type 2 diabetes mellitus (T2DM) and employed tandem mass tag (TMT) proteomics to search for novel interventional targets for nonproliferative diabetic retinopathy (NPDR).
Patients and Methods: Six-week-old male Sprague–Dawley rats were randomly divided into a T2DM group fed a HFD and a normal group (NOR group) fed normal chow. After 6 w, the T2DM group was confirmed to have impaired glucose tolerance and was intraperitoneally injected with a single small dose of streptozotocin (STZ, 30 mg/kg), and blood glucose levels were monitored. The HFD was maintained for another 6 w, and an Evans blue assay and a dark-adapted electroretinogram (ERG) were conducted. Rat retinas were collected for morphology analysis, TMT proteomics analysis, and Western blotting. The expression patterns of selected differentially expressed proteins (DEPs) were validated in rat retinas via Western blotting and in aqueous humor from NPDR patients via slot blotting.
Results: After the 12-w HFD and STZ injection, the rats presented typical symptoms of T2DM. The retinas of T2DM rats presented pathological features of NPDR, including compromised scotopic ERGs, thinning of retinal layers, increased apoptosis and vascular leakage in the retina. Proteomic analysis identified DEPs and revealed profound dyslipidemia in T2DM rat retinas. The significant upregulation of the FABP3, TINAGL1, and COL4A3 proteins was validated in the retinas of the rats by Western blotting and in the aqueous humor of the NPDR patients by slot blotting.
Conclusion: In a rat model of HFD-induced T2DM that is consistent with the natural history and pathological features of NPDR, proteomics and bioinformatics analyses identified FABP3, TINAGL1, and COL4A3 as the 3 key upregulated proteins in retinas for the first time. These findings are supported by technical and clinical validations and provide novel targets for NPDR intervention.
Keywords: nonproliferative diabetic retinopathy, interventional targets, animal model, type 2 diabetes, proteomics, fatty acid metabolism
Introduction
Diabetes mellitus (DM) is a multifactorial disease resulting from dysregulation of glucose and lipid metabolism.1 DM is categorized into type 1 diabetes (T1DM) and type 2 diabetes (T2DM). The former is caused mainly by autoimmune reactions to pancreatic β-cells and deficient insulin secretion; the latter is characterized by insulin resistance and subsequent insufficient insulin secretion.2 T2DM accounts for 90–95% of diabetic cases.3 Moreover, diabetes elicits a variety of microvascular complications, among which diabetic retinopathy (DR) is the most prevalent ocular complication and the leading cause of blindness in the working-age population.4 Under DR conditions, long-term metabolic disorders cause breakdown of the blood‒retinal barrier and disturbances in the retinal microcirculation, leading to ischemia and hypoxia in the retina and disease progression.5,6 DR can be divided into nonproliferative diabetic retinopathy (NPDR) and proliferative diabetic retinopathy (PDR) according to disease severity.7
Vascular endothelial growth factor (VEGF) is a key proinflammatory, angiogenic, and vascular permeability factor that plays a crucial role in the pathogenesis and development of DR and has become the target of first-line treatment for DR.8–10 Indeed, anti-VEGF agents, such as ranibizumab, conbercept, and aflibercept, have been shown to effectively reduce vascular leakage and bleeding, inhibit retinal neovascularization, and improve the quality of vision in DR patients.11 Nonetheless, long-term blockade of VEGF and VEGF-mediated signaling pathways may deprive neural and vascular endothelial cells in the retina of trophic effects, which may exacerbate retinal damage under diabetic conditions.12,13 More importantly, clinical studies have reported that more than 40% of DR patients are unresponsive or develop resistance to anti-VEGF agents.14 Therefore, it is necessary to search for molecular targets independent of VEGF and VEGF-mediated signaling pathways to supplement the anti-VEGF strategy for DR.
One clinical characteristic of DR is that it manifests mild symptoms at the early NPDR stage; however, if timely and effective interventional measures are not taken, it becomes aggravated through the NPDR stage and progresses to PDR.15 In the advanced stage of DR, conventional therapeutic modalities such as laser photocoagulation and vitrectomy have difficulty generating satisfactory effects,16 and anti-VEGFs have limitations, as mentioned above; hence, the risk of vision loss is greatly increased.17 As such, interventions at the NPDR stage play crucial roles in improving DR outcomes and should be developed to combat this prevalent blinding diabetic complication. However, since the majority of NPDR cases do not involve surgical procedures such as vitrectomy,18–20 the collection of a sufficient number of retina or vitreous humor samples from patients would be ethnically overwhelming and clinically difficult for molecular target exploration. Thus, an animal model that conforms to the natural history of NPDR and is inextricably linked to the pathogenesis and pathologies of the disease would greatly facilitate such a task.
At present, major rodent models of DM are established by repeated intraperitoneal (IP) injections21 or a single intravenous injection22 of high-dose streptozotocin (STZ). STZ is toxic, and the amount injected causes permanent and complete destruction of pancreatic β-cells and deficient insulin secretion,23 recapitulating the pathogenesis of T1DM. However, the predominant proportion of NPDR patients with T2DM supports the utilization of T2DM rodent models for studying NPDR pathogenesis and therapeutics.24 However, the phenotypes of commonly used T2DM rodent models, such as db/db mice and Zucker fatty rats, result from point mutations in the leptin receptor-encoding gene, not from the regulation of environmental factors.25 Therefore, in this study, we sought to establish a rat model of T2DM by employing a 12-week high-fat diet (HFD) program and a low-dose IP injection of STZ to induce dysregulated lipid and glucose metabolism, leveraging both environmental factors (HFD-induced obesity) and genetic susceptibility (rats are inherently more sensitive to STZ toxicity than are mice) to mimic the natural history of NPDR. The retinal pathological features of the HFD-induced T2DM rat model were consistent with those of NPDR. Furthermore, tandem mass tag (TMT) proteomics was used to analyze protein expression profiles in diabetic retinas to reveal the pathogenesis of and identify potential interventional targets for NPDR. The expression patterns of the selected protein targets were subsequently validated by Western blotting and in aqueous humor samples from NPDR patients by slot blotting, thereby supporting the technological reliability and clinical relevance of the selected targets, respectively.
Materials and Methods
Animals
Six-week-old male Sprague–Dawley (SD) rats were purchased from Beijing Vital River Laboratory Animal Technology Co., Ltd. (Beijing, China). The sample size was calculated via the N= (Zα+Zβ)2×2×(σ2/δ2) formula.26,27 The statistical power is 0.9, and the 2-sided significance level is 0.05. Under a normal distribution, α=0.05, Zα=1.96; 1-β=0.9, Zβ=1.28. According to prior studies,22,28 σ=13.54, δ=27.06, and N = 5.26. Therefore, at least 6 animals per group were used in the experiments of this study. Moreover, some experiments in this study involved euthanizing the animals and collecting samples; therefore, the experiments were conducted on different animals, and 3 batches of SD rats were ordered. The rats were raised in an SPF-grade environment in the animal facility of Tianjin Medical University Eye Hospital at a room temperature (RT) ranging from 22–26°C with 12-hour light/12-hour dark illumination and a relative humidity ranging from 40–70%. Adequate water and food were provided. All experimental procedures conformed to the Guide for the Care and Use of Laboratory Animals published by the US National Institutes of Health and were approved by the Laboratory Animal Care and Use Committee of Tianjin Medical University (permission number: SYXK2018-0004).
Establishment of a Rat Model of T2DM
The rats were randomly divided into a T2DM group and a normal group (NOR group). The T2DM group was fed a 60% fat-supplemented high-fat diet (HFD; DIO Rodent Purified Diet w/60% Energy Form Fat, Huafukang Biotech, Beijing, China; Cat# D12492; Lot# 20231008), whereas the NOR group was fed normal chow. When the food intake and water consumption of the animals were monitored, the rats were individually housed and were originally provided 80 g of HFD or normal chow and 400 mL of water, both of which are sufficient for the daily consumption of a normal or diabetic adult SD male rat according to prior studies.22,28 The remaining food and water were recorded and replenished to the original amount at 9 am the next day. The body weights of the animals were monitored on a weekly basis.
After 6 weeks of HFD consumption, an oral glucose tolerance test (OGTT) was performed on the 2 groups of rats as previously described.29 Before the OGTT, all the rats were fasted for 14 h to generate a synchronous physiological state. The fasting blood glucose levels were measured, after which the rats were orally administered 50% glucose solution (2 g/kg; China Otsuka Pharmaceuticals, Tianjin, China; Cat# 3231401H7023; Lot# 22J00J5). Gavage was carried out by the same experienced experimenter with a 1-min interval between the animals, and the exact time of gavage completion for each rat was recorded. Blood glucose levels were promptly measured at 15, 30, 60, 120, and 180 min after gavage, minimizing the variability caused by differences in gavage time. The blood glucose levels of the 2 groups of rats were plotted as a function of time after oral glucose administration, and the area under the curve (AUC) of the plot was calculated.
After being confirmed to have impaired glucose tolerance, an indicator of insulin resistance, the T2DM group rats were IP injected with a single small dose of STZ (Sigma‒Aldrich, St. Louis, MO, USA; Cat# S0130; Lot# WXBD6414V; 30 mg/kg, prepared as a 2% solution with 0.01 mol/L sodium citrate buffer, pH=4.5) as described in the literature to induce T2DM,30,31 whereas the NOR group rats were IP injected with sodium citrate solution (Solarbio, Beijing, China; Cat# C1013; Lot# 20221114). Seventy-two hours after the injection, the levels of blood glucose were measured via an UltraEasy blood glucose meter (LifeScan Inc., Milpitas, CA, USA). The blood glucose levels of all the T2DM group rats were greater than 16.7 mmol/L, indicating successful establishment of a rat model of T2DM. The T2DM group was fed a HFD, and the NOR group was fed normal chow for another 6 w, after which their blood glucose levels were measured again. Rats with blood glucose levels higher than 16.7 mmol/L in the T2DM group were included in subsequent experiments. The rats in the NOR group served as normal controls.
Blood Biochemistry Tests
Approximately 1 mL of blood was collected through cardiac puncture from the 2 groups of rats (n = 7–12 rats/group) into disposable blood collection tubes with spray-coated K2 EDTA (Thermo Fisher Scientific, Waltham, MA, USA; Cat# 454023PK; Lot# 240503). The blood was centrifuged at 2000 × g for 10 min at 4°C, and the plasma was obtained by collecting the supernatant. The concentrations of free fatty acids (FFAs), triglycerides (TGs), and total cholesterol (TC) in the rat plasma were measured via an Amplex Red free fatty acid detection kit (Cat# S0215S, Lot# 041524240702), an Amplex Red triglyceride detection kit (Cat# S0219S, Lot# Z999240726), and an Amplex Red cholesterol and cholesterol ester detection kit (Cat# S0211S, Lot# 042424240717), respectively, according to the manufacturers’ protocols (Beyotime Biotech, Shanghai, China). Briefly, 50 μL of the rat plasma samples and the serially diluted standards were added to a 96-well plate with (for FFAs and TGs) or without incubation (for TC) with 2 μL of lipase at 37°C for 30 min. Then, 50 μL of measurement working solution consisting of Amplex Red, enzyme mix, enhancer, and assay buffer was added, and the reaction mixture was covered and incubated in the dark at 37°C for 30 min. The absorbance at 570 nm was measured with an Infinite 200 PRO Multimode Microplate Reader (Tecan Group Ltd., Männedorf, Switzerland). The concentrations of the measured lipids were determined from the corresponding standard curves.
Dark-Adapted Electroretinogram
The NOR group and T2DM group rats (n = 9 rats/group) were placed in a dark room overnight (14–16 hours) for dark adaptation. The next day, the rats were anesthetized via an IP injection of 1% sodium pentobarbital (50 mg/kg). Tropicamide compound (Xingqi Pharmaceuticals, Shenyang, China) was topically applied for pupil dilation, and Ofloxacin gel (Xingqi Pharmaceuticals, Shenyang, China) was used to moisten the ocular surface. Each rat was fixed in the prone position on an operating stage. The ground electrode was inserted 2–3 cm from the base of the rat’s tail, and the reference electrode was inserted between the rat’s ears. The needle electrode was positioned to gently touch the cornea. Three light stimulation intensities, including 1.3 (approximately 0.01 cd*s/m2), 3.4 (approximately 3.0 cd*s/m2), and 4.6 (approximately 30.0 cd*s/m2), were applied. Following stabilization of the baseline voltage (±10 mV), the full-field dark-adapted electroretinogram (ERG) of each eye was sequentially recorded with Ganzfeld ERGs (Phoenix Research Labs, Pleasanton, CA, USA) according to the manufacturer’s protocols. In accordance with the guidelines of the International Society for Clinical Electrophysiology of Vision32 and literature reports,33–35 the A-wave amplitude was measured from the average prestimulus baseline to the A-wave trough, and the B-wave amplitude was measured from the A-wave trough to the B-wave peak. The A-wave implicit time was measured from the flash light to the trough of the A-wave, and the B-wave implicit time was measured from the flash light to the peak of the B-wave.
Evans Blue Assay
At 12 w following the HDF program, an Evans blue assay was performed on the rats in the NOR and T2DM groups (n = 15–17 rats/group) as previously described.28 Evans blue dye (30 mg/mL, dissolved in sterile normal saline and filtered, Sigma‒Aldrich, St. Louis, MO, USA; Cat# E2129; Lot# 1003669269) was injected at 45 mg/kg through the tail vein. After the dye circulated for 2 h, 5 rats from each group were euthanized via IP injection of an excessive dose of sodium pentobarbital (100 mg/kg), and the retinas of the right eyeballs were isolated and prepared as whole mounts to examine the morphology and leakage of retinal vessels under a fluorescence microscope (BX51, Olympus Optical Co. Ltd., Tokyo, Japan) via a Texas Red filter. On the other hand, blood samples (1 mL) were collected from the angular veins of the remaining animals (10–12 rats/group) and stored at 4°C in heparin-coated tubes; these rats were then perfused thoroughly via the left ventricle with prewarmed sodium citrate buffer (pH 3.5; Sigma‒Aldrich, St. Louis, MO, USA; Cat# S0130; Lot# WXBD6414V) to avoid vessel constriction, and the retinas of the right eyeballs were isolated and stored at -80°C.
The blood sample was centrifuged at 12,000 rpm at RT for 20 min. The plasma in the upper layer was collected and diluted 100-fold with formamide (Biotopped Technology Co., Ltd., Beijing, China; Cat# Top0876; CAS# 75–12-7). The Evans blue dye was dissolved in formamide (Biotopped Technology Co., Ltd., Beijing, China; Cat# Top0876; CAS# 75–12-7) at the following concentrations: 50,000, 25,000, 10,000, 5,000, 1,000, 500, 250, 125, and 0 ng/mL to generate a standard curve, which served as both positive and negative controls. Then, 60 μL of diluted blood samples and standard curve solutions were added to a 96-well plate. The absorbance (emission at 620 nm; correction at 740 nm) was measured with an Infinite 200 PRO Multimode Microplate Reader (Tecan Group Ltd., Männedorf, Switzerland). The blood concentration of Evans blue dye was calculated according to a standard curve. The collected retinas were incubated in an oven at 37°C for 5 h, and the retina dry weight was recorded. The retinas were subsequently incubated at 70°C for 18 h in 150 μL formamide. The retinal sample extracts were loaded into EMD Millipore Amicon Ultra0.5 Centrifugal Filter Units (NMWL 30,000, Fisher Scientific, Pittsburgh, PA, USA) and centrifuged at 3000 × g and 4°C for 90 min. Molecules with a molecular weight lower than 30 kDa were enriched in the filtrates. The concentration of Evans blue dye in the filtrate was calculated according to the standard curve. The Evans blue permeability in retinal samples was calculated as follows: Permeability [μL/(g•h)] = [Evans blue content in retina (μg)/retina dry weight (g)]/[time-averaged Evans blue concentration in blood (μg/μL) × circulating time (h)].
Retinal Sample Collection
At 12 w following the HDF program, the rats were deeply anesthetized via an IP injection of an excessive dose of sodium pentobarbital (100 mg/kg). Only the right eyeballs were collected. Some of the collected eyeballs were placed in fixative for paraffin sectioning (n = 11 eyeballs/group); the others were placed in a culture dish containing phosphate-buffered saline (PBS; Solarbio, Beijing, China; Cat# P1010; Lot# 20230911), and the retinas were rapidly dissected, snap frozen in liquid nitrogen, and stored at -80°C for proteomic analysis (n = 3 retinas/group) and Western blot validation (n = 6–8 retinas/group).
Paraffin Sections and Hematoxylin and Eosin Staining
The NOR group and T2DM group eyeballs (n = 11/group) were fixed in acidic fixative for 24 h, followed by dehydration, transparency, wax immersion, and paraffin embedding. Two continuous sections were obtained from each eyeball at approximately 10 μm above the optic nerve (5 μm/section). Hematoxylin and eosin (H&E) staining was performed after dewaxing and hydration. Following dehydration and mounting with VectaMount (Vector Laboratories, Inc., Burlingame, CA, USA; Cat# H-1200; Lot# Z1007), the stained sections were observed under an optical microscope and imaged via CellSens Standard software (Olympus Optical Co., Ltd., Tokyo, Japan). In a specific layer of the retina on the image (n = 15 images/group), 3 positions (left 1/3, middle, right 1/3) were selected, the thickness at each position was measured by the software, and the average thickness of the 3 positions was calculated to represent the thickness of the retinal layer on the image.
Proteomics
Three retinas from both groups were randomly selected for TMT proteomics analysis by Guangzhou Huijun Biotechnology Co., Ltd. (Guangzhou, China). Specifically, total proteins were extracted from retinal samples via lysis buffer L3 (210 g of urea, 76 g of thiourea, and 1.2 g of Tris dissolved in 500 mL of water, pH 8.4; Item#: FP1801; prepared by Guangzhou Huijun Biotechnology Co., Ltd., Guangzhou, China) and ultrasonic treatment, and the extracted proteins were purified via acetone precipitation. Next, the protein content of each sample was determined via the Bradford staining method, and the proteins were subjected to filter-aided sample preparation to break disulfide bonds and block cysteine residues. After further trypsinization, the obtained high-quality peptide fragments were multiplex labeled with a TMT assay kit (Thermo Fisher Scientific, Waltham, MA, USA; Cat# A44522; Lot# XL348283). The labeled peptides were vacuum concentrated, freeze dried, and separated via two-dimensional liquid chromatography. First-dimensional high-pH reverse-phase liquid chromatography separated the processed peptides into multiple components, and second-dimensional reverse-phase liquid chromatography followed by mass spectrometry further analyzed the peptide fragments in each component and conducted online detection via an Orbitrap Fusion Lumos Tribrid mass spectrometer (Thermo Fisher Scientific, Waltham, MA, USA; Cat# IQLAAEGAAPFADBMBHQ).
Bioinformatics Analysis
The files of the proteomics data were downloaded. Basic analyses, such as the distribution of protein relative molecular weights and protein isoelectric points, were performed. Due to the limited sample size (n = 3) of the proteomic data, nonparametric bootstrapping (1000 iterations) was performed in Python (v3.7.1) to estimate the sampling distribution of the mean protein expression differences between the 2 experimental groups (Supplementary Table 1). Differentially expressed proteins (DEPs) were identified on the basis of the criteria of protein expression level fold change (fold change ≥ 1.2 or fold change ≤ 0.83) and a statistically significant difference (P < 0.05) between the 2 experimental groups (Supplementary Tables 2 and 3). The DEPs were subsequently subjected to Gene Ontology (GO) functional enrichment analysis, Kyoto Encyclopedia of Genes and Genomes (KEGG) pathway enrichment analysis, and STRING protein‒protein interaction (PPI) network analysis.
Measurement of Total Protein Concentration
The total protein concentration was measured via a BCA protein quantification kit (KWBIO, Beijing, China; Cat# CW0014S; Lot# 33423). Neutral radioimmunoprecipitation assay (RIPA) buffer (KWBIO, Beijing, China; Cat# CW2334S; Lot# 01406/19022) was used to dilute 2 μg/μL bovine serum albumin, generating serially diluted standards as positive controls. Neutral RIPA buffer alone was used as a negative control. The extracted protein samples were diluted 5-fold with neutral RIPA buffer. Then, 25 μL of the standards or the diluted protein samples were added to a 96-well plate, and 200 μL of the reaction buffer, consisting of liquids A and B at a volume ratio of 50:1, was added to each well. The plate was covered and incubated at 37°C for 30 min. The absorbance at 562 nm was measured with an Infinite 200 PRO Multimode Microplate Reader (Tecan Group Ltd., Männedorf, Switzerland). A standard curve was plotted, on the basis of which the protein concentration (μg/μL) in each sample was calculated.
Western Blotting
Western blotting (WB) was used to validate the protein expression levels of FABP3, TINAGL1, COL4A3, and SNRPD1 and to examine the protein expression of large fragments of activated caspase-3 in rat retinas. In brief, total proteins from each retina were resolved on a sodium dodecyl sulfate polyacrylamide gel of the appropriate concentration (Supplementary Table 4) made with a PAGE gel fast preparation kit (Epizyme Biotech, Shanghai, China; Cat# PG111; Lot# 03811300) and then transferred to a PVDF Western blotting membrane (Sigma‒Aldrich, St. Louis, MO, USA; Cat# 03010040001; Lot# 69290400) at a constant voltage of 100 V for 100 min. The blots were washed, blocked with 5% nonfat dry milk, and incubated overnight with the corresponding primary antibodies (Supplementary Table 5) at 4°C. The next day, the blots were washed and incubated at RT for 2 h with appropriate horseradish peroxidase-conjugated secondary antibodies (Supplementary Table 5). The protein signals were visualized with an Omni ECL basic chemiluminescence detection kit (Epizyme Biotech, Shanghai, China; Cat# SQ202; Lot# 03791350), imaged with a Hesper chemiluminescence imaging system (Monad Biotech, JiangSu, China), and quantified via ImageJ software (National Institute of Health, Bethesda, MD, USA).
Participants and Collection of Aqueous Humor
The participants in this study were recruited from patients admitted to the Department of Fundus and Ocular Trauma at Tianjin Medical University Eye Hospital. The aqueous humor samples used in this study were collected from patients who had age-related cataract (ARC) and underwent cataract surgery between July 2023 and May 2024. The patients were diagnosed with ARC according to international standards.36 The diagnosis of NPDR was based on published guidelines.20 Specifically, all the recruited cataract patients were subjected to pupil dilation and fundus examination at the first visit to evaluate the DR stage. During the fundus examination, the same experienced ophthalmologist identified fundi with typical NPDR characteristics, such as microaneurysm, small bleeding, exudation, and cotton wool spots. Moreover, ultrawide-field fundus imaging and optical coherence tomography examinations were employed to verify the initial diagnosis of NPDR. Additionally, optical coherence tomography angiography was performed on patients with high suspicion of NPDR following cataract surgery to reveal disrupted macular structures and abnormal retinal capillary blood flow, corroborating the NPDR diagnosis. On the basis of these criteria, 15 patients with ARC and 15 patients with both ARC and NPDR were recruited. Written informed consent was obtained from these participants prior to inclusion in the study.
Under sterile conditions, the same experienced ophthalmologist performed the anterior chamber puncture procedure. The aqueous humor of each patient (100–200 μL) was slowly withdrawn into a disposable 1-mL syringe. The aqueous humor sample was then immediately transferred into a 1.5-mL sterile microcentrifuge tube labeled with retrievable patient information. The microcentrifuge tube was snap frozen in liquid nitrogen and stored at -80°C for future use. All procedures of sample collection were approved by the Ethics Committee and the Institutional Review Committee of Tianjin Medical University Eye Hospital and were in accordance with the tenets of the Declaration of Helsinki.
Slot Blotting
A nitrocellulose membrane (0.2 μm, Bio-Rad Laboratories, Hercules, CA, USA; Cat# 1620112) and 3 pieces of filter paper (11.3 × 7.7 cm2, Bio-Rad Laboratories, Hercules, CA, USA; Cat# 1620161) were assembled into a Bio-Dot SF Microfiltration System (Bio-Rad Laboratories, Hercules, CA, USA). One hundred microliters of Tris-buffered saline (TBS, pH 7.5; Solarbio, Beijing, China; Cat# T1080; Lot# 2306001) was added to each well to rinse the nitrocellulose membrane. The TBS was drawn through the membrane by a diaphragm vacuum pump (Tianjin Jinteng Experiment Equipment Co., Ltd., Tianjin, China). The aqueous humor samples were diluted to 0.5 μg/μL with neutral RIPA buffer (CWBIO, Beijing, China; Cat# CW2334S; Lot# 01406/19,022), and 200 μL of each diluted sample was added to each well. Vacuum pressure was applied to draw the samples through the membrane. Afterwards, 200 μL of TBS was used to wash the membrane twice to prevent nonspecific binding. The nitrocellulose membrane was disassembled and stained with Ponceau S (Solarbio, Beijing, China; Cat# P0012; Lot# 20231202) at RT for 20 min. The stained membrane was photographed as the loading control. The membrane was washed with PBS and dried at 37°C for 30 min. The remaining procedures, including blockade, probing, visualization, and imaging, were performed as described for Western blotting.
Statistical Analysis
This study used GraphPad Prism 10.1.2 (GraphPad Software, San Diego, CA, USA) and IBM SPSS 26.0 (IBM, Armonk, NY, USA) for statistical analysis. For proteomics data, due to the limited sample size (n = 3), nonparametric bootstrapping (1000 iterations) was conducted in Python (v3.7.1) to estimate the sampling distribution of mean protein expression differences between the NOR and DR groups (codes available in Supplementary Table 1). The other data were examined for normality via the Shapiro‒Wilk test complemented with Q‒Q plots (Supplementary Figures 1‒9): the data that conformed to a normal distribution are expressed as the mean ± standard error of the mean (mean ± SEM); those that did not conform to a normal distribution are expressed as the median (interquartile range). To account for within-subject correlation, the electrophysiological data with a normal distribution were examined by generalized linear mixed models, and those with a nonnormal distribution were examined by generalized estimating equations (Supplementary Figures 1‒6). Furthermore, all the data except the proteomics and electrophysiological data were then examined via the Levene test for homogeneity of variance; the data with a normal distribution and homogeneity of variance were examined via the independent t test to compare the differences between the 2 experimental groups; and the data with a nonnormal distribution were examined via the Mann‒Whitney U-test to compare the differences between the 2 experimental groups. P < 0.05 was considered statistically significant.
Results
Characterization of the HFD-Induced T2DM Rat Model
Physiological Parameters
A rat model of T2DM was established by a 6-w HFD program to induce impaired glucose tolerance and insulin resistance, followed by an IP injection of low-dose STZ to induce high glucose levels (> 16.7 mmol/L), eventually by another 6-w HFD program to maintain hyperglycemic and diabetic conditions; the rats fed a normal chow diet served as normal controls (Figure 1A). After the initial 6 w of HFD or normal chow, the 2 groups of rats were subjected to the OGTT. The results revealed that the blood glucose levels of both groups of rats peaked 15 min after the gavage of exogenous glucose and declined gradually thereafter (Figure 1B). The blood glucose levels of the T2DM group at 15 and 30 min after gavage were significantly elevated, being 19.34% and 21.14% higher than those of the normal control group, respectively (Figure 1B; both P < 0.01, NOR 15 min vs T2DM 15 min, NOR 30 min vs T2DM 30 min). The blood glucose levels of the T2DM group at the other time points tended to increase compared with those of their normal counterparts (Figure 1B; all P > 0.05, NOR 60 min vs T2DM 60 min, NOR 120 min vs T2DM 120 min, NOR 180 min vs T2DM 180 min). Overall, the curve of the T2DM group’s blood glucose levels presented a more rapid increase but a more gradual decrease than the normal values did (Figure 1B), with the AUC of the T2DM group being significantly greater than that of the NOR group (Figure 1C; P < 0.01, NOR vs T2DM). These results suggest that the animals in the T2DM group developed impaired glucose tolerance and insulin resistance, which is a known pathogenic factor of T2DM37 and serves as a prerequisite for subsequent small-dose IP injection of STZ.30
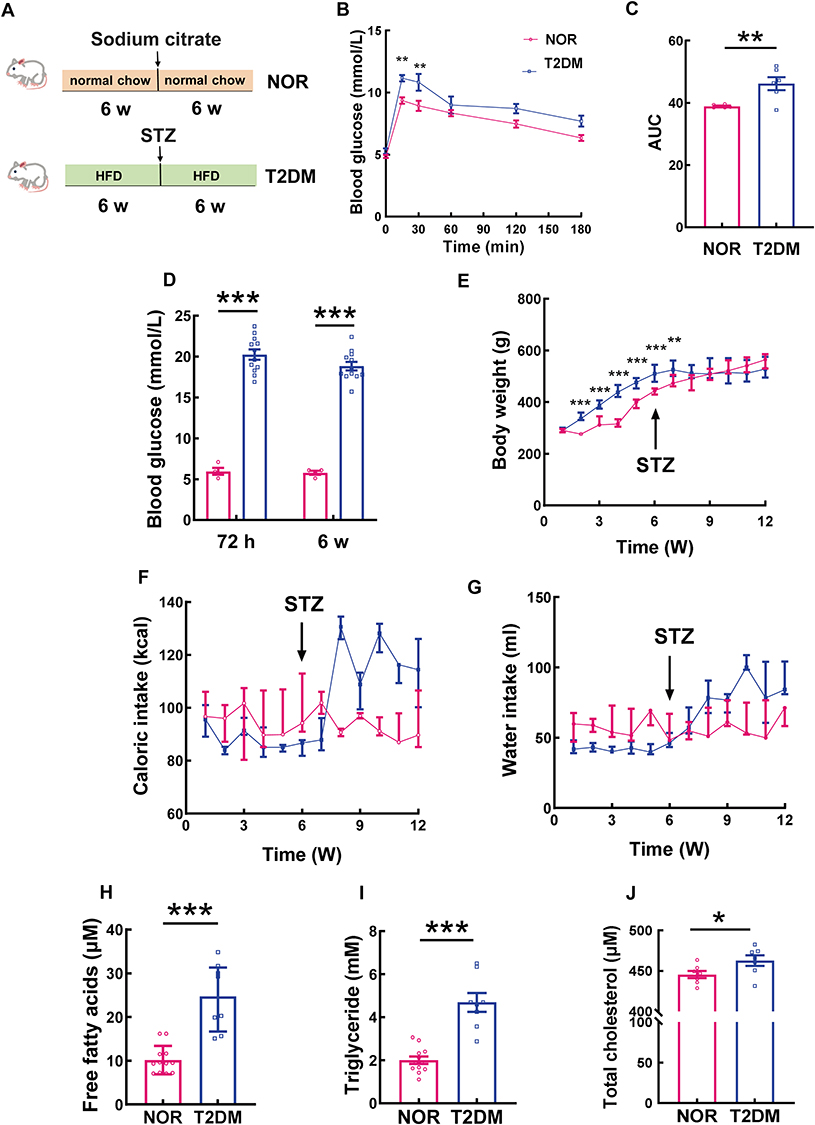 |
Figure 1 Physiological parameters of the HFD-induced T2DM rat model. (A) Schematic representation of the experimental procedure. (B) At 6 w post-HFD, an OGTT was conducted on the rats in the NOR and T2DM groups. The curves of blood glucose levels at different time points after oral administration of glucose are shown, and the AUCs of both groups are compared in (C), n = 6 rats/group; the data are presented as the mean ± SEM. (D) Blood glucose levels of the rats in the NOR and T2DM groups at 72 h and 6 w post-STZ induction, n = 12 rats/group; the data are presented as the mean ± SEM. (E) Dynamic changes in the body weights of the rats in the NOR and T2DM groups, NOR: n =10 rats/group; T2DM: n =14 rats/group; the data are presented as the median (interquartile range). (F) and (G) Caloric intake and water consumption of the rats in the NOR and T2DM groups, NOR: n =9 rats/group; T2DM: n =14 rats/group; the data are presented as the median (interquartile range). The concentrations of free fatty acids (H); NOR: n = 12 rats/group; T2DM: n = 8 rats/group; data are presented as the median (interquartile range)), triglycerides (I); n =12 rats/group; T2DM: n = 8 rats/group; data are presented as the mean ± SEM), and total cholesterol (J); NOR: n = 7 rats/group; T2DM: n = 7 rats/group; data are presented as the mean ± SEM) in the plasma of the rats in the NOR and T2DM groups were measured. *P < 0.05; **P < 0.01; ***P < 0.001. Abbreviation: HFD, high-fat diet; OGTT: oral glucose tolerance test; STZ, streptozotocin; AUC, area under the curve. |
Seventy-two hours following low-dose STZ (30 mg/kg) IP injection, the blood glucose levels of the T2DM group rats were all above 16.7 mmol/L; thus, these rats were considered diabetic. The average blood glucose level of the T2DM rats reached 20.24 ± 2.18 mmol/L, whereas that of the NOR group was 5.63 ± 0.67 mmol/L (Figure 1D; P < 0.001 for 72 h, NOR vs T2DM). The T2DM rats were fed a HFD for another 6 w, and elevated blood glucose levels were maintained throughout the experiment (Figure 1D; P < 0.001 for 6 w, NOR vs T2DM).
At 1 w after HFD feeding, there was no difference in body weight between the 2 groups (Figure 1E; P > 0.05 for 1 w, NOR vs T2DM). From 2 w to 6 w following HFD feeding, the body weight of the T2DM group at each time point was significantly greater than that of the NOR group (Figure 1E; all P < 0.001 for 2, 3, 4, 5, and 6 w, NOR vs T2DM), indicating HFD-induced obesity. However, after low-dose STZ IP injection, the increasing trend in body weight in the T2DM group was considerably thwarted except at the 7th week of HFD feeding (Figure 1E; P < 0.01 for 7 w, NOR vs T2DM). In contrast, the body weight of the NOR group fluctuated during the initial 3 w of normal chow, after which it almost linearly increased until the end of the experiment (Figure 1E). From 8 w to 12 w of HFD, no difference in body weight was found between the NOR and T2DM groups (Figure 1E; P > 0.05 for 8, 9, 10, 11, and 12 w, NOR vs T2DM).
The caloric and water intake of the NOR group only modestly changed throughout the experiment (Figure 1F and G). After STZ injection, the caloric and water intake of T2DM rats increased (Figure 1F and G), which are typical features of T2DM and are consistent with elevated blood glucose levels (Figure 1D). Notably, the caloric intake of the T2DM group at 2 w post-STZ injection was 1.51-fold greater than that prior to the injection (Figure 1F; P < 0.001, T2DM 8 w vs T2DM 6 w) and was maintained at high levels until the end of the experiment (Figure 1F). Similarly, the water consumption of the T2DM rats significantly increased at 1 w following STZ injection (Figure 1G; P < 0.05, T2DM 7 w vs T2DM 6 w) and remained high thereafter (Figure 1G).
Biochemical examination of blood lipid levels
The rats were fed a HFD for 12 w, and the lipid concentrations in their blood were measured. As expected, the blood concentrations of FFAs and TGs in the T2DM group were 2.42- and 2.35-fold greater than those in the NOR group, respectively (Figure 1H and I; both P < 0.001, NOR vs T2DM). Moreover, the TC concentration in the T2DM rats was significantly greater than that in the normal controls (Figure 1J, P < 0.05, NOR vs T2DM). These results demonstrate the profound dysregulation of lipid metabolism in the rat model of T2DM.
Electrophysiological Functions
Dark-adapted ERG was performed on the T2DM group and NOR group rats at 12 w after HFD feeding. The results revealed that under light stimulus intensities of 0.01 cd.s/m2 and 3.0 cd.s/m2, the A-wave amplitudes in the T2DM group were significantly lower than those in the NOR group, being 65.18% and 72.23% of the normal values, respectively (Figure 2A-C, H-J; Table 1; both P < 0.05 for dark-adapted 0.01 cd.s/m2 and dark-adapted 3.0 cd.s/m2, NOR vs T2DM). No significant difference between the 2 groups was detected in the A-wave amplitudes under a light stimulus intensity of 30.0 cd. s/m2 (Figure 2O-Q; Table 1). On the other hand, the A-wave implicit time under all light stimulus intensities was significantly greater in the T2DM group than in the normal control group (Figure 2D, K, and R; Table 1; P < 0.05 for dark-adapted 0.01 cd.s/m2, both P < 0.001 for dark-adapted 3.0 cd.s/m2 and 30.0 cd.s/m2, NOR vs T2DM). These results implicate the blunted sensitivity and attenuated response of retinal photoreceptors to light stimuli in the HFD-induced rat model of T2DM.
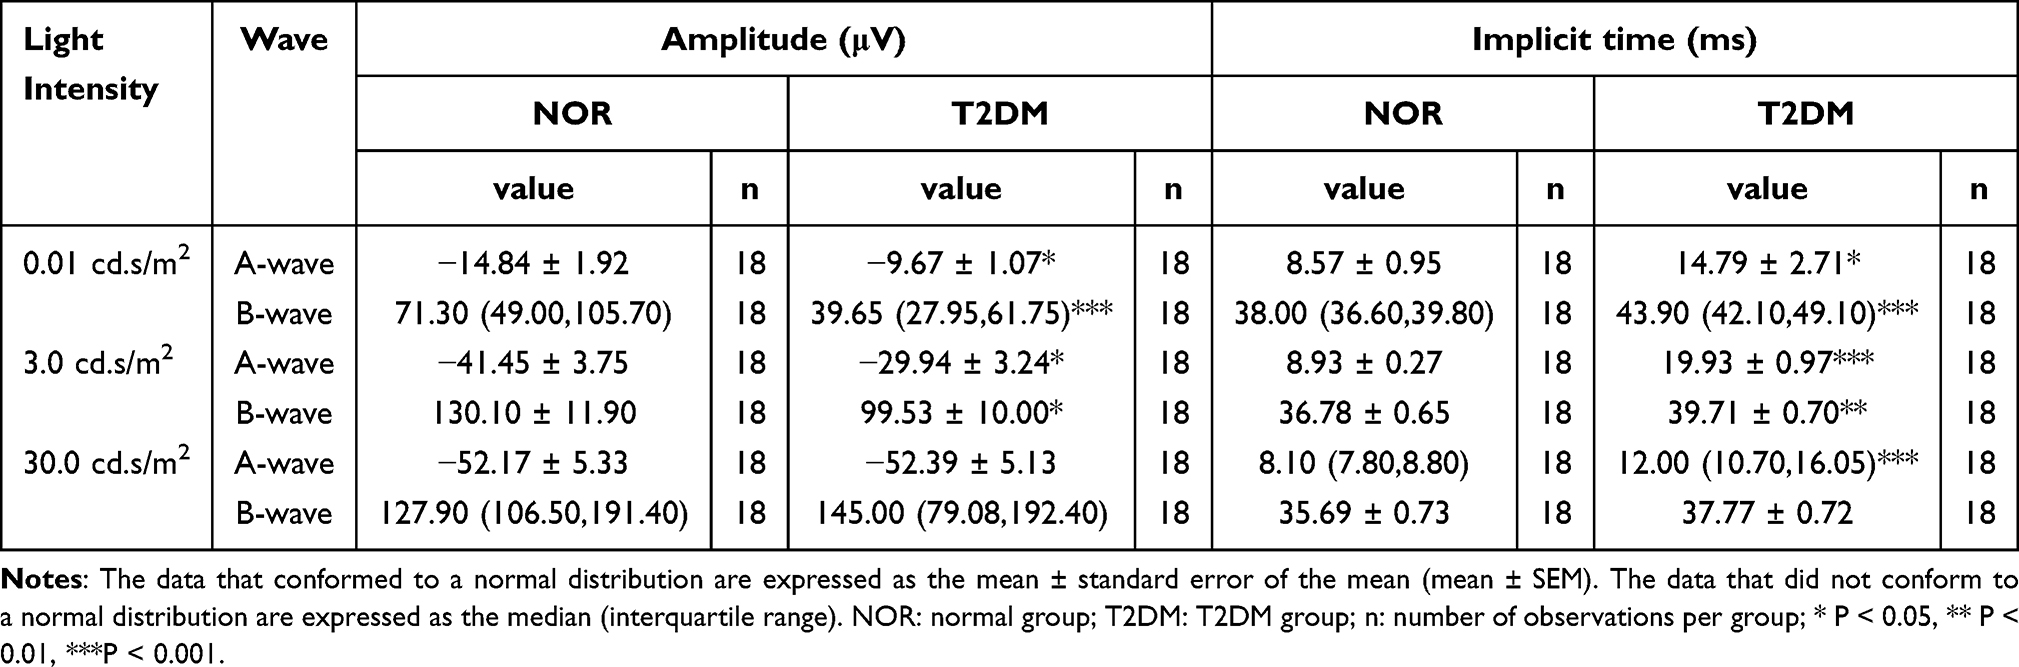 |
Table 1 Amplitudes and Implicit Times of the A-Wave and B-Wave |
 |
Figure 2 Electrophysiological functions of the rat model of HFD-induced T2DM. The data in this figure are presented as mean ± SEM unless otherwise stated. Under a light stimulus intensity of 0.01 cd.s/m², representative traces of dark-adapted ERGs from the NOR group and T2DM group are shown in (A) and (B), respectively; the A-wave amplitude (C), A-wave implicit time (D), B-wave amplitude (E), data are presented as the median (interquartile range)), B-wave implicit time (F), data are presented as the median (interquartile range)), and sOP amplitude (G), data are presented as the median (interquartile range)) were quantified and compared. Under a light stimulus intensity of 3.0 cd.s/m², representative traces of dark-adapted ERGs from the NOR group and T2DM group are shown in (H) and (I), respectively; the A-wave amplitude (J), A-wave implicit time (K), B-wave amplitude (L), B-wave implicit time (M), and sOP amplitude (N) were quantified and compared. Under a light stimulus intensity of 30.0 cd.s/m², representative traces of dark-adapted ERGs from the NOR group and T2DM group are shown in (O) and (P), respectively; the A-wave amplitude (Q), A-wave implicit time (R), data are presented as the median (interquartile range)), B-wave amplitude (S), data are presented as the median (interquartile range)), B-wave implicit time (T), and sOP amplitude (U) were quantified and compared. n = 18 eyes/group (sequential recording of both eyes in each rat). *P < 0.05; **P < 0.01; ***P < 0.001. Abbreviation: ERG, electroretinogram; sOP amplitude, summed oscillatory potential amplitude. |
Moreover, the low-intensity light stimuli (0.01 cd.s/m2 and 3.0 cd.s/m2) elicited significantly smaller B-wave amplitudes in the T2DM group than in the NOR group (Figure 2A, B, E, H, I, and L; Table 1; P < 0.001 for dark-adapted 0.01 cd.s/m2, P < 0.05 for dark-adapted 3.0 cd.s/m2, NOR vs T2DM), whereas the high-intensity light stimulus (30.0 cd.s/m2) did not (Figure 2O, P, and S; Table 1; P > 0.05 for dark-adapted 30.0 cd.s/m2, NOR vs T2DM). Similarly, significantly longer B-wave implicit time in the T2DM rats was observed under the 2 low-intensity light stimuli (Figure 2A, B, F, H, I, and M; Table 1; P < 0.001 for dark-adapted 0.01 cd.s/m2, P < 0.01 for dark-adapted 3.0 cd.s/m2, NOR vs T2DM) but not under the high-intensity light stimulus (Figure 2O, P, and T; Table 1; P > 0.05 for dark-adapted 30.0 cd.s/m2, NOR vs T2DM). The results of the B-wave metrics may indicate retinal bipolar cell defects in this rat model of T2DM. Alternatively, defects in A-wave metrics may also contribute to B-wave abnormalities in diabetic retinas.
In addition, oscillatory potentials (OPs), including OP1, OP2, OP3, and OP4, were recorded, and the trends of individual OP amplitudes and implicit times were similar to those of B-waves (Supplementary Table 6). The amplitudes of the 4 OPs were summed, and the summed OP (sOP) amplitudes of T2DM rat retinas were significantly lower than those of normal retinas under all light stimulus intensities (Figure 2A, B, G, H, I, N, O, P, and U; P < 0.001 for dark-adapted 0.01 cd.s/m2; P < 0.05 for dark-adapted 3.0 and 30.0 cd.s/m2, NOR vs T2DM). The OP has been shown to be a sensitive proxy of early neural and microvascular changes under clinical diabetic conditions;38–40 thus, these results might suggest abnormalities in amacrine cells and retinal ganglion cells involved in light signal transmission and damage to the retinal circulation in this rat model of HFD-induced T2DM.
Pathological Lesions in the Retina
H&E staining revealed that the boundaries of each layer were clear and that the cells were neatly arranged in both groups of retinas (Figure 3A). Compared with that in the NOR group, the total retina thickness in the T2DM group was significantly lower (Figure 3B; P < 0.001 for total retina, NOR test vs T2DM test). Furthermore, detailed analyses revealed that the thicknesses of the outer segment (OS), inner segment (IS), outer nuclear layer (ONL), outer plexiform layer (OPL), inner nuclear layer (INL), and inner plexiform layer (IPL) of the T2DM retinas were significantly lower than those of the normal retinas (Figure 3B; P < 0.05 for OPL and INL; P < 0.01 for IS and IPL; P < 0.001 for OS and ONL, NOR vs T2DM).
 |
Figure 3 Pathological changes in a rat model of HFD-induced T2DM. (A) Representative images of H&E-stained retinas from the NOR and T2DM groups. Scale bar = 20 μm. (B) Quantitative analysis of the thickness of retinal layers; n = 15 images/group. Data are presented as the median (interquartile range). (C) Representative Western blot of cleaved caspase 3. (D) Quantitative analysis of cleaved caspase 3, NOR: n= 7 rats/group; T2DM: n= 8 rats/group; the data are presented as the mean ± SEM. (E) Representative images of retinal whole mounts from NOR and T2DM group rats, in which the fluorescence of Evans blue dye could be observed under a Texas red filter of a fluorescence microscope. Scale bar = 100 μm. (F) Evans blue dye permeability of retinas from NOR and T2DM group rats was quantified and compared, NOR: n = 12 rats/group; T2DM: n= 10 rats/group, data are presented as the median (interquartile range). *P < 0.05; **P < 0.01; ***P < 0.001. Abbreviation: H&E, hematoxylin and eosin; OS, outer segment; IS, inner segment; ONL, outer nuclear layer; OPL, outer plexiform layer; INL, inner nuclear layer; IPL, inner plexiform layer; GCL, ganglion cell layer. |
Cleaved caspase 3 is the executor of the apoptotic signal in the cell; hence, it has been considered a surrogate of the apoptotic activity in certain cell populations and tissues.41,42 WB revealed that the relative abundance of cleaved caspase 3 in diabetic retinas was 1.74-fold greater than that in normal retinas (Figure 3C and D; P < 0.01, NOR vs T2DM), suggesting increased apoptotic activity in the retinas of T2DM rats.
The vascular morphology and trajectory of retinal whole mounts can be viewed under the red filter of a fluorescence microscope because of the autofluorescence of Evans blue dye. The NOR group rat retinas exhibited an even distribution with smooth vessel walls, and no leakage of blue dye was observed (Figure 3E). In contrast, dye leakage was frequently observed around macro- and microvessels in the retinas of the T2DM group rats (Figure 3E). Consistently, the results of the Evan blue assay revealed that dye permeability in T2DM retinas was 2.52-fold greater than that in normal retinas (Figure 3F; P < 0.001, NOR vs T2DM), indicating breakdown of the blood‒retinal barrier and vascular leakage in the retinas of T2DM rats.
Proteomics
Identification of Differentially Expressed Proteins in T2DM Rat Retinas
According to the criteria for protein expression level (fold change ≥ 1.20 or fold change ≤ 0.83) and statistical significance (P < 0.05), the volcano plot revealed 80 differentially expressed proteins (DEPs) in the retinas of the T2DM group compared with those in the NOR group (Figure 4A). Among the DEPs, 55 were upregulated (fold change ≥ 1.20), and 25 were downregulated (fold change ≤ 0.83; Figure 4A). The top 9 upregulated DEPs included desmoglein 4 (DSG4), pyruvate dehydrogenase kinase 4 (PDK4), kininogen 2 (KNG2), fatty acid binding protein 3 (FABP3), collagen type III α1 chain (COL3A1), carboxylesterase 1C (CES1C), ubiquinol-cytochrome c reductase, complex III subunit X (UQCR10), tubulointerstitial nephritis antigen like 1 (TINAGL1), and collagen type IV α3 chain (COL4A3; Table 2). The top 9 downregulated DEPs included an unknown protein, retinol binding protein 4 (RBP4), alpha-2u globulin PGCL4 (OBP3), small nuclear ribonucleoprotein D1 polypeptide (SNRPD1), murinoglobulin-1 (MUG1), transthyretin (TTR), nebulin (NEB), plakophilin 1 (PKP1), and glutamic-pyruvic transaminase (GPT; Table 3). The hierarchical clustering results revealed differential expression profiles between the 2 groups (Figure 4B).
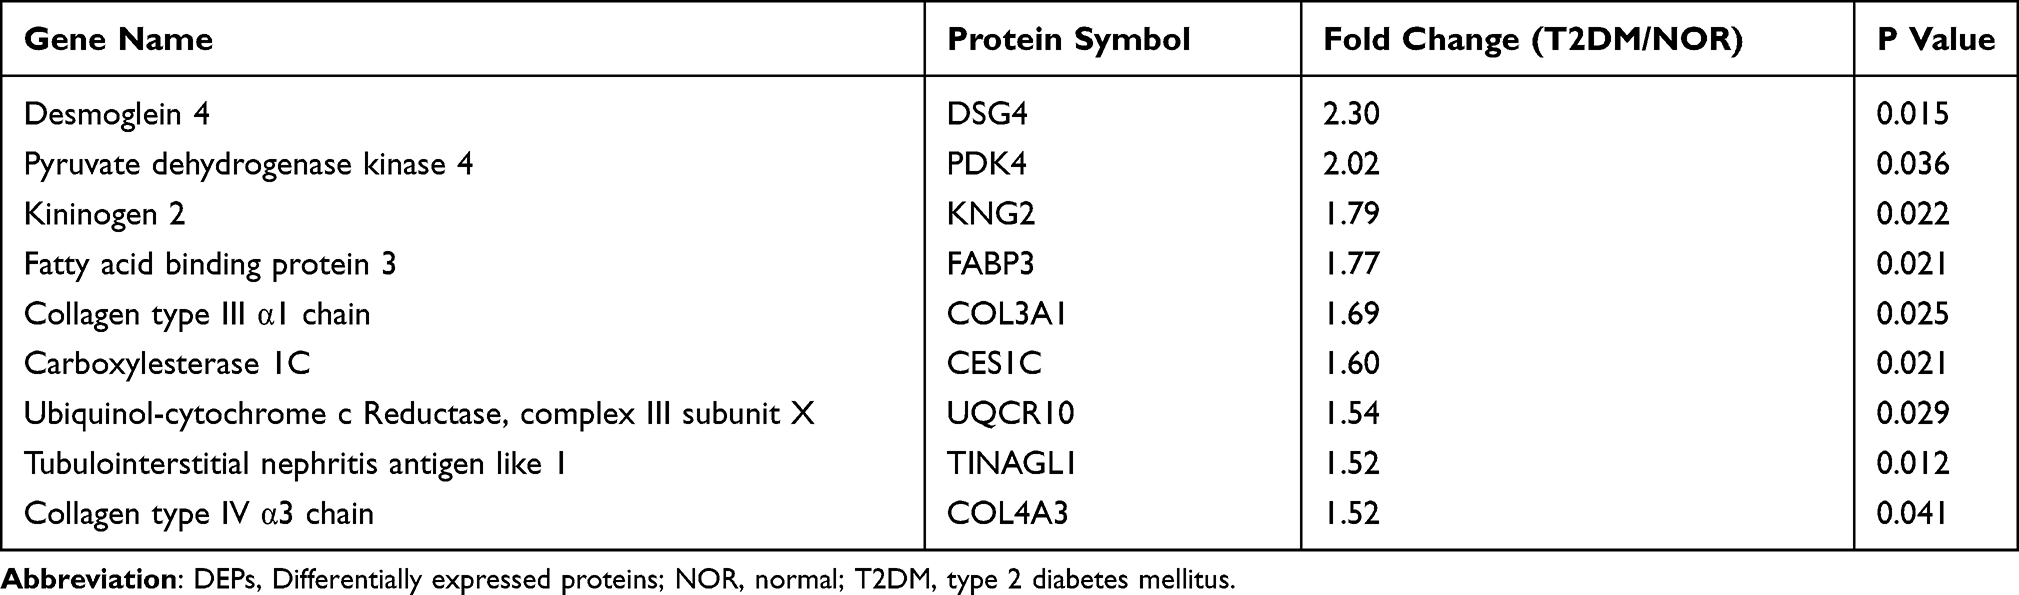 |
Table 2 The Top 9 Upregulated DEPs in the T2DM Group Vs NOR Group |
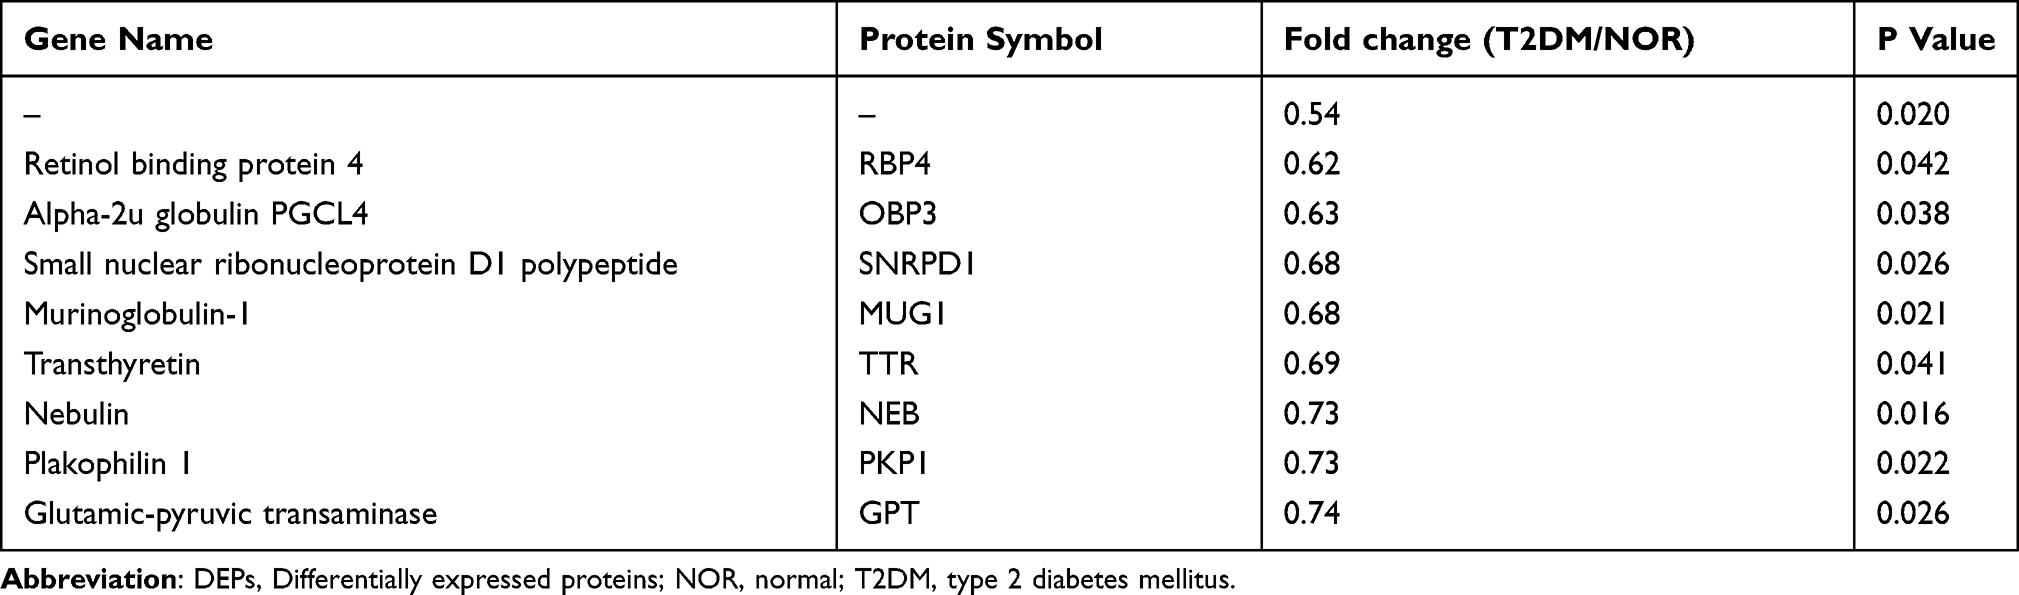 |
Table 3 The Top 9 Downregulated DEPs in the T2DM Group Vs NOR Group |
 |
Figure 4 Proteomic and bioinformatics analyses of retinas from the NOR and T2DM groups. (A) Volcano plot of DEPs in the retinas of the T2DM group relative to those of the NOR group. The horizontal axis represents the logarithm of the fold change with a base of 2, and the vertical axis represents the logarithm of the statistical P value with a base of 10. The red dots indicate upregulated proteins, the green dots indicate downregulated proteins, and the gray dots indicate proteins whose expression did not significantly differ. (B) Heatmap of the expression profile of DEPs between the NOR group and the T2DM group. Each horizontal row represents a protein, with its name on the right side. Each vertical row represents the protein expression profile of a retina sample. The fold change in protein expression (T2DM/NOR) is indicated by the color scale on the right. (C) GO analysis of DEPs. The horizontal axis represents different entries in BP, CC, and MF. The vertical axis indicates the number of DEPs in each entry. (D) KEGG pathway enrichment analysis of DEPs. The horizontal axis indicates the gene ratio, which represents the degree of enrichment of the DEPs in a specific pathway. The color scale on the right represents -log10 (P value); the redder the value is, the more significant the enrichment. (E) PPI network diagram, where nodes represent DEPs and lines represent connections between them. n = 3 rats/group. Abbreviation: DEPs, differentially expressed proteins; BP, biological process; CC, cellular component; MF, molecular function; Pro, protein; ECM, extracellular matrix; CP, catabolic process; HPV, human papillomavirus. |
GO Analysis
The results of the GO enrichment analysis of the DEPs in the T2DM and NOR groups are shown in Figure 4C. The biological processes enriched by the DEPs included small molecule catabolic processes, fatty acid metabolic processes, lipid oxidation, lipid modification, and lipid catabolic processes. The cellular components in which the DEPs were enriched included the extracellular matrix, collagen-containing extracellular matrix, collagen trimer, ribosomal subunit, and ribosome. The DEPs also participated in molecular functions, such as peptidase regulator activity, endopeptidase inhibitor activity, peptidase inhibitor activity, endopeptidase regulator activity, and enzyme inhibitor activity.
KEGG Analysis
KEGG pathway analysis was performed on the DEPs, and the top 10 pathways enriched by the DEPs were as follows: ECM receptor interaction, protein digestion and absorption, fatty acid elongation, fatty acid degradation, fatty acid metabolism, focal adhesion, the PI3K/Akt signaling pathway, human papillomavirus infection, diabetic cardiomyopathy, and the PPAR signaling pathway (Figure 4D).
PPI Analysis
The DEPs were uploaded to the STRING database for PPI analysis. The relationships between proteins were investigated from 8 aspects: chromosome proximity, gene fusion, coexistence of phylogenetic profiles, homology, coexpression, experimental data, database annotation, and literature mining. The analyzed PPI results were further processed via Cytoscape software, and the CytoHubba plugin was employed to calculate node scores. Then, on the basis of the maximal clique centrality algorithm, the 10 hub proteins, including histidine-rich glycoprotein (Hrg), serpin family a member 1 (Serpina1), GC vitamin D binding protein (Gc), fetuin b (Fetub), kininogen 1 (Kng1), orosomucoid 1 (Orm1), transthyretin (Ttr), hydroxyacyl-CoA dehydrogenase trifunctional multienzyme complex subunit alpha (Hadha), acyl-CoA dehydrogenase long chain (Acadl), and complement C3 (C3), were selected, and the interactive network of the hub proteins is shown in Figure 4E.
Validation of the Expression Patterns of Selected DEPs
On the basis of the proteomics results, 4 DEPs with remarkable fold changes and high statistical significance, namely, Col4a3, Tinagl1, Fabp3, and Snrpd1, were selected for WB validation. The WB results revealed that the protein expression of Col4a3, Tinagl1, and Fabp3 was significantly upregulated in the T2DM group, with the levels of these proteins in the diabetic retinas being 2.09-, 1.73-, and 1.33-fold greater than those in the normal retinas, respectively (Figure 5A‒D; both P < 0.01 for Col4a3 and Tinagl1, P < 0.05 for Fabp3, NOR vs T2DM), whereas the expression of Snrpd1 was significantly downregulated in the T2DM retinas, with the Snrpd1 protein level being 68.99% of that in the normal controls (Figure 5A and E, P < 0.05 for Snrpd1, NOR vs T2DM). The expression trends of the selected DEPs were consistent with those revealed by TMT proteomics (Tables 2 and 3).
 |
Figure 5 Validation of the expression patterns of selected targets by Western blotting and in patient aqueous humor by Slot blotting. (A) Representative Western blot images. Quantitative analyses of COL4A3 (B); n = 7 rats/group, data are presented as the mean ± SEM), TINAGL1 (C); n = 7 rats/group, data are presented as the mean ± SEM), FABP3 (D); n = 6 rats/group, data are presented as the median (interquartile range)), and SNRPD1 (E); n = 7 rats/group, data are presented as the median (interquartile range)) proteins in the retinas of NOR and T2DM group rats. Quantitative analyses of COL4A3 (F); n = 15 patients/group, data are presented as the mean ± SEM), TINAGL1 (G); n = 15 patients/group, data are presented as the median (interquartile range)), and FABP3 (H); n = 15 patients/group, data are presented as the median (interquartile range)) in the aqueous humor of patients with ARC only and patients with ARC and NPDR. * P < 0.05; **P < 0.01; ***P < 0.001. Abbreviation: ARC, age-related cataract; NPDR, nonproliferative diabetic retinopathy. |
Clinical Relevance of the Selected DEPs
Aqueous humor samples were collected from 15 patients with ARC and 15 patients with both ARC and NPDR. There were no significant differences in age (Table 4, ARC vs ARC+NPDR, P = 0.9038) or sex distribution (Table 4, ARC vs ARC+NPDR, P = 0.232) between the 2 groups of patients.
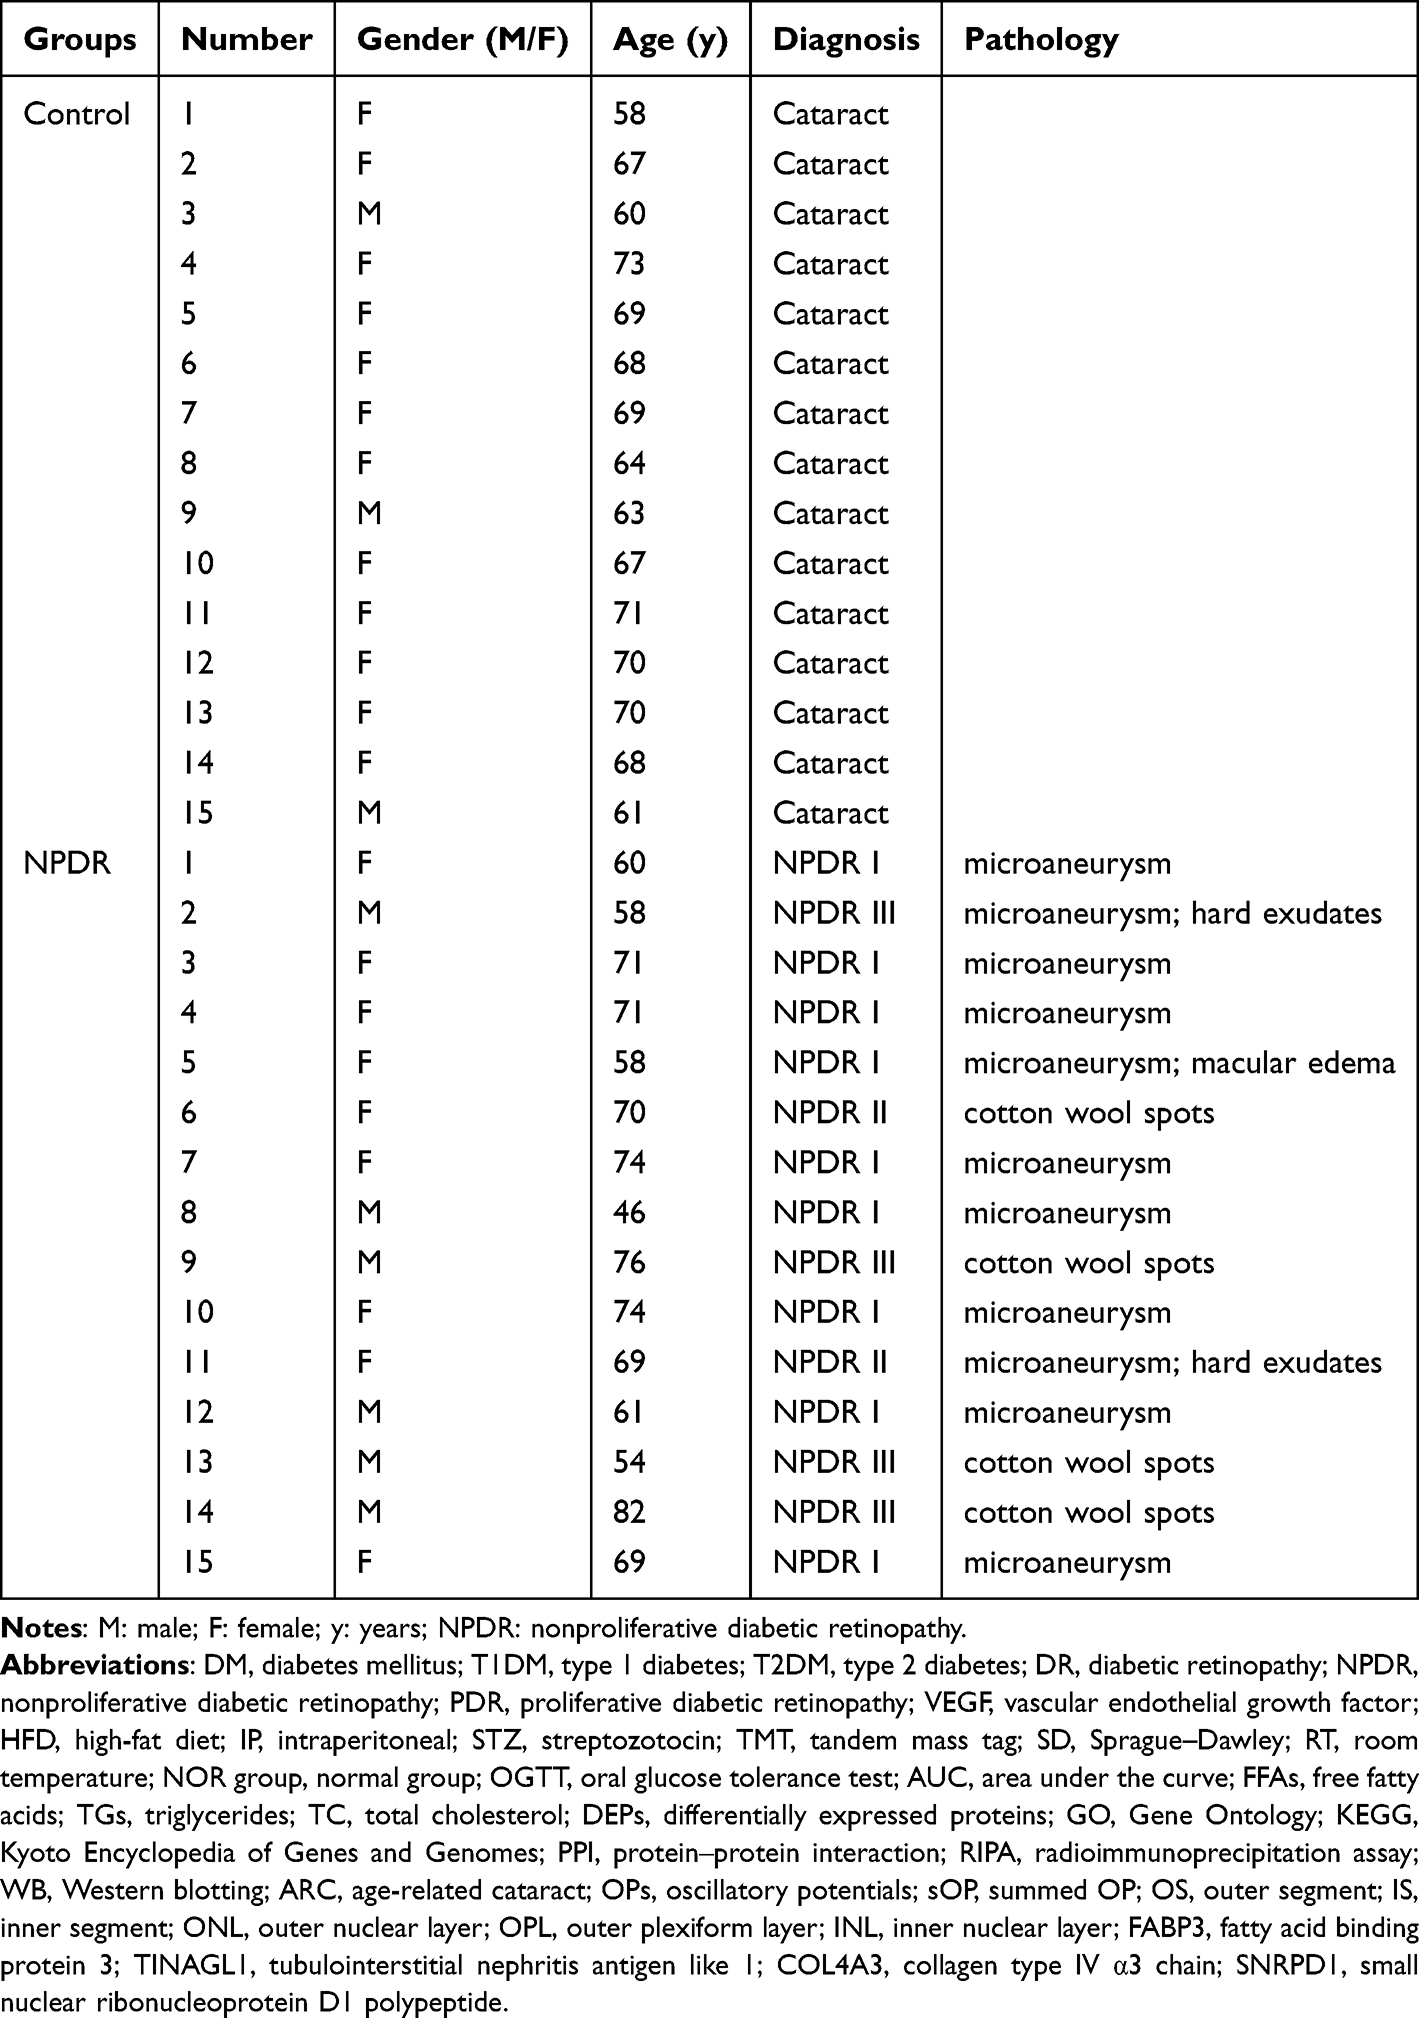 |
Table 4 Demographic Information of the Patients |
Owing to the limited amount (100–200 μL) of aqueous humor collected from each patient, the lack of ELISA kits for the selected protein targets, and the specificity of the antibodies that were tested via Western blotting, we examined the expression patterns of the selected protein targets in the aqueous humor of the 2 groups of patients via slot blotting (Supplementary Figure 10). The results revealed that the levels of the Col4a3, Tinagl1, and Fabp3 proteins in the aqueous humor of patients with both ARCs and NPDR were significantly elevated compared with those in patients with ARCs only (Figure 5F-H; both P < 0.05 for Col4a3 and Fabp3, P < 0.001 for Tinagl1, ARC vs ARC+NPDR). These results were consistent with those detected by proteomics and WB in the rats, supporting the clinical relevance of the findings in the rat model of HFD-induced T2DM.
Discussion
This study was prompted by the following situations of current DR research. First, an interventional modality targeting the NPDR stage would be preferable to prevent the disease from progressing to the intractable PDR stage. Moreover, a sufficient number of retinal and vitreous samples from NPDR patients are difficult to obtain for exploration of pathogenic mechanisms and identification of interventional targets. In addition, more than 90% of DR patients are afflicted by T2DM; however, the majority of DR studies have been conducted in animal models of T1DM. Therefore, an animal model of T2DM that conforms to the natural history and displays physiological, biochemical, and pathological features of NPDR is needed.
Indeed, a rat model of T2DM was established in this study by combining a 6-w HFD program with a single IP injection of low-dose STZ, simulating dysregulated lipid metabolism-induced insulin resistance and pancreatic β-cell destruction-elicited insulin deficiency, the 2 fundamental processes of T2DM occurrence and development.43 Following another 6-w HFD program, the rats presented typical phenotypes of T2DM, including sustained hyperglycemia, weight loss, hyperphagia, and polydipsia (Figure 1C-F).44,45 Notably, the significantly elevated levels of FFAs, TGs, and TC in the blood highlight the profound disturbance of lipid metabolism in this rat model (Figure 1G-I). Moreover, the rats also displayed dysfunctions and morphological damage in the retina, including compromised A-waves, B-waves, and OPs in dark-adapted ERGs, diminished thickness in the retinal layers, and increased apoptotic activity and vascular leakage (Figures 2 and 3), which are consistent with the clinical manifestations of NPDR.46 Furthermore, it has been reported that the rat model also exhibits vascular inflammation, oxidative stress, and mitochondrial dysfunction in the retina, phenotypes similar to NPDR in humans.47–49 Therefore, the results of this study and literature reports suggest that the rat model of HFD-induced T2DM could be used for exploring pathogenic mechanisms, identifying interventional targets, and evaluating drug efficacy for NPDR.
Following the proteomics analysis, screening of DEPs, validation by Western blotting, and examination of aqueous humor samples from NPDR patients, the levels of 3 proteins, FABP3, Col4a3, and Tinagl1, were significantly elevated throughout all the experiments in the diabetic samples compared with those in the control samples (Figure 4 and 5, Table 2, Supplementary Figure 10). FABP3, a key molecule that regulates long-chain fatty acid uptake, transport, and intracellular metabolism,50 has been shown to promote mitophagy through increased production of reactive oxygen species, resulting in mitochondrial stress, metabolic disturbance, and neuronal apoptosis in a murine model of cerebral ischemia‒reperfusion.51 Moreover, FABP3 has also been shown to contribute substantially to vascular endothelial cell dysfunctions, including reduced tubulogenesis, boosted migration, increased apoptosis, and inflammation, under stimulation with bacterial lipopolysaccharides.52 Therefore, it is plausible that this protein may damage retinal neurons and the microvasculature through intracellular events. The potential therapeutic value of FABP3 inhibitors in NPDR may be explored to provide valuable insights into the translational relevance of this protein target.
COL4A3, the α 3 subunit of collagen IV, functions as a major structural component of basement membranes such as the inner limiting membrane and Bruch’s membrane in the retina.53 On the one hand, the expression of the COL4A3 gene is upregulated under pathological conditions, such as in a mouse model of laser-induced retinal degeneration54 and in Müller cells cultured in a biomechanical environment mimicking proliferative vitreoretinopathy,55 and excessive production and deposition of collagen may lead to extracellular matrix remodeling and fibrosis in the neuroretina. On the other hand, collagen IV can stimulate an increase in microvascular length and stabilize neovessels in a concentration-dependent and domain-specific manner.56 These reports suggest that COL4A3 may act as a profibrotic and proangiogenic molecule that impairs the neuroretina and retinal vessels through extracellular events.
More interestingly, Tinagl1 is also designated lipocalin 7. Members of the lipocalin family regulate diverse cellular processes, such as lipid metabolism, insulin sensitivity, the inflammatory response, oxidative stress, and angiogenesis,57 which are reminiscent of the functions of FABP3. Moreover, Tinagl1 is a matricellular protein that is secreted into the extracellular environment and closely associates with and even modulates the production of extracellular matrix proteins, such as collagen.58 Additionally, TINAGL1 is highly similar in sequence to the tubulointerstitial nephritis antigen, thus being a key antigen for autoimmune disease of the renal tubular basement membrane.59 Specific antibody drugs, such as antibody‒drug conjugates, nanobodies, and antibody fusion proteins, may be developed for this purpose.60 Alternatively, small-molecule compounds may also be designed through molecular docking to bind to TINAGL1 with high affinity and inhibit its pathogenicity. Therefore, on the basis of the results of this study and the literature reports, we speculate that the 3 validated targets, FABP3, COL4A3, and Tinagl1, may cause neural and microvascular damage in the retina under NPDR conditions through either intracellular or extracellular events or both; the KEGG analysis results indicate that the PPAR and PI3K/Akt signaling pathways may be involved in mediating these events (Figure 4D).
Other research groups have also employed proteomics to search for potential therapeutic targets for DR. Zhang et al explored the proteomic characteristics of the aqueous humor in patients with diabetic macular edema (DME) and revealed that haptoglobin and fibrillin 1 might be crucial to DME pathogenesis and could serve as potential therapeutic targets for this complication of diabetes.61 Alli-Shaik et al compared the proteomic profiles of vitreous humor from patients with proliferative diabetic retinopathy (PDR) with those from patients with epiretinal membranes and proposed that ADAM10 may be a therapeutic target for PDR.62 However, these studies focused on the advanced stages of DR, where disease severity is aggravated and the risk of blindness is increased. In contrast, this study leveraged a different strategy by establishing a HFD/STZ-induced rat model of T2DM and collecting diabetic rat retinas for proteomic analysis at the stage corresponding to NPDR. This strategy enabled us to identify significantly upregulated proteins in diabetic retinas (Figure 4, Table 2), and the technical and clinical validations corroborated the reliability and clinical relevance of the findings (Figure 5). To the best of our knowledge, this is the first report on potential targets for NPDR intervention in a rat model of HFD/STZ-induced T2DM.
However, there are several limitations in this study. First, whether the HFD/STZ-induced rat model of T2DM can exhibit phenotypes of advanced stages of NPDR, such as hard exudates and bleeding in the retinal vasculature, after a long-term HFD program has yet to be determined. Moreover, there is currently no unified standard for the duration of the HFD program and the dosage of STZ injection.45 Finally, this study identified 3 potential interventional targets in the NPDR stage via proteomic analysis and technical and clinical validation but did not conduct an in-depth mechanistic exploration of these targets. Future research is warranted to pinpoint which one is the predominant target for NPDR intervention and to elucidate the pathogenic mechanism underlying the target.
Conclusion
Proteomics involves an unbiased examination of the type and expression levels of proteins, the end products of gene expression and the direct executers of biological activities.63 In the context of diabetes, the abundance and activities of gene expression products in the eye are regulated by perplexing environmental factors and genetic susceptibility; therefore, proteomics is more suitable for identifying major pathogenic factors and providing effective targets for ocular diseases.
In this study, a rat model of HFD/STZ-induced T2DM that was consistent with the natural history of NPDR and exhibited systemic abnormalities hallmarked by dysregulated lipid and glucose metabolism as well as retinal pathological features of NPDR was established. Proteomic analysis, Western blotting validation, and clinical sample examination revealed significantly elevated levels of the Fabp3, Tinagl1, and Col4a3 proteins in T2DM rats and NPDR patients, indicating their involvement in NPDR pathogenesis and potential as targets for NPDR intervention.
Data Sharing Statement
The mass spectrometry proteomics data have been deposited to the ProteomeXchange Consortium via the PRIDE partner repository with the dataset identifier PXD056236. The data will be accessible to readers once the manuscript is published. For peer review purposes, the data can be accessed via a reviewer account with the username [email protected] and the password XkbSM1GUqVT1. The other data analyzed in this study can be available upon reasonable request to the corresponding author.
Author Contributions
All authors made a significant contribution to the work reported, whether that is in the conception, study design, execution, acquisition of data, analysis and interpretation, or in all these areas; took part in drafting, revising or critically reviewing the article; gave final approval of the version to be published; have agreed on the journal to which the article has been submitted; and agree to be accountable for all aspects of the work.
Funding
This work was supported by the Tianjin Health Research Project (Grant No. TJWJ2024RC006), the Tianjin Medical University Eye Hospital High-level Innovative Talent Program (YDYYRCXM-B2023-01), and the Tianjin Key Medical Discipline (Specialty) Construction Project (TJYXZDXK-037A).
Disclosure
The authors report no conflicts of interest in this work.
References
1. Tan TE, Wong TY. Diabetic retinopathy: looking forward to 2030. Front Endocrinol (Lausanne). 2022;13:1077669. doi:10.3389/fendo.2022.1077669
2. Sinclair A, Saeedi P, Kaundal A, et al. Diabetes and global ageing among 65-99-year-old adults: findings from the International Diabetes Federation Diabetes Atlas, 9(th) edition. Diabetes Res Clin Pract. 2020;162:108078. doi:10.1016/j.diabres.2020.108078
3. Yang Y, Luan Y, Feng Q, et al. Epigenetics and beyond: targeting histone methylation to treat type 2 diabetes mellitus. Front Pharmacol. 2021;12:807413. doi:10.3389/fphar.2021.807413
4. Kropp M, Golubnitschaja O, Mazurakova A, et al. Diabetic retinopathy as the leading cause of blindness and early predictor of cascading complications-risks and mitigation. EPMA J. 2023;14(1):21–42. doi:10.1007/s13167-023-00314-8
5. Mrugacz M, Bryl A, Zorena K. Retinal vascular endothelial cell dysfunction and neuroretinal degeneration in diabetic patients. J Clin Med. 2021;10(3):458. doi:10.3390/jcm10030458
6. Singh R, Farooq SA, Mannan A, et al. Animal models of diabetic microvascular complications: relevance to clinical features. Biomed Pharmacother. 2022;145:112305. doi:10.1016/j.biopha.2021.112305
7. Gao L, Zhao W, Yang JK, et al. Proliferative diabetic retinopathy in patients with type 2 diabetes correlates with the presence of atherosclerosis cardiovascular disease. Diabetol Metab Syndr. 2021;13(1):48. doi:10.1186/s13098-021-00666-z
8. Arrigo A, Aragona E, Bandello F. VEGF-targeting drugs for the treatment of retinal neovascularization in diabetic retinopathy. Ann Med. 2022;54(1):1089–1111. doi:10.1080/07853890.2022.2064541
9. Chatziralli I, Loewenstein A. Intravitreal anti-vascular endothelial growth factor agents for the treatment of diabetic retinopathy: a review of the literature. Pharmaceutics. 2021;13(8):1137. doi:10.3390/pharmaceutics13081137
10. Gomułka K, Ruta M. The role of inflammation and therapeutic concepts in diabetic retinopathy-a short review. Int J mol Sci. 2023;24(2):1024. doi:10.3390/ijms24021024
11. Ahmad A, Nawaz MI. Molecular mechanism of VEGF and its role in pathological angiogenesis. J Cell Biochem. 2022;123(12):1938–1965. doi:10.1002/jcb.30344
12. Callan A, Jha S, Valdez L, et al. Cellular and molecular mechanisms of neuronal degeneration in early-stage diabetic retinopathy. Curr. Vasc. Pharmacol. 2024;22(5):301–315. doi:10.2174/0115701611272737240426050930
13. Le YZ. VEGF production and signaling in Müller glia are critical to modulating vascular function and neuronal integrity in diabetic retinopathy and hypoxic retinal vascular diseases. Vision Res. 2017;139:108–114. doi:10.1016/j.visres.2017.05.005
14. Dorweiler TF, Singh A, Ganju A, et al. Diabetic retinopathy is a ceramidopathy reversible by anti-ceramide immunotherapy. Cell Metab. 2024;36(7):1521–1533.e5. doi:10.1016/j.cmet.2024.04.013
15. Duh EJ, Sun JK, Stitt AW. Diabetic retinopathy: current understanding, mechanisms, and treatment strategies. JCI Insight. 2017;2:e93751.
16. Cai S, Yang Q, Cao Y, et al. PF4 antagonizes retinal neovascularization via inhibiting PRAS40 phosphorylation in a mouse model of oxygen-induced retinopathy. Biochim Biophys Acta Mol Basis Dis. 2020;1866(3):165604. doi:10.1016/j.bbadis.2019.165604
17. Fu P, Huang Y, Wan X, et al. Efficacy and safety of pan retinal photocoagulation combined with intravitreal anti-VEGF agents for high-risk proliferative diabetic retinopathy: a systematic review and meta-analysis. Medicine. 2023;102(e34856):e34856. doi:10.1097/MD.0000000000034856
18. Arabi A, Tadayoni R, Ahmadieh H, et al. Update on management of non-proliferative diabetic retinopathy without diabetic macular edema; is there a paradigm shift? J Ophthalmic Vis Res. 2022;17(1):108–117. doi:10.18502/jovr.v17i1.10175
19. Royle P, Mistry H, Auguste P, et al. Pan-retinal photocoagulation and other forms of laser treatment and drug therapies for non-proliferative diabetic retinopathy: systematic review and economic evaluation. Health Tech Assessment. 2015;19(51):
20. Yonekawa Y, Modi YS, Kim LA, et al. American society of retina specialists clinical practice guidelines on the management of nonproliferative and proliferative diabetic retinopathy without diabetic macular edema. J VitreoRet Diseases. 2020;4(2):125–135. doi:10.1177/2474126419893829
21. Liang W, Huang L, Whelchel A, et al. Peroxisome proliferator-activated receptor-α (PPARα) regulates wound healing and mitochondrial metabolism in the cornea. Proc Natl Acad Sci U S A. 2023;120:e2217576120.
22. Zhang L, Dong L, Liu X, et al. α-Melanocyte-stimulating hormone protects retinal vascular endothelial cells from oxidative stress and apoptosis in a rat model of diabetes. PLoS One. 2014;9(4):e93433. doi:10.1371/journal.pone.0093433
23. Eleazu CO, Eleazu KC, Chukwuma S, et al. Review of the mechanism of cell death resulting from streptozotocin challenge in experimental animals, its practical use and potential risk to humans. J Diabetes Metab Disord. 2013;12(1):60. doi:10.1186/2251-6581-12-60
24. Reed J, Bain S, Kanamarlapudi V. A review of current trends with type 2 diabetes epidemiology, aetiology, pathogenesis, treatments and future perspectives. Diabetes, Metabolic Syndrome and Obesity: Targets and Therapy. 2021;14:3567–3602. doi:10.2147/DMSO.S319895
25. Wang B, Chandrasekera PC, Pippin JJ. Leptin- and leptin receptor-deficient rodent models: relevance for human type 2 diabetes. Current Diabetes Rev. 2014;10(2):131–145. doi:10.2174/1573399810666140508121012
26. Xiang X, Han M, Luo X, et al. Development of a behavior change intervention to improve physical activity in patients with COPD using the behavior change wheel: a non-randomized trial. Sci Rep. 2023;13(1):22929. doi:10.1038/s41598-023-50099-z
27. Caulfield C, Wu D, Miller IS, et al. BF(2)-azadipyrromethene fluorophores for intraoperative vital structure identification. Molecules. 2023;28(5):2167. doi:10.3390/molecules28052167
28. Cai S, Yang Q, Hou M, et al. Α-melanocyte-stimulating hormone protects early diabetic retina from blood-retinal barrier breakdown and vascular leakage via MC4R. Cell Physiol Biochem. 2018;45(2):505–522. doi:10.1159/000487029
29. Kwon S, Kim YJ, Kim MK. Effect of fructose or sucrose feeding with different levels on oral glucose tolerance test in normal and type 2 diabetic rats. Nutr Res Pract. 2008;2(4):252–258. doi:10.4162/nrp.2008.2.4.252
30. Huang H, Luo L, Liu Z, et al. Role of TNF-α and FGF-2 in the fracture healing disorder of type 2 diabetes model induced by high fat diet followed by streptozotocin. Diabetes, Metabolic Syndrome and Obesity: Targets and Therapy. 2020;13:2279–2288. doi:10.2147/DMSO.S231735
31. Wang L, Wang Z, Yu Y, et al. Metabolomics analysis of stool in rats with type 2 diabetes mellitus after single-anastomosis duodenal-ileal bypass with sleeve gastrectomy. Front Endocrinol (Lausanne). 2022;13:1013959. doi:10.3389/fendo.2022.1013959
32. Robson AG, Frishman LJ, Grigg J, et al. ISCEV Standard for full-field clinical electroretinography (2022 update). Documenta Ophthalmol Adv Ophthalmol. 2022;144(3):165–177. doi:10.1007/s10633-022-09872-0
33. Motz CT, Chesler KC, Allen RS, et al. Novel detection and restorative levodopa treatment for preclinical diabetic retinopathy. Diabetes. 2020;69(7):1518–1527. doi:10.2337/db19-0869
34. Ou J, Vijayasarathy C, Ziccardi L, et al. Synaptic pathology and therapeutic repair in adult retinoschisis mouse by AAV-RS1 transfer. J Clin Invest. 2015;125(7):2891–2903. doi:10.1172/JCI81380
35. Friedel EBN, Tebartz van Elst L, Beringer M, et al. Reduced contrast sensitivity, pattern electroretinogram ratio, and diminished a-wave amplitude in patients with major depressive disorder. Eur Archiv Psychiatr Clin Neurosci. 2024. doi:10.1007/s00406-024-01826-8
36. Gali HE, Sella R, Afshari NA. Cataract grading systems: a review of past and present. Curr Opin Ophthalmol. 2019;30(1):13–18. doi:10.1097/ICU.0000000000000542
37. Le TN, Bright R, Truong VK, et al. Key biomarkers in type 2 diabetes patients: a systematic review. Diabetes Obesity Metab. 2025;27(1):7–22. doi:10.1111/dom.15991
38. Luu CD, Szental JA, Lee SY, et al. Correlation between retinal oscillatory potentials and retinal vascular caliber in type 2 diabetes. Invest Ophthalmol Vis Sci. 2010;51(1):482–486. doi:10.1167/iovs.09-4069
39. Midena E, Torresin T, Longhin E, et al. Early microvascular and oscillatory potentials changes in human diabetic retina: amacrine cells and the intraretinal neurovascular crosstalk. J Clin Med. 2021;10(18):4035. doi:10.3390/jcm10184035
40. Wachtmeister L. Oscillatory potentials in the retina: what do they reveal. Prog Retin Eye Res. 1998;17(4):485–521. doi:10.1016/S1350-9462(98)00006-8
41. Ma G, Pang X, Ran Y, et al. In silico and in vivo verification of the mechanism of formononetin in treating hepatocellular carcinoma. Ann Med. 2024;56(1):2404550. doi:10.1080/07853890.2024.2404550
42. Zhuge Y, Li G, Sun M, et al. Reactive oxygen species responsive double-locked liposome collaborative photodynamic therapy for reducing electrical conduction recurrence after radiofrequency catheter ablation. Int J Pharm X. 2024;8:100275. doi:10.1016/j.ijpx.2024.100275
43. Akter B, Uddin MS, Islam MR, et al. Computational drug design approaches for the identification of novel antidiabetic compounds from natural resources through molecular docking, ADMET, and toxicological studies. Cell Biochem Biophys. 2025;83(1):1057–1070. doi:10.1007/s12013-024-01540-1
44. Guo XX, Wang Y, Wang K, et al. Stability of a type 2 diabetes rat model induced by high-fat diet feeding with low-dose streptozotocin injection. J Zhejiang Univ Sci B. 2018;19(7):559–569. doi:10.1631/jzus.B1700254
45. Liu S, Ma L, Ren X, et al. A new mouse model of type 2 diabetes mellitus established through combination of high-fat diet, streptozotocin and glucocorticoid. Life Sci. 2021;286:120062. doi:10.1016/j.lfs.2021.120062
46. Sivaprasad S, Sen S, Cunha-Vaz J. Perspectives of diabetic retinopathy-challenges and opportunities. Eye (London, England). 2023;37(11):2183–2191. doi:10.1038/s41433-022-02335-5
47. Wang H, Su X, Zhang QQ, et al. MicroRNA-93-5p participates in type 2 diabetic retinopathy through targeting Sirt1. Intl Ophthalmol. 2021;41(11):3837–3848. doi:10.1007/s10792-021-01953-4
48. Wang P, Chen F, Zhang X. Cyclosporine-a attenuates retinal inflammation by inhibiting HMGB-1 formation in rats with type 2 diabetes mellitus. BMC Pharmacol Toxicol. 2020;21(1):9. doi:10.1186/s40360-020-0387-6
49. Kowluru RA. Retinopathy in a diet-induced type 2 diabetic rat model and role of epigenetic modifications. Diabetes. 2020;69(4):689–698. doi:10.2337/db19-1009
50. Guo Q, Kawahata I, Cheng A, et al. Fatty acid-binding proteins 3 and 5 are involved in the initiation of mitochondrial damage in ischemic neurons. Redox Biol. 2023;59:102547. doi:10.1016/j.redox.2022.102547
51. Zhong FF, Wei B, Bao GX, et al. FABP3 induces mitochondrial autophagy to promote neuronal cell apoptosis in brain ischemia-reperfusion injury. Neurotox Res. 2024;42(4):35. doi:10.1007/s12640-024-00712-4
52. Nguyen HC, Bu S, Nikfarjam S, et al. Loss of fatty acid binding protein 3 ameliorates lipopolysaccharide-induced inflammation and endothelial dysfunction. J Biol Chem. 2023;299(3):102921. doi:10.1016/j.jbc.2023.102921
53. Wang Y, Zhu R, Zhao L, et al. Characterization of ocular morphology in Col4a3-/- mice as a murine model for Alport Syndrome. Transl Vis Sci Technol. 2024;13(7):16. doi:10.1167/tvst.13.7.16
54. Jahnke L, Perrenoud V, Zandi S, et al. Modulation of extracellular matrix composition and chronic inflammation with pirfenidone promotes scar reduction in retinal wound repair. Cells. 2024;13(2):164. doi:10.3390/cells13020164
55. Davis JT, Wen Q, Janmey PA, et al. Müller cell expression of genes implicated in proliferative vitreoretinopathy is influenced by substrate elastic modulus. Invest Ophthalmol Vis Sci. 2012;53(6):3014–3019. doi:10.1167/iovs.11-8450
56. Minor AJ, Coulombe KLK. Engineering a collagen matrix for cell-instructive regenerative angiogenesis. J Biomed Mater Res Part B. 2020;108(6):2407–2416. doi:10.1002/jbm.b.34573
57. Yang HH, Wang X, Li S, et al. Lipocalin family proteins and their diverse roles in cardiovascular disease. Pharmacol Ther. 2023;244:108385. doi:10.1016/j.pharmthera.2023.108385
58. Bornstein P. Matricellular proteins: an overview. J Cell Commun Signal. 2009;3(3–4):163–165. doi:10.1007/s12079-009-0069-z
59. Adeva-Andany MM, Carneiro-Freire N. Biochemical composition of the glomerular extracellular matrix in patients with diabetic kidney disease. World J Diabet. 2022;13(7):498–520. doi:10.4239/wjd.v13.i7.498
60. Carter PJ, Rajpal A. Designing antibodies as therapeutics. Cell. 2022;185(15):2789–2805. doi:10.1016/j.cell.2022.05.029
61. Zhang Y, Xu M, He H, et al. Proteomic analysis of aqueous humor reveals novel regulators of diabetic macular edema. Exp Eye Res. 2024;239:109724. doi:10.1016/j.exer.2023.109724
62. Alli-Shaik A, Qiu B, Lai SL, et al. System-wide vitreous proteome dissection reveals impaired sheddase activity in diabetic retinopathy. Theranostics. 2022;12(15):6682–6704. doi:10.7150/thno.72947
63. Müller JB, Geyer PE, Colaço AR, et al. The proteome landscape of the kingdoms of life. Nature. 2020;582(7813):592–596. doi:10.1038/s41586-020-2402-x
 © 2025 The Author(s). This work is published and licensed by Dove Medical Press Limited. The
full terms of this license are available at https://www.dovepress.com/terms.php
and incorporate the Creative Commons Attribution
- Non Commercial (unported, 4.0) License.
By accessing the work you hereby accept the Terms. Non-commercial uses of the work are permitted
without any further permission from Dove Medical Press Limited, provided the work is properly
attributed. For permission for commercial use of this work, please see paragraphs 4.2 and 5 of our Terms.
© 2025 The Author(s). This work is published and licensed by Dove Medical Press Limited. The
full terms of this license are available at https://www.dovepress.com/terms.php
and incorporate the Creative Commons Attribution
- Non Commercial (unported, 4.0) License.
By accessing the work you hereby accept the Terms. Non-commercial uses of the work are permitted
without any further permission from Dove Medical Press Limited, provided the work is properly
attributed. For permission for commercial use of this work, please see paragraphs 4.2 and 5 of our Terms.