")
Back to Journals » Pharmacogenomics and Personalized Medicine » Volume 18
Quercetin Inhibits Gastric Cancer Progression via FAM198B/MAPK Pathway Modulation
Authors Deng H, Xiao Q, Xu X, Zhang L, Zhang Y
Received 3 January 2025
Accepted for publication 7 May 2025
Published 15 May 2025 Volume 2025:18 Pages 115—141
DOI https://doi.org/10.2147/PGPM.S511324
Checked for plagiarism Yes
Review by Single anonymous peer review
Peer reviewer comments 2
Editor who approved publication: Dr Martin H Bluth
Hongyang Deng,1 Qi Xiao,1 Xiaodong Xu,1 Lingyi Zhang,2 Youcheng Zhang1
1Department of General Surgery, Hepatic-Biliary-Pancreatic Institute, The Second Hospital & Clinical Medical School, Lanzhou University, Lanzhou, Gansu, People’s Republic of China; 2Department of Liver Disease, The Second Hospital & Clinical Medical School, Lanzhou University, Lanzhou, Gansu, People’s Republic of China
Correspondence: Youcheng Zhang, Department of General Surgery, Hepatic-biliary-pancreatic Institute, The Second Hospital & Clinical Medical School, Lanzhou University, Lanzhou, Gansu, People’s Republic of China, Email [email protected]
Background: The family with the sequence similarity 198 member B (FAM198B) has been found to contribute to the progression of gastric cancer (GC). However, the role and molecular mechanism of FAM198B in GC remains poorly understood. This work found a link between FAM198B and quercetin, and the regulatory effect of FAM198B on the MAPK pathway of GC.
Methods: FAM198B expression was identified through multiple public data sets and verified in clinical tissue samples. The associations between FAM198B and the prognosis of patients with GC were analyzed via the Kaplan‒Meier plotter and Cox regression analysis. Gene set enrichment analysis, coexpressed genes, and RNA sequencing were used to explore the related functions and signaling pathways of FAM198B in GC. In vitro assays assessed the effects of FAM198B knockdown on GC cells. FAM198B was found as a quercetin target by the HERB database and in vitro assays.
Results: FAM198B was highly expressed in tissues from GC patients (p< 0.001) and was positively associated with poor prognosis (p< 0.001) and immune cell infiltration in GC patients. FAM198B knockdown inhibited the proliferation, migration, invasion, and epithelial-mesenchymal transition (EMT) of GC cells (all p< 0.05). In addition, FAM198B knockdown decreased the phosphorylation of p-Erk1/2 and p-p38 in GC cells (all p< 0.01). Quercetin inhibited FAM198B expression and the phosphorylation of p-Erk1/2 and p-p38 in GC cells (all p< 0.05).
Conclusion: Quercetin inhibits the proliferation, migration, invasion, and EMT of GC cells by inhibiting the FAM198B/MAPK signaling pathway. These discoveries lay the groundwork for developing the treatment of GC by quercetin and targeting FAM198B. In the future, more preclinical and clinical studies are needed to confirm the efficacy and safety of quercetin and target FAM198B in GC.
Keywords: FAM198B, quercetin, MAPK signaling pathway, EMT, proliferation, migration, invasion, gastric cancer
Introduction
Gastric cancer (GC) is the fifth most common malignancy in the world and the fifth leading cause of cancer-related death.1 The early symptoms of GC are not obvious, leading to many patients with GC having already entered the advanced stage at the time of diagnosis, for which standard treatments are largely unsatisfactory.2 Therefore, there is an urgent need to explore the molecular mechanisms of GC progression and to find novel molecular markers for the early diagnosis and targeted therapy of GC.
The family with sequence similarity 198 member B (FAM198B) (Ensembl ID: ENSG00000164125), also known as Golgi-associated kinase 1B (GASK1B), is located on chromosome 4. The coding sequence of the FAM198B gene contains seven exons, and the molecular weight of the FAM198B-encoded protein is 57.552 kDa. Several pieces of evidence3–6 have emphasized the link between FAM198B and cancers. FAM198B can inhibit the phosphorylation of Erk in lung adenocarcinoma3 and ovarian cancer,4 showing a tumor suppressor function. However, two reports on colorectal cancer5 and GC6 revealed evidence that FAM198B may act as an oncogene in gastrointestinal tumors. Chen et al6 initially found that FAM198B regulated the PI3K/AKT/Bcl-2 signaling pathway to promote the progression of GC. However, the function and molecular mechanism of FAM198B in GC need to be further explored, which may provide a more profound comprehension of GC’s occurrence, development, and treatment.
Quercetin (C15H10O7) is a flavonoid in various foods, including grapes, Onions, and tomatoes.7 It is known for its anti-inflammatory, antioxidant, and antiviral properties, making it useful in managing cardiovascular diseases, inflammatory diseases, and cancer.7 Several reports8–10 have shown that quercetin can inhibit GC growth by inhibiting MAPK and AKT/mTOR signaling. However, the specific molecular mechanisms of quercetin regulating MAPK pathway in GC are complex and unclear. Exploring these molecular mechanisms may provide new ideas for treating GC.
This study found that FAM198B was abnormally high in GC tissues. Its expression may be associated with the prognosis and immune cell infiltration of patients with GC via bioinformatic analysis. Next, we verified the function of FAM198B in the progression of GC in vitro. We subsequently used RNA sequencing (RNA-seq) to explore how FAM198B affects GC cells. Furthermore, we found that FAM198B, a quercetin target, mediated the inhibitory effect of quercetin on the progression of GC. Overall, this study provided evidence for the anti-GC potential of quercetin and targeting FAM198B, which may be potential strategies for preventing or treating GC.
Materials and Methods
Analysis of FAM198B Expression in Pan-Cancer
The expression of FAM198B in Pan-cancer was identified through the Tumor IMmune Estimation Resource (TIMER) database11,12 (https://cistrome.shinyapps.io/timer/). The TIMER database uses the Wilcoxon test to compare gene expression levels in cancer and adjacent tissues. Additionally, the Gene Expression Profiling Interactive Analysis (GEPIA)13 (http://gepia.cancer-pku.cn/detail.php) database was used to investigate the difference in FAM198B expression between cancer and normal tissues.
FAM198B Expression Analyses in GC
The gene expression profiles of the TCGA-STAD and Genotype-Tissue Expression (GTEx) data sets (https://www.gtexportal.org/home/index.html), as well as the clinical information of patients with GC, were obtained from the Xena database of the University of California Santa Cruz (UCSC)14 (https://xenabrowser.net/datapages/) and the Cancer Genome Atlas (TCGA) (https://portal.gdc.cancer.gov/). UCSC also contains GTEx and other public cancer genomics resources. Additionally, the gene expression data sets GSE54129, GSE65801,15 GSE29272,16 GSE66229,17 GSE118916,18 and GSE7997319 were downloaded from the Gene Expression Omnibus (GEO)20 database (https://www.ncbi.nlm.nih.gov/geo/). These GEO data sets contain gene expression data from multiple GC and normal gastric tissues. These data sets were used to validate the difference in the expression of FAM198B between GC tissues and normal gastric tissues. The RNA-seq files were downloaded in TPM format or converted to TPM format. Differences between groups were analyzed via the Wilcoxon test.
The Prognostic and Diagnostic Value of FAM198B in Patients with GC
The receiver operating characteristic (ROC) curve was used to evaluate the diagnostic ability of FAM198B for GC samples in the above data sets. The Kaplan‒Meier plotter21 (https://kmplot.com/analysis/) was used to analyze the correlation between FAM198B expression and the survival outcome of patients with GC. The effects of FAM198B on overall survival (OS) in 631 GC patients, first progression (FP) in 522 GC patients, and post-progression survival (PPS) in 384 GC patients were evaluated via Kaplan‒Meier Plotter. In addition, we assessed the associations of FAM198B with the clinical characteristics of patients with GC via the TCGA-STAD data set. The clinical characteristics of the 385 GC patients included in the TCGA-STAD data set are shown in Supplementary Table 1.
Construction and Evaluation of Nomogram Prediction Models
Combined with patient clinical information in the TCGA-STAD data set, FAM198B expression was analyzed by univariate and multivariate Cox regression. Factors with P-values less than 0.05 in the multivariate Cox analysis were used to construct a nomogram prediction model. The nomogram prediction model was carried out via the “rms” R package. Calibration curves for 1-year, 3-year, and 5-year survival, time-dependent ROC curves, and the C-index were used to evaluate the model’s reliability. The range of the C-index is 0.5–1. The higher the C-index is, the greater the reliability of the model.
Gene Set Enrichment Analysis (GSEA)
GSEA22 is a computational method to determine whether an a priori-defined set of genes shows statistically significant and consistent differences between two biological states. The TCGA-STAD RNA-seq data set [log2 (TPM+1) format] was used as gene expression profile data. The results with p<0.05 and false discovery rate (FDR)<0.05 were significantly enriched. The R packages “plyr”, “ggplot2”, “grid”, and “gridExtra” were used to visualize the top 12 gene ontologies (GO) and the top 10 Kyoto Encyclopedia of Genes and Genomes (KEGG) pathways with significant enrichment of FAM198B.
Coexpression Gene Analysis and Functional Enrichment Analysis
The LinkedOmics (http://www.linkedomics.org/login.php)23 database was used to calculate genes coexpressed with FAM198B. A volcano map and heatmap were drawn to visualize the results. Furthermore, genes with correlation coefficients greater than 0.6 were selected for gene ontology biological process (GOBP), gene ontology cellular component (GOCC), gene ontology molecular function (GOMF), and KEGG enrichment analysis via the “clusterProfiler”24 R package.
Immune Cell Infiltration and Immune Checkpoints
TIMER is a database that systematically analyzes immune cell infiltration in different types of cancer. This comprehensive resource provides a variety of methods for estimating the abundance of infiltrating immune cells in tumors. Furthermore, we used the ssGSEA algorithm based on the R package “GSVA”25 to calculate the infiltration of 28 types of immune cells in the TCGA-STAD GC samples. Furthermore, GC patients were divided into a high-expression FAM198B group and a low-expression FAM198B group according to the median expression level of FAM198B. Differences between groups were analyzed via the Wilcoxon test. The correlation between FAM198B and various immune cell markers was calculated via RNA-seq data in log (TPM+1) format from the TCGA-STAD data set. The immune checkpoints’ correlation calculation results were displayed on a radar map.
Specimen Collection
This study followed the Helsinki Declaration and was approved by the Ethics Committee of the Second Hospital of Lanzhou University (2024A-035). Written informed consent was obtained from all patients. Forty GC and corresponding adjacent tissue samples were collected from patients who underwent radical gastrectomy at the Second Hospital of Lanzhou University between January and February 2024. Each sample was divided into two parts. One part was snap frozen and stored in liquid nitrogen until RNA and protein extraction, and the other part was stored in 4% formaldehyde (Bioprimacy, Wuhan, China) for 24 h and then embedded in paraffin for immunohistochemical (IHC).
Cell Culture and Small Interfering RNA (siRNA) Transfection
Human GC cell lines [AGS (National Collection of Authenticated Cell Cultures, Shanghai, China), HGC27 (National Collection of Authenticated Cell Cultures, Shanghai, China), and MKN45 (Taiyuan Rosetta Stone Biotech Co., Ltd., Taiyuan, China)] and a normal human gastric mucosal epithelial cell line (GES-1) (Taiyuan Rosetta Stone Biotech Co., Ltd., Taiyuan, China) were cultured in RPMI 1640 medium (HyClone, Logan, Utah, USA) supplemented with 10% fetal bovine serum (Gemini, California, USA) in a humidified incubator at 37°C with 5% CO2. siRNA was used to inhibit the expression of FAM198B in AGS and HGC27 cells, which were seeded in 6-well plates at a concentration of 5×10⁵ cells/well.
SiFAM198B#1, siFAM198B#2, and non-targeted control siRNA (si-NC) were purchased from Beijing Tsingke Biotech Co., Ltd. Cells were treated with siFAM198B#1, siFAM198B#2, and si-NC. We used si-NC in our experiments to rule out non-specific effects of siRNA. The si-NC sequence has no homology with the mRNA of FAM198B. In addition, the si-NC group was used as the control group for statistical analysis with the siFAM198B group. After cell adherence, jetPRIME (Polyplus, Strasbourg, France) was used for siRNA transfection according to the manufacturer’s instructions.
siFAM198B#1 sense: 5′- GCUUAUCGAUGUAAUAGAA(dT)(dT)-3′.
siFAM198B#1 antisense: 5′- UUCUAUUACAUCGAUAAGC(dT)(dT)-3′.
siFAM198B#2 sense: 5′- GGUUAAGAUUGGAGAGCGA(dT)(dT)-3′.
siFAM198B#2 antisense: 5′- UCGCUCUCCAAUCUUAACC(dT)(dT)-3′.
RNA Extraction and Quantitative Real-Time Reverse Transcription PCR (qRT-PCR)
RNA was extracted from tissues and cells via TRIzol reagent (Servicebio, Wuhan, China). Then, the RNA was reverse transcribed into cDNA via Hifair® III 1st Strand cDNA Synthesis SuperMix for qPCR (gDNA digester plus) (cat. no.11141ES60; Yeasen, Shanghai, China) according to the manufacturer’s instructions. PCRs were performed with qPCR SYBR Green Master Mix (cat. no. 11201ES50; Yeasen, Shanghai, China). Gene expression was quantified via the 2−ΔΔCt method. Independent experiments were repeated three times.
FAM198B forward: 5′-GATGGCACTCTTTGATTTTTTGTTAC-3′,
FAM198B reverse: 5′-GGCCTCAATCCATTCTGTACACA-3′;
β-actin forward: 5′-TGGCACCCAGCACAATGAA-3′,
β-actin reverse: 5′-CTAAGTCATAGTCCGCCTAGAAGCA-3′.
β-actin was used as an internal control.
Western Blot
Total protein was extracted via RIPA lysis buffer (Boster, Wuhan, China) containing 1% PMSF (Boster, Wuhan, China), and the protein concentration was quantified with a BCA kit (Boster, Wuhan, China) according to the manufacturer’s instructions. A 10% separation gel was used for electrophoresis, and the proteins were transferred to a 0.45 μm PVDF membrane (Millipore, Massachusetts, USA). At room temperature, the membranes were blocked with skim milk powder for three hours. After being washed three times in TBST, the PVDF membranes were incubated overnight at 4°C with specific primary antibodies [FAM198B (cat. no. 25994-1-AP, 1:800, Proteintech, Wuhan, China), GAPDH (cat. no. 10494-1-AP, 1:8000, Proteintech, Wuhan, China), N Cadherin (cat. no. AB76011, 1:5000, Abcam, UK), Vimentin (cat. no. AB8069, 1:1000, Abcam, UK), Erk1/2 (cat. no. 4695, 1:1000, Cell Signaling Technology, MA, USA), p-Erk1/2 (cat. no. 4370, 1:2000, Cell Signaling Technology, MA, USA), p38 (cat. no. 8690, 1:1000, Cell Signaling Technology, MA, USA), and p-p38 (cat. no. 4511, 1:1000, Cell Signaling Technology, MA, USA)]. The membranes were washed three times in TBST and incubated with HRP-conjugated AffiniPure goat anti-rabbit IgG (cat. no. SA00001-2, 1:5000, Proteintech, Wuhan, China) for one hour at room temperature. Western blot visualization was performed with an enhanced chemiluminescence kit (cat. no. AR1197, Boster, Wuhan, China) and a chemiluminescence imaging system (VILBER, France). Finally, the semiquantitative analysis of the densitometry of bands was performed using the ImageJ software. Independent experiments were repeated three times.
IHC
Paraffin-embedded tissue sections were defatted with xylene and deparaffinized with decreasing ethanol concentrations, followed by washing with distilled water. The slides were then placed in a pressure cooker containing citrate antigen repair solution (pH 6.0) for 2.5 min for antigen repair, followed by incubation in 3% hydrogen peroxide for 20 min at room temperature to block endogenous peroxidase. The tissue area was blocked with 5% BSA (cat. no. EZ2811C238, BioFROXX, Germany) for 1 hour, followed by incubation with different concentrations of primary antibody (cat. no. 25994-1-AP, 1:100, Proteintech, Wuhan, China) at 4°C overnight. The secondary antibodies (cat. no. KIT9730, Maxim, Fuzhou, China) were then added and incubated at room temperature for 50 min, and DAB (cat. no. DAB-1031, Maxim, Fuzhou, China) was added for color development until the sections turned yellow. The final sections were counterstained with Harris hematoxylin, dehydrated in ethanol, transparently processed with xylene, and finally sealed with a neutral resin glue, and images were acquired with a microscope system (NOVEL, Ningbo).
Cell Counting Kit-8 Assay (CCK8)
The CCK8 assay determined cell viability. AGS, HGC27, and GES-1 cells in the logarithmic growth phase were counted on a cell counting plate. The cells were seeded in 96-well plates at a density of 5×10³/well and allowed to adhere for 5 hours before siRNA transfection or quercetin (cat. no. B20527, Shanghai Yuanye Bio-Technology Co., Ltd., China) treatment. The old medium was discarded at 24 h and 48 h, and the mixture was incubated for two hours with a complete medium containing 10% CCK8 solution (cat. no. BMU106-EN, Abbkine, Georgia, USA). The absorbance at a wavelength of 450 nm was measured with a Synergy NEO2 microplate reader (Agilent, USA). Cell viability (%) = [(experimental group-blank group)/(control group-blank group)] ×100%. Independent experiments were carried out with triplicate wells for each group and were repeated three times.
Cell Colony Formation Assay
AGS and HGC27 cells in the logarithmic growth phase were seeded in 6-well plates at 1×10³/well, supplemented with medium to 2 mL/well. The medium was changed every 3 days during this period. The cultures were terminated after 10 days. The medium was discarded, the cells were washed twice with PBS, and the cells were fixed by adding 4% paraformaldehyde for 30 min, followed by crystal violet for 30 min. Finally, the staining solution was washed with ultrapure water and dried in an oven. The images were acquired with a live-cell fluorescence microscopic imaging analysis system (Thermo Fisher, USA) and analyzed with ImageJ software. Independent experiments were repeated three times.
Transwell Assay
AGS and HGC27 cells in the logarithmic growth phase were digested and centrifuged, and the old medium was discarded. The cells were resuspended in 1640 medium and counted. A total of 3×10⁴ AGS or 4×10⁴ HGC27 cells or different concentrations of quercetin were added to each Transwell chamber (cat. no. 3422, Corning, NY, USA). RPMI 1640 was used to replenish the liquid in the upper layer to 200 µL. A total of 700 μL of complete medium containing 20% serum was added to the lower chamber of a 24-well plate under the chamber and incubated in an incubator. The liquid in the 24-well plate and chamber was discarded after 24 hours. The cells above the chamber were wiped with a cotton swab and washed twice with PBS. The chambers were immersed in 4% paraformaldehyde solution for 30 minutes and stained with 0.1% crystal violet for 30 minutes. After being rinsed with water, the plates were dried in a drying box, and images were acquired under a microscope with three random (×100) fields per well. For the invasion assay, the Matrigel matrix (cat. no. 356234, Corning, NY, USA) and 1640 medium were mixed at a 1:8 ratio, added to the upper layer of the chamber, and cultured in the cell incubator for 3 hours. After the supernatant was discarded, 70 μL of 1640 medium was added to each chamber and incubated in the incubator for 1 hour. The other procedures were the same as those for the migration test.
RNA-Seq
Twenty-four hours after the transfection of AGS cells with siFAM198B#1 and si-NC, total RNA was extracted via TRIzol. Total RNA from AGS cells transfected with siFAM198B#1 and AGS cells transfected with si-NC were subjected to RNA-seq analysis. The original sequencing reads were annotated with Homo_sapiens.GRCh38.107.chr as the reference genome. FPKM was used as the transcript or gene expression level format. |log2(Fold Change)|≥0.5 and P-value<0.05 were used as the screening criteria to calculate the differentially expressed genes between the si-NC group and the si-FAM198B#1 group. The biological functions of the differential genes were analyzed via GO, KEGG, and GSEA.
Statistical Analysis
R 4.3.1 software was used for all the statistical analyses. Statistical histograms were generated via GraphPad Prism 8 software. Student’s t-test and Wilcoxon’s test were used to compare the measurement data between the two groups. The chi-square test was used to analyze the count data. The Spearman test was used for correlation analysis. All calculations for which p<0.05 were considered statistically significant.
Results
FAM198B Is Abnormally Expressed in a Variety of Cancers
To understand how FAM198B is expressed in cancers, we performed a pan-cancer analysis of FAM198B using TIMER and GEIPA databases. Compared with adjacent tissues, FAM198B was more highly expressed in cholangiocarcinoma (CHOL), neck squamous cell carcinoma (HNSC), kidney chromophobe (KICH), kidney renal clear cell carcinoma (KIRC), liver hepatocellular carcinoma (LIHC), prostate adenocarcinoma (PRAD), and stomach adenocarcinoma (STAD) and less expressed in bladder urothelial carcinoma (BLCA), kidney renal papillary cell carcinoma (KIRP), lung squamous cell carcinoma (LUSC), rectum adenocarcinoma (READ) and uterine corpus endometrial carcinoma (UCEC) (Figure 1A). Furthermore, the results of the GEPIA analysis revealed that the differential expression trend of FAM198B between normal tissues and HNSC, KICH, KIRC, KIRP, STAD, and UCEC tissues was similar to that of TIMER (Figure 1B). These results suggested that FAM198B may be aberrantly expressed in various cancers.
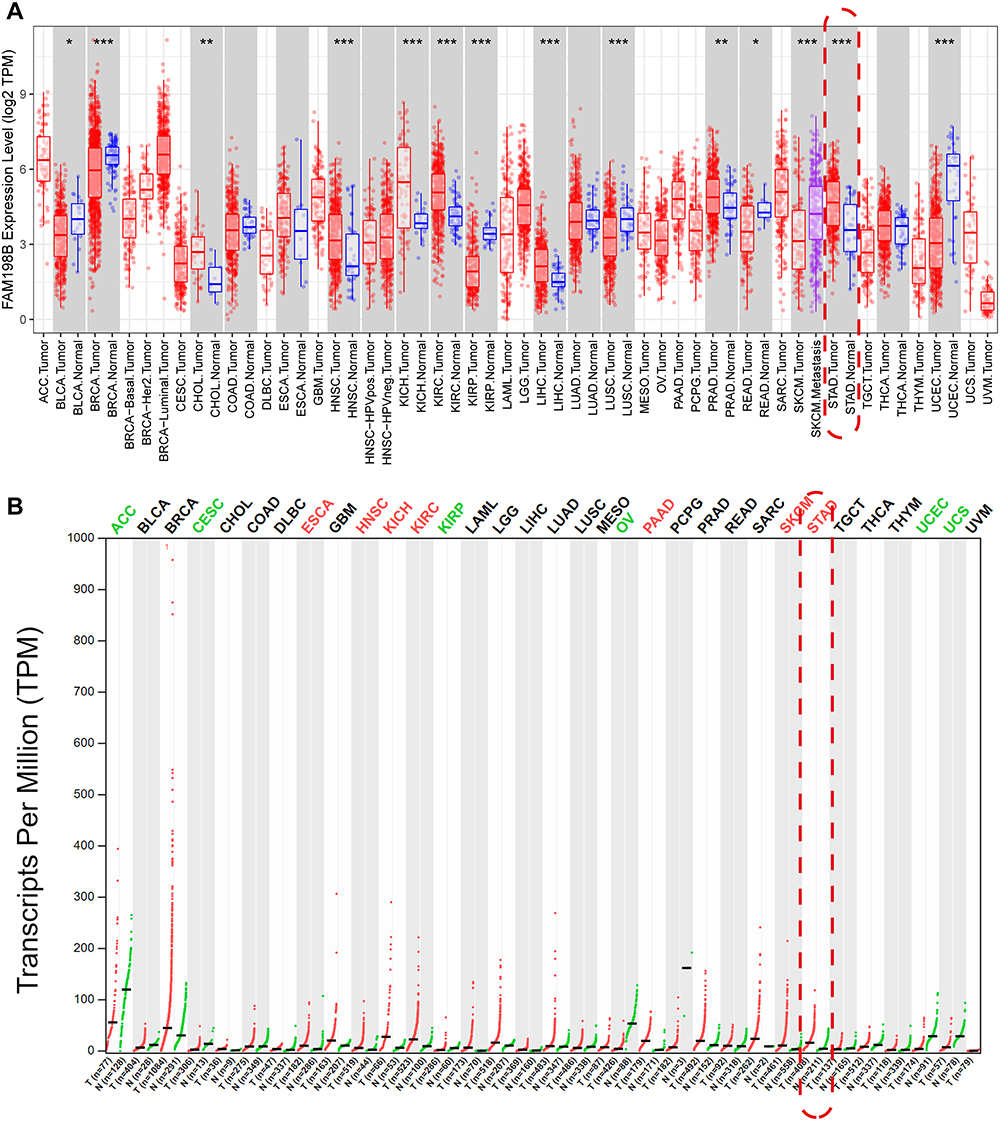 |
Figure 1 FAM198B is aberrantly expressed in a variety of cancers. (A) Box plot of the TIMER database. Red: tumor; blue: adjacent tissue. *, P< 0.05; **, P < 0.01; ***, P< 0.001. (B) Dot plot of the GEPIA database. Red: tumor; green: normal. Abbreviations: CHOL, cholangiocarcinoma; HNSC, neck squamous cell carcinoma; KICH, kidney chromophobe; KIRC, kidney renal clear cell carcinoma; LIHC, liver hepatocellular carcinoma; PRAD, prostate adenocarcinoma; STAD, stomach adenocarcinoma; BLCA, bladder urothelial carcinoma; KIRP, kidney renal papillary cell carcinoma; LUSC, lung squamous cell carcinoma; READ, rectum adenocarcinoma; UCEC, uterine corpus endometrial carcinoma. |
FAM198B Is Highly Expressed in GC Tissues
We used multiple TCGA and GEO data sets to explore the difference in FAM198B expression between GC and adjacent/normal tissues. After calculation, FAM198B was significantly more highly expressed in GC tissues than in adjacent tissues in the TCGA-STAD data set (Figure 2A) and normal gastric tissues in the GTEx data set (Figure 2B). The same results were obtained from the data sets of the paired samples of TCGA-STAD data set (Figure 2C), GSE54129 (Figure 2D), GSE65801 (Figure 2E), GSE29272 (Figure 2F), GSE66229 (Figure 2G), GSE118916 (Figure 2H) and GSE79973 (Figure 2I) data sets. These results suggested that FAM198B may be abnormally upregulated in GC tissue.
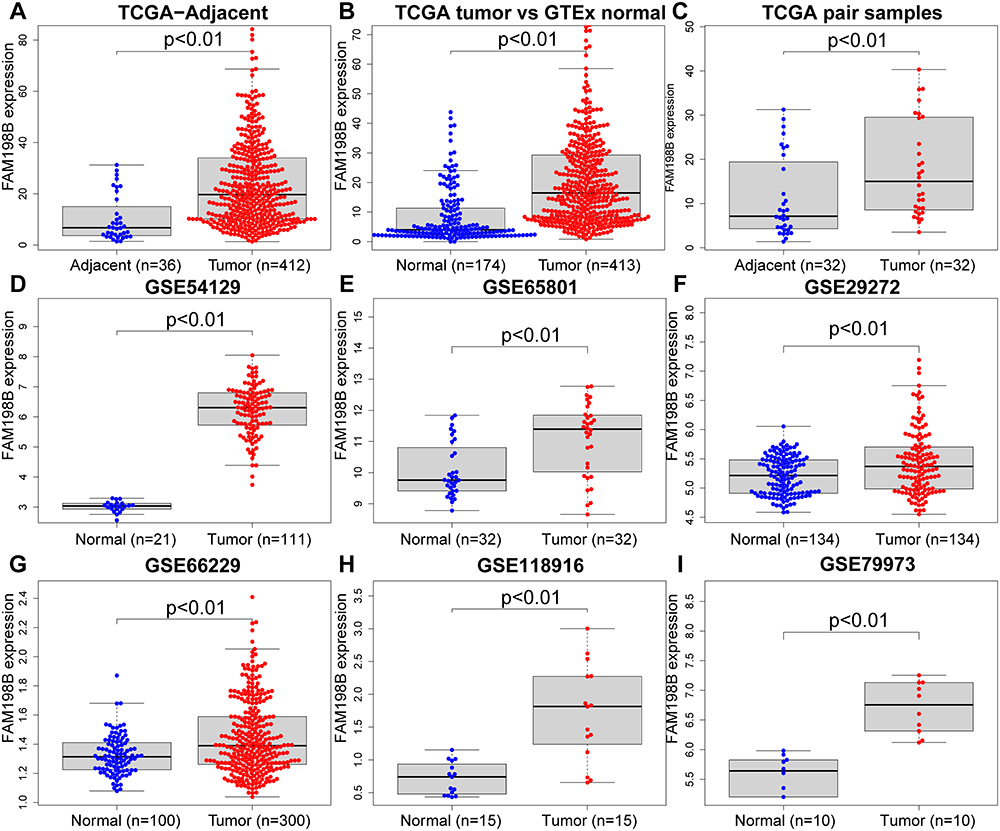 |
Figure 2 Compared to adjacent/normal tissues, FAM198B is highly expressed in GC tissues. (A) TCGA-STAD tumor vs adjacent samples. (B) TCGA-STAD tumor vs GTEx normal. (C) TCGA-STAD paired samples. (D) GSE54129. (E) GSE65801. (F) GSE29272. (G) GSE66229. (H) GSE118916. (I) GSE79973. Abbreviations: TCGA, the Cancer Genome Atlas; GTEx, Genotype-Tissue Expression; GEO, Gene Expression Omnibus. |
FAM198B Has Excellent Diagnostic and Prognostic Value in GC
Next, we analyzed the diagnostic efficacy, prognostic value, and association with clinical features of FAM198B in GC patients. In the TCGA-STAD GC and adjacent data set (AUC=78.92%), TCGA-STAD GC and GTEx normal gastric data set (AUC=80.26%), TCGA-STAD paired GC and adjacent data set (AUC=71.97%), GSE54129 (AUC=100%), GSE65801 (AUC=75.29%), GSE29272 (AUC=61.27%), GSE66229 (AUC=62.96%), GSE118916 (AUC=88.89%) and GSE79973 (AUC=100%) data sets, FAM198B had excellent ability to identify GC tissues (Figure 3A and B). Especially in the GSE54129 and GSE79973 data sets, the ROC curves of FAM198B for identifying GC samples showed 100% fit. Kaplan‒Meier Plotter analysis revealed a significant association between high expression of FAM198B and worse OS (p<0.001) (Figure 3C), worse FP (p<0.001) (Figure 3D), and worse PPS (p<0.001) (Figure 3E) in patients with GC. Furthermore, FAM198B expression was greater in deceased GC patients than in those who survived until the end of the follow-up period (Figure 3F). The GC patients with clinical stages 2–4 showed higher FAM198B expression than those with clinical stage 1 (Figure 3G). Furthermore, an increasing trend in FAM198B expression was observed with increasing T stage (Figure 3H), indicating its potential role in promoting the invasiveness of GC and contributing to a poor prognosis among GC patients.
 |
Figure 3 FAM198B is associated with excellent diagnostic value and worse prognostic and clinical characteristics in GC patients. ROC curves of FAM198B expression in GC tissues in the TCGA-STAD data sets (A) and GEO data sets (B). (C) Association of FAM198B expression with (C) OS, (D) FP, and (E) PPS in GC patients in the Kaplan‒Meier plotter database. Increased FAM198B was significantly associated with (F) death status, (G) higher clinical stage, and (H) higher T stage. Abbreviations: ROC, receiver operating characteristic; AUC, the area under the curve; TCGA, the Cancer Genome Atlas; GC, gastric cancer; GTEx, Genotype-Tissue Expression; GEO, Gene Expression Omnibus; OS, overall survival; FP, first progression; PPS, post-progression survival; HR, hazard ratio. |
High Expression of FAM198B is Associated with Poor Prognosis in Patients with GC
In addition, we further verified the association of FAM198B with poor prognosis in GC patients. Univariate and multivariate Cox regression analyses revealed that FAM198B, age, and clinical stage were independent risk factors for poor OS (Figure 4A) (Table 1). Based on the results of the multivariate Cox analysis, a nomogram prediction model was constructed in which FAM198B, age, and clinical stage from the TCGA-STAD data set were used to predict OS at 1, 3, and 5 years in GC patients (Figure 4B). The C-index of the nomogram was 0.642 (95% CI: 0.617–0.667). ROC analysis revealed that the model had certain accuracy in identifying the 1-year (AUC=66%: 95% CI=58.93–73.24%), 3-year (AUC=66%: 95% CI=56.43–75.71%), and 5-year (AUC=72%: 95% CI=57.54–87%) OS of patients with GC (Figure 4C). The results of the calibration curve prediction and the actual probability of occurrence were a good fit, indicating that this is an ideal model (Figure 4D–F). The above results suggested that FAM198B is associated with a poor prognosis in patients with GC.
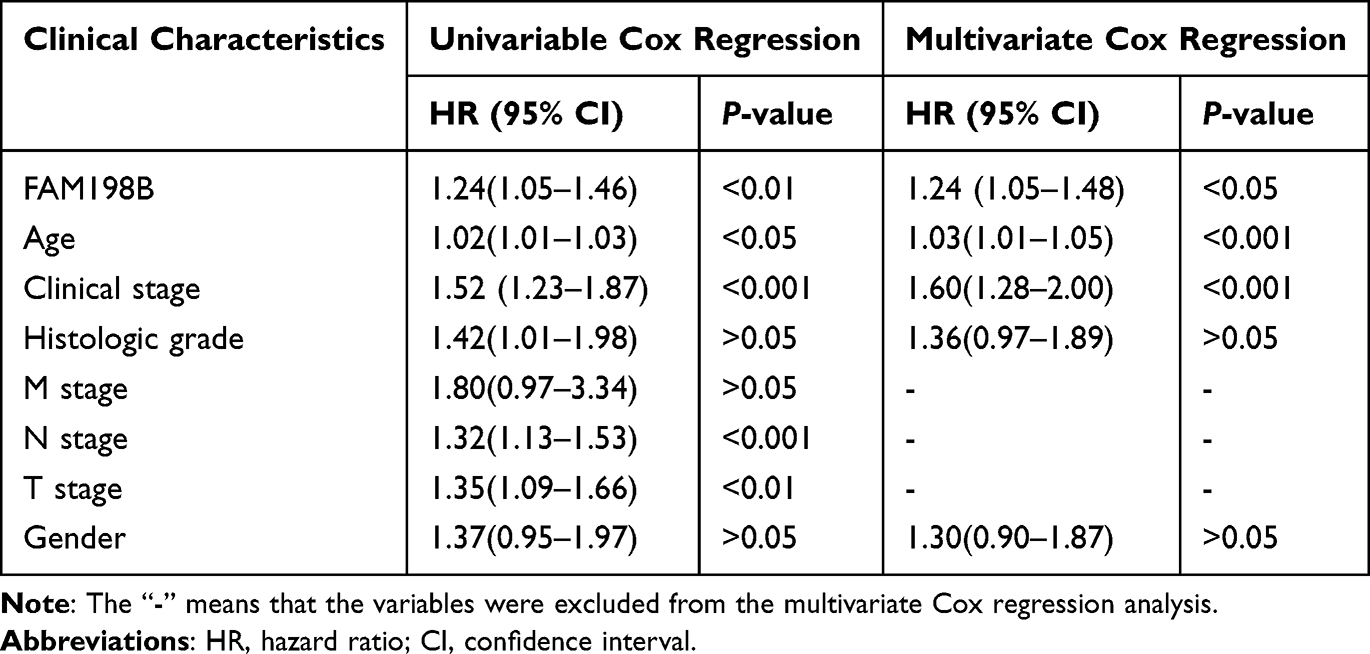 |
Table 1 Cox Regression Analysis Based on TCGA-STAD Data Set |
 |
Figure 4 Construction and evaluation of the nomogram prediction model for GC. (A) The forest map shows the results of multivariate Cox regression analysis. (B) Nomogram of FAM198B expression and multiple clinical factors constructed via the TCGA-STAD data set. (C) Time-dependent ROC curves of the nomogram. (D-F) Calibration curves of the nomogram at 1, 3, and 5 years. Abbreviations: ROC, receiver operating characteristic; AUC, the area under the curve; OS, overall survival. |
GSEA of FAM198B in GC
To explore the bioscience processes in which FAM198B may be involved, we performed a GSEA on FAM198B via the TCGA-STAD data set. GSEA revealed that extracellular matrix (ECM) assembly, ECM receptor interaction, lymph vessel development, focal adhesion, and the TGF beta signaling pathway were significantly enriched in GC patients with high expression of FAM198B (Figure 5A and B), indicating that elevated FAM198B may participate in the occurrence and progression of GC through these pathways. These results also suggested that FAM198B may be related to the invasion and migration of GC.
 |
Figure 5 GSEA results of FAM198B in GC. (A) The top 12 results of GO analysis. (B) The top 10 results of KEGG analysis. Abbreviations: GOBP, gene ontology biological process; GOCC, gene ontology cellular component; GOMF, gene ontology molecular function; KEGG, Kyoto Encyclopedia of Genes and Genomes. |
FAM198B Coexpressed Genes and Related Functions in GC
To further investigate the biological significance of FAM198B in GC, genes coexpressed with FAM198B were detected via the LinkedOmics database. With an FDR less than 0.01 and an absolute correlation coefficient greater than 0.2, 5086 genes (red dots) were positively correlated with FAM198B, and 2809 genes (green dots) were negatively correlated (Figure 6A). The 50 genes with the most significant correlations with FAM198B are shown in the heatmaps (Figure 6B and C).
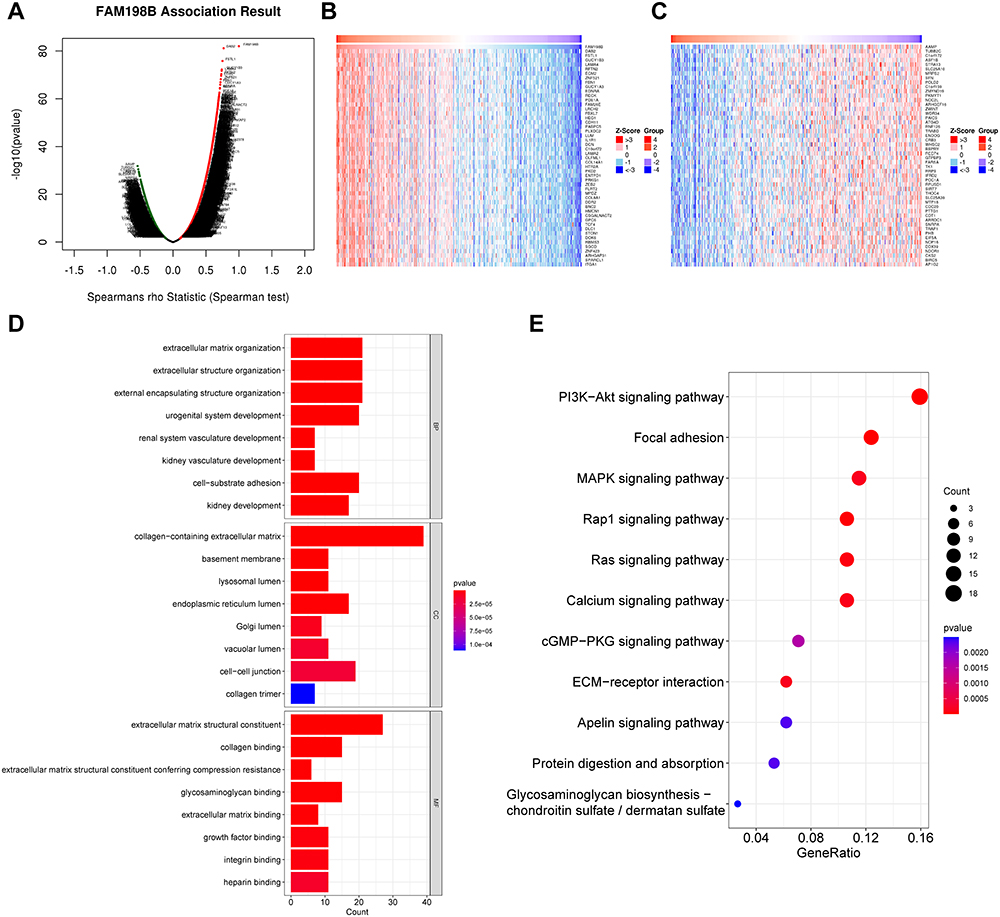 |
Figure 6 FAM198B coexpressed genes and their functional enrichment. (A) The volcano map shows the positive and negative genes correlated with FAM198B in GC. The heatmap shows the top 50 genes with significant positive (B) and negative (C) correlations with FAM198B. GO (D) and KEGG (E) enrichment analysesof coexpressed FAM198B genes with correlation coefficients greater than 0.6 were performed. Abbreviations: BP, biological process; CC, cellular component; MF, molecular function. |
In general, coexpressed genes often have similar biological functions. Therefore, coexpressed genes with correlation coefficients greater than 0.6 were used for functional enrichment analysis. The GO enrichment results revealed that FAM198B was significantly enriched in extracellular matrix organization, extracellular structure organization, the Golgi lumen, the lysosomal lumen, integrin binding, and cell−substrate adhesion (Figure 6D). Analysis of the KEGG pathway revealed that the genes coexpressed with FAM198B were associated mainly with the PI3K-AKT signaling pathway, focal adhesion, ECM-receptor interaction, Ras signaling pathway, MAPK signaling pathway, Rap1 signaling pathway, etc. (Figure 6E). This finding is consistent with the GSEA results, indicating that FAM198B may be closely associated with the extracellular matrix and involved in cell adhesion, which may explain why FAM198B is related to the progression and invasiveness of GC.
FAM198B is Associated with Immune Cell Infiltration and Immune Checkpoints in GC
This study further explored the relationship between FAM198B and immune infiltration in GC via TIMER, ssGSEA algorithm, and TCGA-STAD data set. TIMER analysis revealed that FAM198B was weakly correlated with CD8+ T cells, neutrophils, and dendritic cells. However, it was moderately correlated with CD4+ T cells (cor=0.413, p<0.001) and macrophages (cor=0.616, p<0.001) (Figure 7A). In addition to activated CD4 T cells, activated CD8 T cells, type 17 T helper cells, CD56bright natural killer cells, CD56dim natural killer cells, and neutrophils, the other 22 types of immune cells had relatively high levels of infiltration in the high-FAM198B expression group (Figure 7B). Analysis of immune cell markers revealed that FAM198B was moderately correlated with macrophages, especially M2 macrophages, tumor-associated macrophage (TAM), and regulatory T (Treg) cells (Table 2). Furthermore, we found that FAM198B was associated with multiple immune checkpoints related to T-cell exhaustion, such as CTLA4, CD274, HAVCR2, TIGIT, PDCD1LG2, CD276, CD40, ICOS, and TNFRSF4 (Figure 7C). These results indicated that FAM198B may be closely related to the immune microenvironment of GC. Still, it may promote GC immunosuppression and facilitate the immune escape of tumor cells in multiple ways.
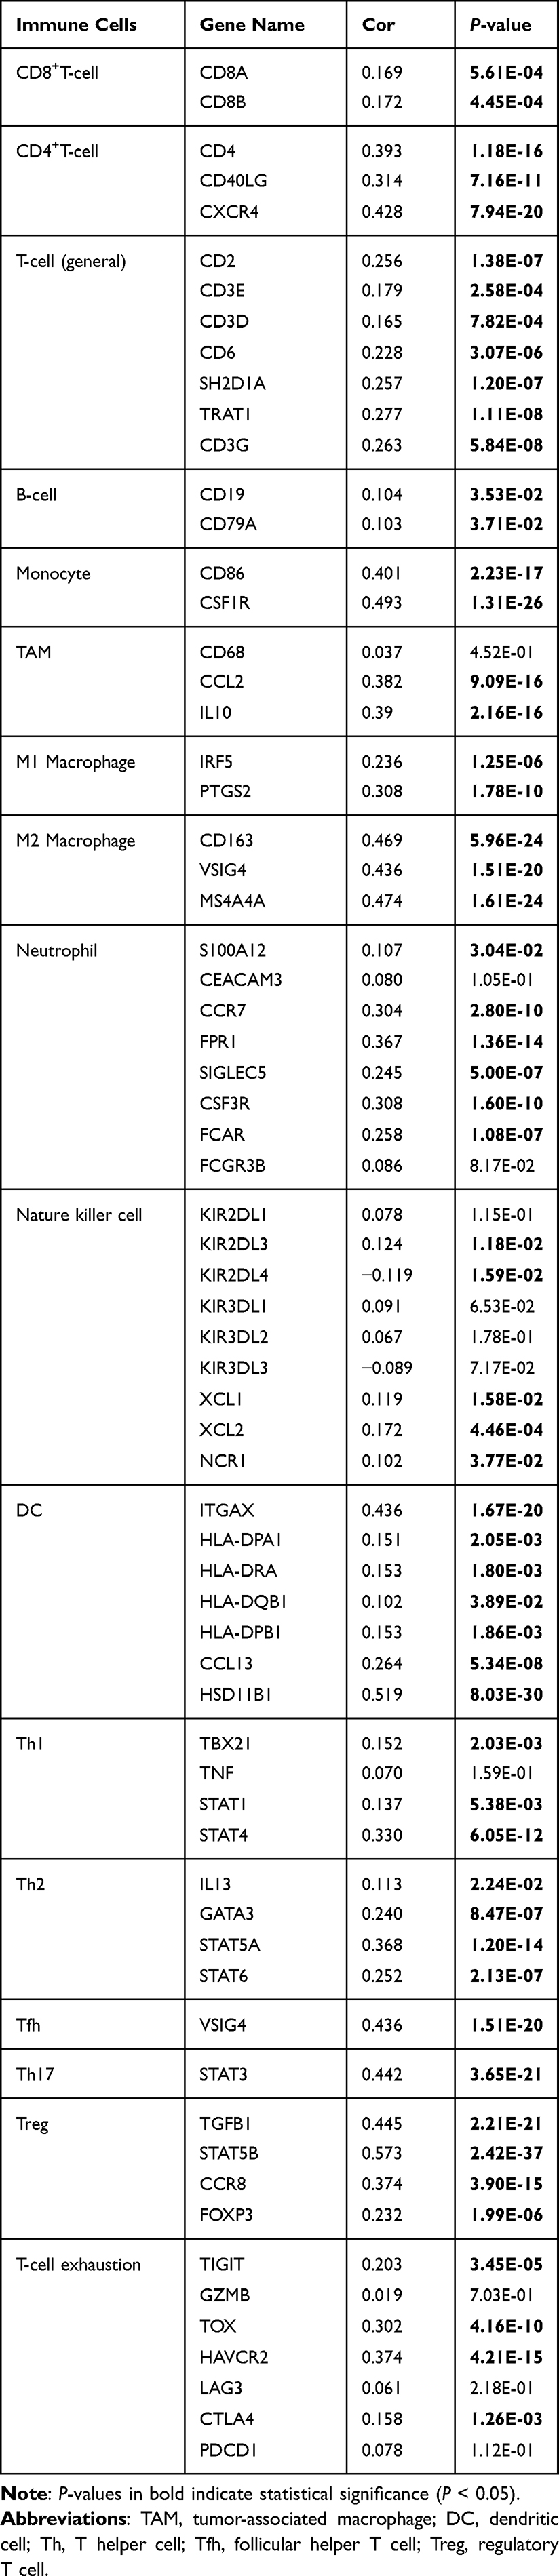 |
Table 2 Correlations Between FAM198B and Immune Cell Marker Genes in TCGA-STAD Data Set |
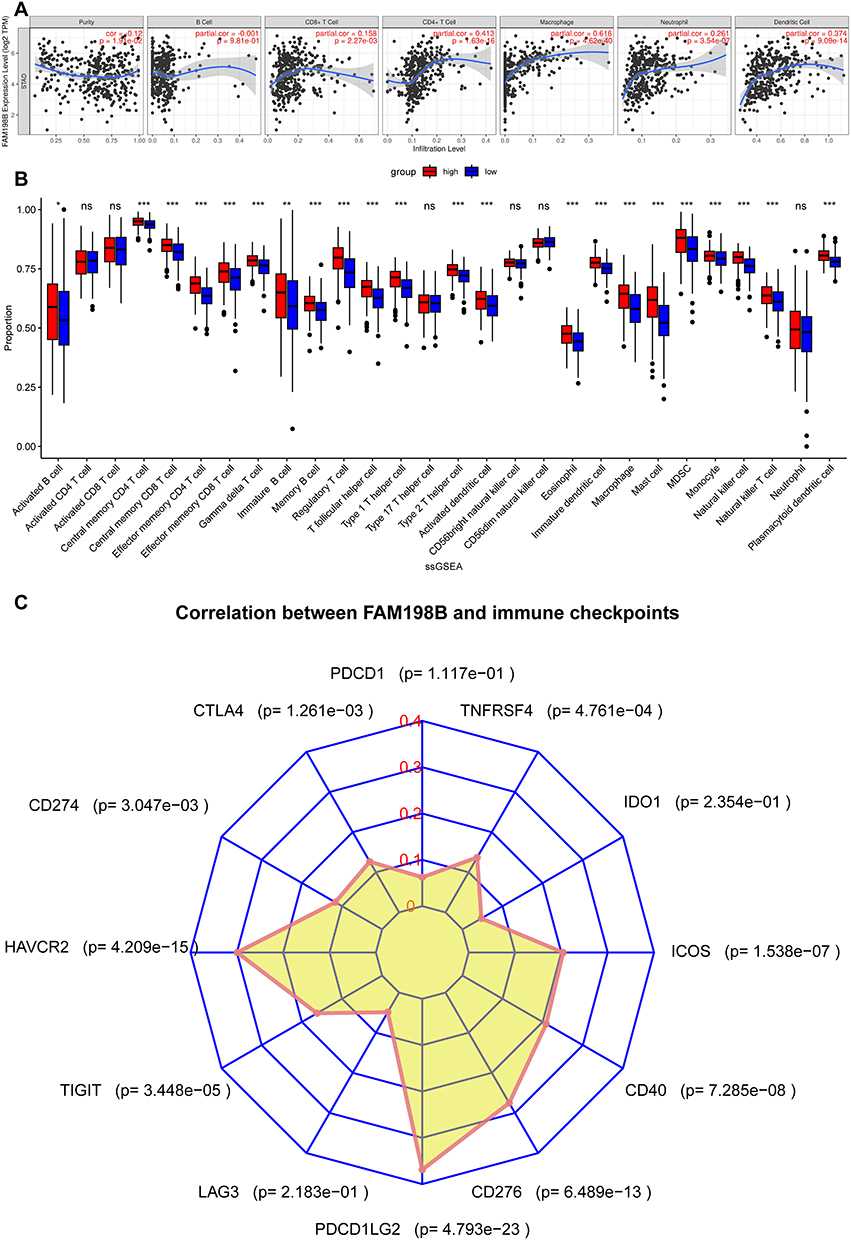 |
Figure 7 FAM198B is correlated with immune cell infiltration and immune checkpoints. (A) Analysis of the infiltration levels of 6 types of immune cells via the TIMER database. (B) Analysis of the infiltration levels of 28 types of immune cells via ssGSEA. (C) Correlations between FAM198B expression and immune checkpoints. *, P< 0.05; **, P < 0.01; ***, P< 0.001. Abbreviation: ns, not significant. |
FAM198B is Highly Expressed in GC Tissue Samples
To verify the expression of FAM198B in tissues from patients with GC, we detected the FAM198B mRNA and protein expression levels in 40 pairs of GC tissues and adjacent tissues from the Second Hospital of Lanzhou University. qRT-PCR (Figure 8A), IHC (Figure 8B and E), and WB (Figure 8C and D) revealed that FAM198B was significantly highly expressed in GC tissues.
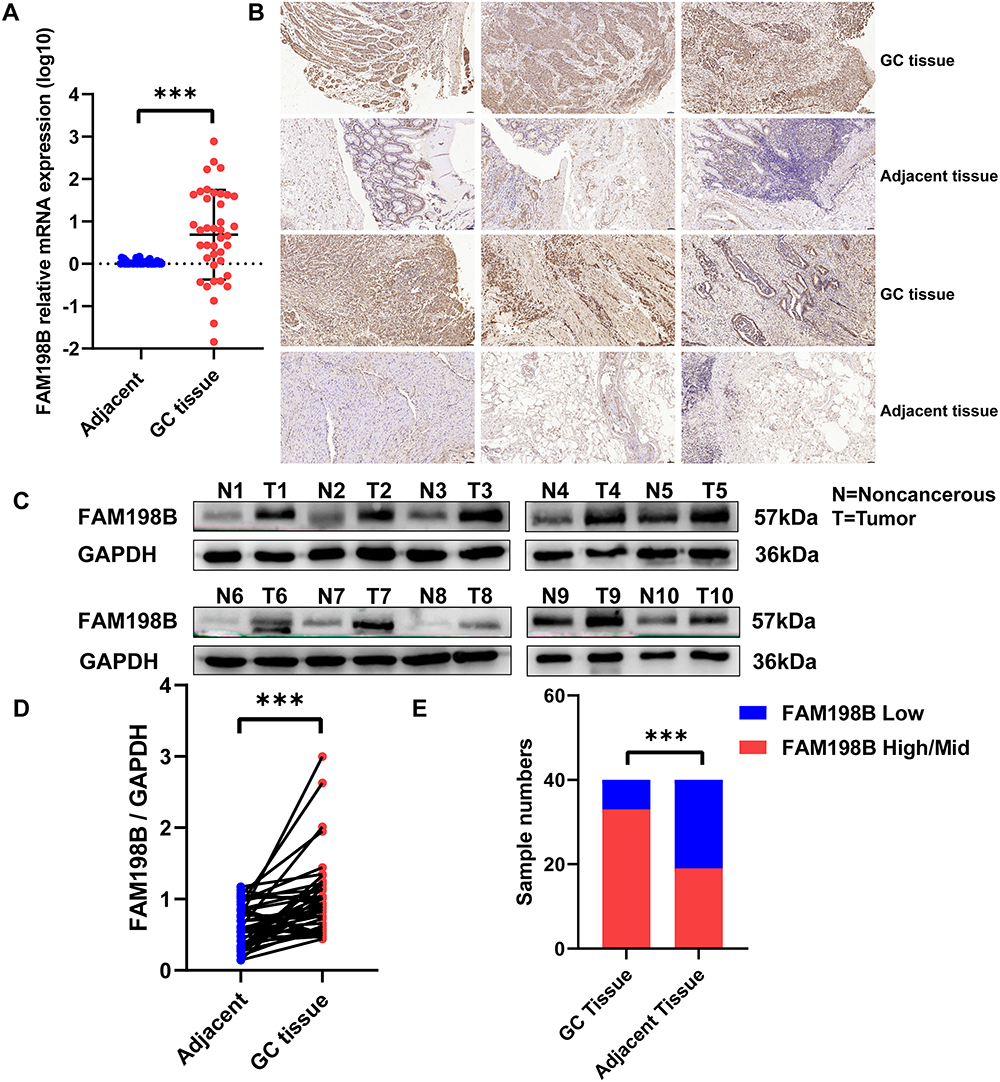 |
Figure 8 Compared to adjacent clinical tissues, the mRNA and protein of FAM198B are highly expressed in GC clinical tissues. (A) qRT-PCR detected the relative expression of FAM198B mRNA of GC/adjacent tissues. (B-E) IHC (scale bar=50 μm) and (C–D) Western blot analyzed the expression of FAM198B protein of GC/adjacent tissues. ***, p< 0.001. |
Knockdown of FAM198B Inhibits the Proliferation, Migration, and Invasion of GC Cells
Various in vitro assays were performed to assess the roles of FAM198B in GC. Firstly, we found that the expression of FAM198B mRNA (Figure 9A) and protein (Figure 9B) was significantly greater in the GC cell lines AGS and HGC27 than in the normal gastric epithelial cell line GES-1. Although the expression of FAM198B mRNA was greater in MKN45 cells than in GES-1 cells, there was no significant difference in the protein level. Therefore, we did not use the MKN45 cell line for subsequent experiments. Si-FAM198B RNA significantly downregulated the mRNA (Figure 9C) and protein (Figure 9D) expression of FAM198B in the AGS and HGC27 cells. The results of the CCK8 assay revealed that si-FAM198B significantly inhibited the proliferation of AGS and HGC27 cells at 48 h and 72 h after transfection (Figure 9E), and these results were confirmed by the colony formation assays (Figure 9F). Transwell assays revealed that inhibition of FAM198B expression attenuated the migration (Figure 9G) and invasion (Figure 9H) abilities of AGS and HGC27 cells. These results confirmed that FAM198B is highly expressed in GC cells and that FAM198B knockdown significantly inhibits GC cell proliferation, migration, and invasion.
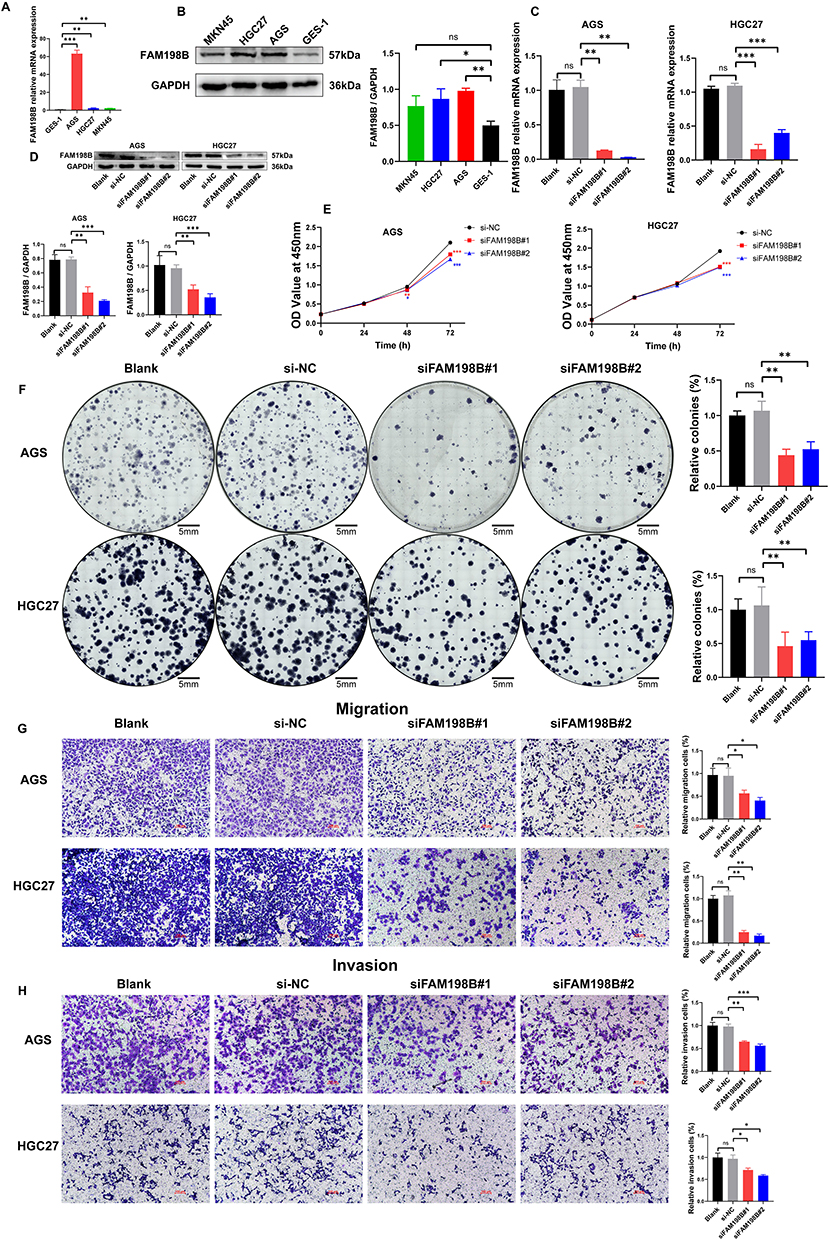 |
Figure 9 FAM198B knockdown significantly inhibits GC cell proliferation, migration, and invasion. (A) qRT-PCR and (B) Western blot detected the expression of FAM198B of GC cells and GES-1 cells. Knockdown efficiency of si-RNAs in GC cells was assessed by qRT-PCR (C) and Western blot (D). The effects of FAM198B knockdown on AGS and HGC27 cell proliferation capacity were detected via the CCK8 assay (E) and the colony formation assay (scale bar=5 mm) (F). The effects of FAM198B knockdown on the migration (G) and invasion (H) of AGS and HGC27 cells were determined via Transwell assays (scale bar=100 μm). *, P< 0.05; **, P < 0.01; ***, P< 0.001. Abbreviation: ns, not significant. |
The Results of the RNA-Seq After Knockdown of FAM198B in GC Cells
To explore the mechanism of the inhibition of GC progression after FAM198B knockdown, we performed RNA-seq to compare the effects of si-NC and si-FAM198B in AGS cells. Three independent duplicate samples were set for each group. The box plot in Figure 10A shows that the overall gene expression levels in the six samples were low dispersion, indicating that sample production was highly reproducible. The principal component analysis (PCA) revealed high similarity between the three repeated samples of the two groups. In contrast, the distribution difference between the si-NC group and the si-FAM198B group was significant, and the two groups were suitable for further difference analysis (Figure 10B). | log2(Fold Change) |≥0.5 and P-value<0.05 were used as standards to detect differentially expressed genes and 132 genes were downregulated, whereas 245 genes were upregulated (Figure 10C and D). GO (Figure 10E) and KEGG (Figure 10F) analyses revealed that these differential genes were significantly associated with biological adhesion, immune system processes, biological adhesion, focal adhesion, apoptosis, cell cycle, the MAPK signaling pathway, the AMPK signaling pathway, the PI3K‒AKT signaling pathway, and other biological processes. GSEA suggested that suppression of FAM198B expression reduced cell proliferation, which is consistent with our experimental results (Figure 10G).
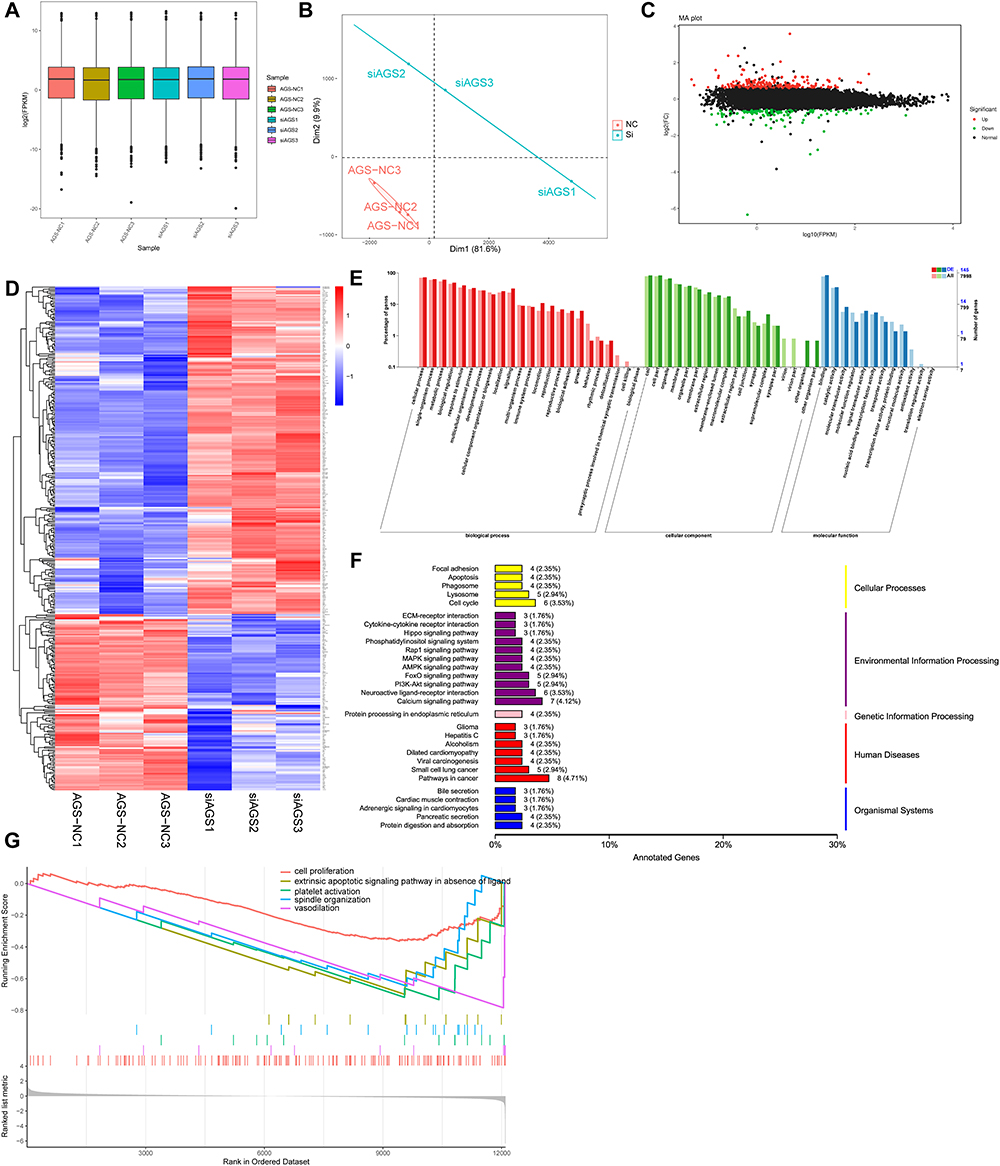 |
Figure 10 RNA-seq and bioinformatic analysis of the si-FAM198B and si-NC AGS cell lines were performed. Sample consistency test (A) and PCA results (B) of the six groups of sequencing samples. Volcano map (C) and heatmap (D) of the difference analysis results between the si-NC and si-FAM198B groups. GO (E), KEGG (F), and GSEA (G) analyses of differentially expressed genes between the si-NC group and the si-FAM198B group. Abbreviations: PCA, principal component analysis; FC, Fold Change. |
Knockdown of FAM198B Inhibits the Epithelial-Mesenchymal Transition (EMT) and the MAPK Signaling Pathway of GC Cells
Our previous bioinformatics analysis and experiments showed that FAM198B was associated with the invasion and metastasis of GC cells, so we detected the EMT key molecules E-cadherin N-cadherin, and Vimentin by TIMER database. We found that N-cadherin (cor=0.483, p<0.001) and Vimentin (cor=0.663, p<0.001) were significantly positively correlated with FAM198B in the TCGA-STAD cohort, while E-cadherin was not significantly correlated with FAM198B (Figure 11A). Western blot confirmed that N-cadherin and Vimentin proteins were down-regulated considerably with FAM198B knockdown, indicating that FAM198B knockdown inhibited EMT in GC (Figure 11B). In addition, Western blot assays confirmed that the phosphorylation levels of p-Erk1/2 and p-p38 decreased significantly after FAM198B knockdown in AGS and HGC27 cells. In contrast, the protein levels of p38 and Erk1/2 did not change significantly (Figure 11C). In conclusion, these experiments confirmed that FAM198B knockdown suppresses the malignant behavior of GC cells by inhibiting EMT and the phosphorylation of the MAPK signaling pathway.
 |
Figure 11 FAM198B knockdown inhibits GC cells’ EMT and MAPK signaling pathways. The correlation between FAM198B and E-cadherin, N-cadherin, and Vimentin was explored in the TIMER database (A). Western blottings were used to detect the protein expression levels of EMT (B) and MAPK signaling pathway (C) molecules after the knockdown of FAM198B in AGS and HGC27 cell lines. **, P < 0.01; ***, P< 0.001. Abbreviation: ns, not significant. |
Quercetin Inhibits the Proliferation, Migration, and Invasion of GC Cells by Inhibiting FAM198B Expression of GC Cells
In the above study, we found that FAM198B knockdown can suppress the malignant behavior of GC cells, suggesting that FAM198B may be a potential therapeutic target for GC. To further explore the relationship between FAM198B and the pharmacological treatment of GC, we searched the HERB database (http://herb.ac.cn/) and identified FAM198B as a potential quercetin target. Quercetin is a natural flavonoid with various pharmacological activities, and its ability to inhibit GC has been widely explored.26 Additionally, whether it regulates FAM198B is still unknown. Next, we validated this predictive information. AGS, HGC27, and GES-1 cells were treated with quercetin at different concentrations (0, 2, 5, 10, 20, 50, 100, 200, and 400 μM), and the viability of each cell line was detected via the CCK8 assay. We found that quercetin inhibited the proliferation of AGS [24 h half maximal inhibitory concentration (IC50)=110.7 μm] and HGC27 (24 h IC50=183.6 μm) cells in a time-dependent and dose-dependent manner. Concentrations of 50, 100, and 200 μM and 100, 150, and 300 μM were selected as the intervention concentrations for AGS and HGC27 cells in the following experiments (Figure 12A). Interestingly, we found that quercetin was less toxic to GES-1 (24 h IC50=355.8 μm) cells than to AGS and HGC27 cells (Figure 12A). Western blot revealed that the expression of the FAM198B protein of AGS and HGC27 cells was inhibited by quercetin in a dose-dependent manner (Figure 12B). The colony formation assay confirmed that higher concentrations of quercetin had a better inhibitory effect on the colony formation of the AGS and HGC27 cells (Figure 12C). The Transwell assay revealed that quercetin inhibited the migration and invasion of AGS and HGC27 cells in a dose-dependent manner (Figure 12D). All the above results illustrated that quercetin inhibits the proliferation, migration, and invasion of GC cells by inhibiting FAM198B of GC cells.
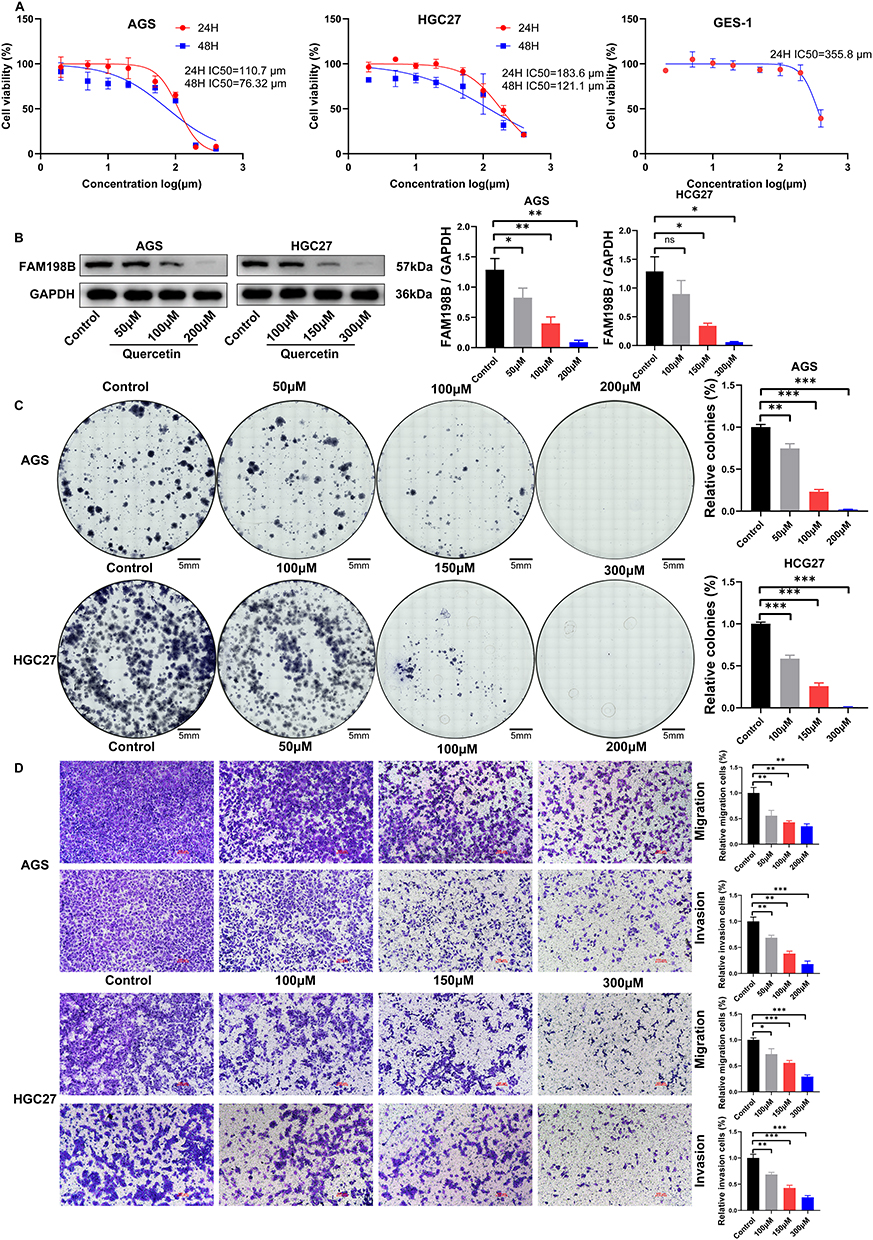 |
Figure 12 Quercetin inhibits GC cell proliferation, migration, invasion, and FAM198B expression. (A) The CCK8 assay was used to determine the IC50 concentration of quercetin in the AGS, HGC27, and GES-1 cells. (B) Western blottings were used to detect the effect of quercetin on the protein expression of FAM198B of AGS and HGC27 cells. (C) Colony formation assays were used to detect the inhibitory effect of quercetin on the proliferation of the GC cells (scale bar=5 mm). (D) Transwell assays were used to detect the effect of quercetin on the migration and invasion of AGS and HGC27 cells (scale =100 μm). *, P< 0.05; **, P < 0.01; ***, P< 0.001. Abbreviations: ns, not significant, IC50, half maximal inhibitory concentration. |
Quercetin Inhibits the EMT and MAPK Signaling Pathway of GC Cells
Following establishing quercetin’s role in GC, we next explored how quercetin regulates EMT and MAPK pathways. Western blot assay confirmed that quercetin inhibited N-Cadherin and Vimentin proteins in a dose-dependent manner (Figure 13A). In addition, Western blottings revealed that quercetin inhibited the phosphorylation of p-Erk1/2 and p-p38 in a dose-dependent manner but had no effect on the Erk1/2 and p38 proteins (Figure 13B). In conclusion, our results suggested that quercetin inhibits GC progression by inhibiting the FAM198B/MAPK pathway (Figure 14).
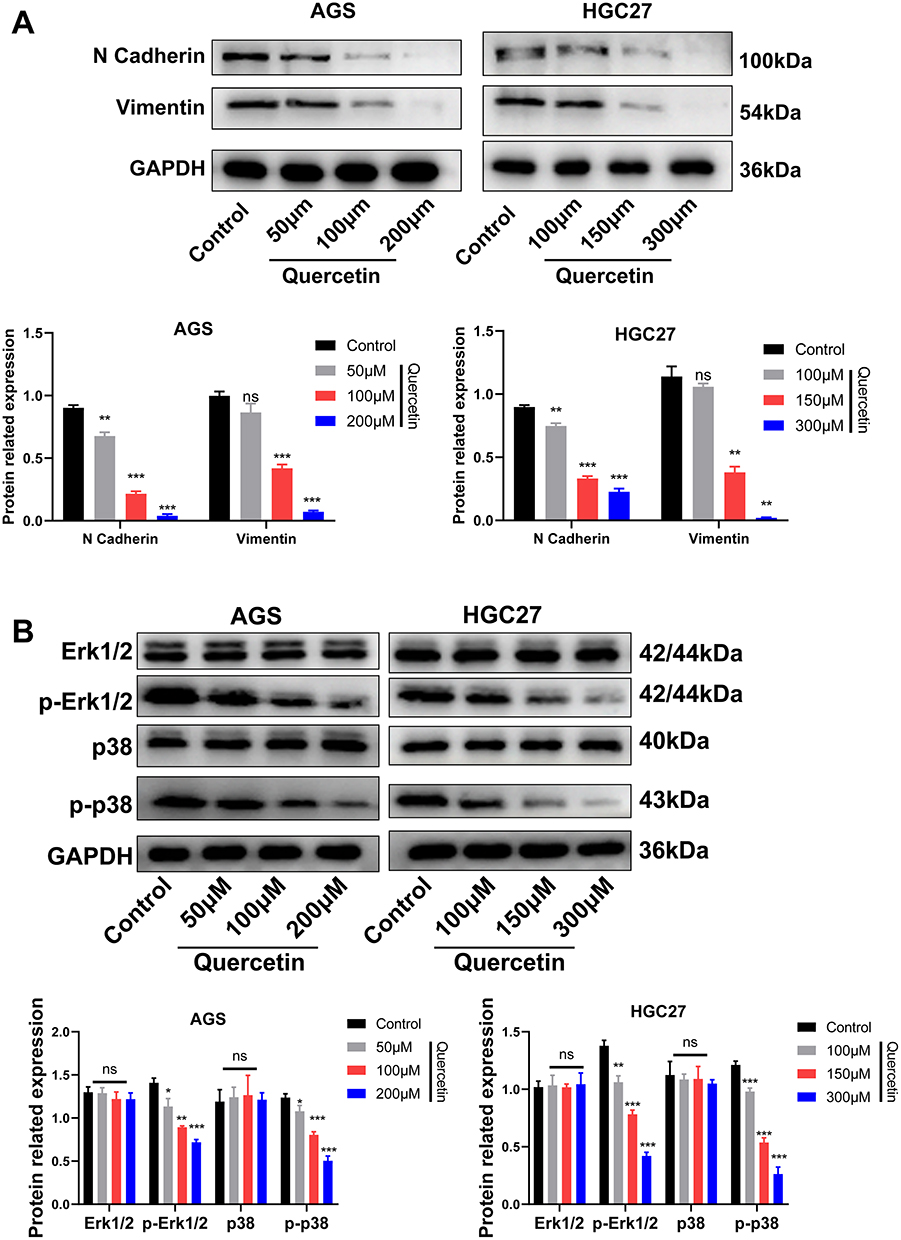 |
Figure 13 Quercetin inhibits the EMT (A) and MAPK signaling pathways (B) of GC cells. *, P< 0.05; **, P < 0.01; ***, P< 0.001. Abbreviation: ns, not significant. |
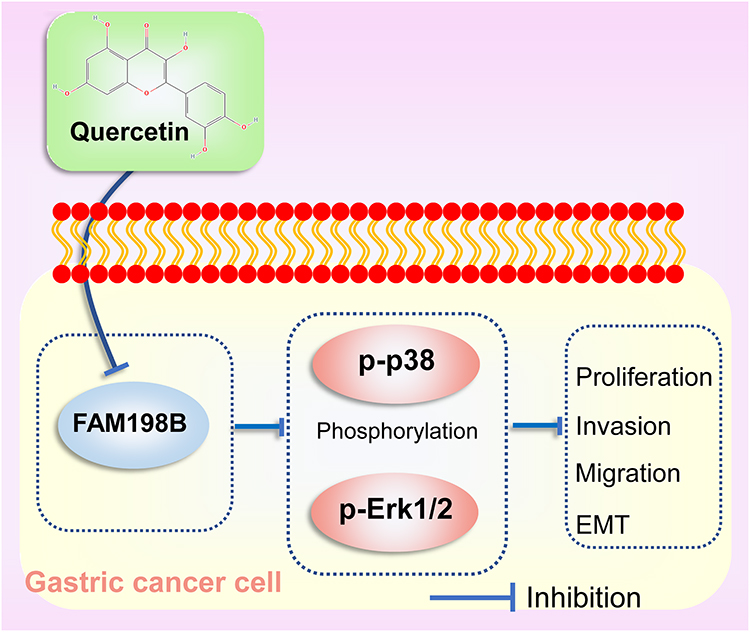 |
Figure 14 Quercetin inhibits GC cell proliferation, migration, invasion, and EMT by inhibiting the FAM198B/MAPK signaling pathway. |
Discussion
A previous study has preliminarily reported the expression and partial function of FAM198B in GC.6 However, it only used the GEIPA database and IHC to explore the expression of FAM198B in GC tissues. In contrast, we used multiple data sets, IHC, qRT-PCR, and Western blot, to investigate the expression difference of FAM198B in GC tissues, which made the result more convincing. Moreover, our ROC analysis of multiple data sets and comprehensive prognostic analysis suggested that FAM198B may be a promising diagnostic and prognostic marker in GC. Interestingly, studies in both colorectal cancer5 and GC6 found that FAM198B promoted cell migration and invasion, but the effect of FAM198B on EMT was not detected. Based on migration and invasion assays, we further found that N-Cadherin and Vimentin proteins were decreased after FAM198B knockdown, indicating that FAM198B can affect the EMT of GC cells, which expanded the understanding of the function of FAM198B. EMT is a process in which the epithelial characteristics of cells are lost, and the mesenchymal characteristics are increased by changing cell adhesion molecules and cytoskeleton. It allows tumor cells to survive, metastasize, maintain stem cell characteristics, and drug resistance.27 Our findings implied that FAM198B may be closely related to GC cell metastasis, stem cell characteristics, and drug sensitivity.
Our GSEA and gene coexpression analysis indicated that FAM198B may be associated with ECM receptor interactions, lymph vessel development, focal adhesion, and the TGF-beta signaling pathway. Previous studies28 have demonstrated that tumor-associated lymphangiogenesis contributes to tumor immune tolerance and facilitates immune evasion by tumor cells. As a noncellular component of the tumor microenvironment (TME),29 the ECM undergoes continuous remodeling influenced by intercellular activities within the TME.30 This remodeling weakens the immune response of cytotoxic immune cells, creating an immunosuppressive microenvironment that shields tumor cells from elimination and promotes their survival and progression.30 Adherence to the ECM enables tumor cells to resist anoikis during migration.30 In other words, the ECM and cell adhesion are “accomplices” in promoting tumor migration.30 It has been reported31 that the TGF-beta signaling pathway contributes to constructing an immunosuppressive microenvironment for tumors while encouraging their development. In conclusion, these analyses suggested that FAM198B may be involved in tumor metastasis and immunosuppression.
The pathway analysis of the coexpression gene and RNA-seq revealed the impact of FAM198B on the PI3K-AKT and MAPK signaling pathways. In a recently published study by Chen et al,6 FAM198B was initially shown to promote the progression of GC through the PI3K/AKT/Bcl-2 axis in vitro experiments. As a classical pathway related to tumors, the activation of the MAPK pathway promotes the proliferation, growth, and survival of tumor cells.32 However, no evidence exists of a relationship between FAM198B and MAPK pathways in GC. Notably, we found that FAM198B knockdown leads to the inhibition of the MAPK pathway in this study. Our results suggested that inhibition of FAM198B expression suppresses the malignant behavior of GC cells by inhibiting the MAPK pathway.
Quercetin is a flavonoid and has significant potential for antitumor activity.33 Previous studies33 the regulation of cyclins, proapoptotic factors, and the MAPK signaling pathway mediates its antitumor effect.10 However, the molecular mechanism of how quercetin regulates MAPK is unclear and worthy of further exploration. Our bioinformatic analysis and in vitro experiments demonstrated that quercetin negatively regulates FAM198B expression and effectively suppresses GC cell proliferation, migration, invasion, and EMT. Interestingly, this effect was comparable to the reduction in FAM198B knockdown, suggesting that quercetin exerts inhibitory effects on GC growth by downregulating FAM198B expression. In particular, the downregulation of FAM198B resulted in the inhibition of p-p38 and p-Erk1/2 phosphorylation. Furthermore, our study verified the ability of quercetin to inhibit the phosphorylation of p-p38 and p-Erk1/2 in both AGS and HGC27 cells. Interestingly, Li et al9 confirmed that quercetin can inhibit metastasis in AGS and BGC823 GC cells by inhibiting p-Erk1/2 phosphorylation, consistent with our findings. These findings showed quercetin inhibits GC progression by downregulating FAM198B expression and further inhibiting the MAPK signaling pathway.
Cancer cells secrete various factors to remodel the TME, which regulates immune cells, thereby aiding cancer cell growth.34 Our study revealed a potential positive correlation between FAM198B expression and the abundance of various types of immune cells in GC, suggesting that elevated FAM198B expression may improve the presentation of tumor antigens and promote immune cell infiltration in TME of GC. In particular, CD4+ T cells and macrophages exhibited the strongest associations with FAM198B. Further analysis of immune cell markers revealed significant correlations between FAM198B and Treg cells, M2 macrophages, and TAM subtype cells. As a subtype of CD4+ T cells, Treg cells act as natural barriers to antitumor immunity.35 M2 macrophages are known to facilitate tumor growth and metastasis and are associated with a poor prognosis in cancer patients.36 Zheng5 confirmed that FAM198B can induce the polarization of macrophages associated with colorectal cancer toward the M2 phenotype. Additionally, M2 macrophages are generally considered as TAMs.37 Correlation analysis involving immune checkpoints also revealed associations between FAM198B expression and immunosuppressive checkpoints that weaken antitumor immunity, particularly HAVCR2 and PDCD1LG2. As a negative regulator of antitumor immunity, HAVCR2 has been reported to be positively correlated with poor prognosis in patients with GC.38 PDCD1LG2 functions as a ligand for the PD-1 receptor, which mediates immunosuppressive effects.39 In summary, we speculated that FAM198B might promote the remodeling of TME towards immunosuppression through the following aspects: 1. Recruit immunosuppressive immune cells (such as Tregs); 2. Regulate the function of immune cells (such as promoting the differentiation of macrophages into M2 type); 3. Promote expression of immune checkpoints (such as HAVCR2 and PDCD1LG2); 4. Promote stromal cells to secrete ECM components to help tumor cells survive; 5. Activate some signaling pathways (such as TGF-β).
Overall, this study demonstrated for the first time the regulatory role of quercetin on FAM198B of GC cells and the regulatory role of FAM198B on the EMT and MAPK pathway of GC cells. The results of this study revealed a new mechanism by which quercetin and FAM198B regulate GC progression and highlight the potential of two novel GC therapeutics methods, including quercetin and targeting FAM198B.
However, this study also has certain limitations and shortcomings. First, our exploration of the mechanism of FAM198B affecting the progression of GC was only verified by RNA-seq and signaling pathways, and further studies are needed to explore the downstream of FAM198B and the transcriptional regulation molecular mechanism in the future. Second, this study used only in vitro experiments, which included only GC cell models and lacked other components in the TME, such as the ECM, stromal cells, immune cells, and vascular network. Future in vivo studies or tumor-immune cell co-culture systems may reveal the regulatory effects of FAM198B and quercetin on TME of GC. In addition, We only confirmed the regulatory impact of quercetin on FAM198B using a database and Western blot, but whether quercetin directly or indirectly regulates FAM198B needs more preclinical studies to confirm. Finally, the efficacy and safety of quercetin and targeting FAM198B therapy need to be verified in clinical studies in the future.
Conclusion
Our research demonstrated that quercetin inhibits GC cell proliferation, migration, invasion, and EMT by inhibiting the FAM198B/MAPK signaling pathway. This study highlighted the potential of quercetin in treating GC, which may show higher benefits in GC patients with high FAM198B expression if used in clinical studies. Future studies should be conducted in more GC cell lines, animal models, and clinical cohorts to verify the safety and efficacy of quercetin or targeting FAM198B in treating GC.
Abbreviation
Area under the curve, AUC; Bladder urothelial carcinoma, BLCA; breast invasive carcinoma, BRCA; cell counting kit-8 assay, CCK8; cholangiocarcinoma, CHOL; confidence interval, CI; dendritic cell, DC; extracellular matrix, ECM; epithelial-mesenchymal transition, EMT; family with sequence similarity 198 member B, FAM198B; false discovery rate, FDR; first progression, FP; Golgi-associated kinase 1B, GASK1B; gastric cancer, GC; gene ontology, GO; gene ontology biological process, GOBP; gene ontology cellular component, GOCC; gene ontology molecular function, GOMF; Gene set enrichment analysis, GSEA; Genotype-Tissue Expression, GTEx; hazard ratio, HR; neck squamous cell carcinoma, HNSC; half maximal inhibitory concentration, IC50; immunohistochemical, IHC; Kyoto encyclopedia of genes and genomes, KEGG; kidney chromophobe, KICH; kidney renal clear cell carcinoma, KIRC; kidney renal papillary cell carcinoma, KIRP; Liver hepatocellular carcinoma, LIHC; lung squamous cell carcinoma, LUSC; overall surviva, OS; principal component analysis, PCA; postprogression survival, PPS; prostate adenocarcinoma, PRAD; rectum adenocarcinoma, READ; quantitative Real-Time reverse transcription PCR, qRT-PCR; RNA sequencing, RNA-seq; receiver operating characteristic curve, ROC; small interfering RNA, siRNA; non-targeted control siRNA, si-NC; stomach adenocarcinoma, STAD; tumor-associated macrophage, TAM; the Cancer Genome Atlas, TCGA; follicular helper T-cell, Tfh; T helper cell, Th; tumor microenvironment, TME; regulatory T, Treg; uterine corpus endometrial carcinoma, UCEC; University of California Santa Cruz, UCSC.
Data Sharing Statement
The datasets used and/or analyzed during the current study are available from the corresponding author upon reasonable request.
Ethical Approval
This study was approved by the Ethics Committee of the Second Hospital of Lanzhou University (2024A-035). The studies were conducted following local legislation and institutional requirements and under the tenets of the Helsinki Declaration. The participants provided their written informed consent to participate in this study.
Author Contributions
All authors made a significant contribution to the work reported, whether that is in the conception, study design, execution, acquisition of data, analysis and interpretation, or in all these areas; took part in drafting, revising or critically reviewing the article; gave final approval of the version to be published; have agreed on the journal to which the article has been submitted; and agree to be accountable for all aspects of the work.
Funding
This study was supported by the Gansu Province University Industrial Support Plan (2023CYZC-05), Cuiying Technology Innovation Project of Lanzhou University Second Hospital (CY2022-MS-B04), Doctoral Students Training Research Fund of Lanzhou University Second Hospital (YJS-BD-32), and Natural Science Foundation of Gansu Province (23JRRA0992).
Disclosure
All authors have no conflict of interest to declare.
References
1. Bray F, Laversanne M, Sung H, et al. Global cancer statistics 2022: GLOBOCAN estimates of incidence and mortality worldwide for 36 cancers in 185 countries. CA Cancer J Clin. 2024;74(3):229–263. doi:10.3322/caac.21834
2. Orditura M, Galizia G, Sforza V, et al. Treatment of gastric cancer. World J Gastroenterol. 2014;20(7):1635–1649. doi:10.3748/wjg.v20.i7.1635
3. Hsu CY, Chang GC, Chen YJ, et al. FAM198B is associated with prolonged survival and inhibits metastasis in lung adenocarcinoma via blockage of ERK-mediated MMP-1 expression. Clin Cancer Res. 2018;24(4):916–926. doi:10.1158/1078-0432.Ccr-17-1347
4. Guo Q, Wu Y, Guo X, et al. The RNA-binding protein CELF2 inhibits ovarian cancer progression by stabilizing FAM198B. Mol Ther Nucleic Acids. 2021;23:169–184. doi:10.1016/j.omtn.2020.10.011
5. Zheng X, Chen J, Nan T, et al. FAM198B promotes colorectal cancer progression by regulating the polarization of tumor-associated macrophages via the SMAD2 signaling pathway. Bioengineered. 2022;13(5):12435–12445. doi:10.1080/21655979.2022.2075300
6. Chen B, Diallo MT, Ma Y, et al. Fam198b as a novel biomarker for gastric cancer and a potential therapeutic target to prevent tumor cell proliferation dysregulation. Transl Oncol. 2024;39:101824. doi:10.1016/j.tranon.2023.101824
7. Sheikhnia F, Fazilat A, Rashidi V, et al. Exploring the therapeutic potential of quercetin in cancer treatment: targeting long non-coding RNAs. Pathol Res Pract. 2024;260:155374. doi:10.1016/j.prp.2024.155374
8. Wang K, Liu R, Li J, et al. Quercetin induces protective autophagy in gastric cancer cells: involvement of Akt-mTOR- and hypoxia-induced factor 1α-mediated signaling. Autophagy. 2011;7(9):966–978. doi:10.4161/auto.7.9.15863
9. Li H, Chen C. Quercetin has antimetastatic effects on gastric cancer cells via the interruption of uPA/uPAR function by modulating NF-κb, PKC-δ, ERK1/2, and AMPKα. Integr Cancer Ther. 2018;17(2):511–523. doi:10.1177/1534735417696702
10. Kim MC, Lee HJ, Lim B, et al. Quercetin induces apoptosis by inhibiting MAPKs and TRPM7 channels in AGS cells. Int J Mol Med. 2014;33(6):1657–1663. doi:10.3892/ijmm.2014.1704
11. Li T, Fan J, Wang B, et al. TIMER: a web server for comprehensive analysis of tumor-infiltrating immune cells. Cancer Res. 2017;77(21):e108–e110. doi:10.1158/0008-5472.Can-17-0307
12. Li B, Severson E, Pignon JC, et al. Comprehensive analyses of tumor immunity: implications for cancer immunotherapy. Genome Biol. 2016;17(1):174. doi:10.1186/s13059-016-1028-7
13. Tang Z, Li C, Kang B, et al. GEPIA: a web server for cancer and normal gene expression profiling and interactive analyses. Nucleic Acids Res. 2017;45(W1):W98–w102. doi:10.1093/nar/gkx247
14. Goldman MJ, Craft B, Hastie M, et al. Visualizing and interpreting cancer genomics data via the Xena platform. Nat Biotechnol. 2020;38(6):675–678. doi:10.1038/s41587-020-0546-8
15. Li H, Yu B, Li J, et al. Characterization of differentially expressed genes involved in pathways associated with gastric cancer. PLoS One. 2015;10(4):e0125013. doi:10.1371/journal.pone.0125013
16. Wang G, Hu N, Yang HH, et al. Comparison of global gene expression of gastric cardia and noncardia cancers from a high-risk population in China. PLoS One. 2013;8(5):e63826. doi:10.1371/journal.pone.0063826
17. Oh SC, Sohn BH, Cheong JH, et al. Clinical and genomic landscape of gastric cancer with a mesenchymal phenotype. Nat Commun. 2018;9(1):1777. doi:10.1038/s41467-018-04179-8
18. Li L, Zhu Z, Zhao Y, et al. FN1, SPARC, and SERPINE1 are highly expressed and significantly related to a poor prognosis of gastric adenocarcinoma revealed by microarray and bioinformatics. Sci Rep. 2019;9(1):7827. doi:10.1038/s41598-019-43924-x
19. He J, Jin Y, Chen Y, et al. Downregulation of ALDOB is associated with poor prognosis of patients with gastric cancer. Onco Targets Ther. 2016;9:6099–6109. doi:10.2147/ott.S110203
20. Clough E, Barrett T, Wilhite SE, et al. NCBI GEO: archive for gene expression and epigenomics data sets: 23-year update. Nucleic Acids Res. 2024;52(D1):D138–d144. doi:10.1093/nar/gkad965
21. Győrffy B. Transcriptome-level discovery of survival-associated biomarkers and therapy targets in non-small-cell lung cancer. Br J Pharmacol. 2024;181(3):362–374. doi:10.1111/bph.16257
22. Subramanian A, Tamayo P, Mootha VK, et al. Gene set enrichment analysis: a knowledge-based approach for interpreting genome-wide expression profiles. Proc Natl Acad Sci U S A. 2005;102(43):15545–15550. doi:10.1073/pnas.0506580102
23. Vasaikar SV, Straub P, Wang J, et al. LinkedOmics: analyzing multi-omics data within and across 32 cancer types. Nucleic Acids Res. 2018;46(D1):D956–d963. doi:10.1093/nar/gkx1090
24. Yu G, Wang LG, Han Y, et al. clusterProfiler: an R package for comparing biological themes among gene clusters. Omics. 2012;16(5):284–287. doi:10.1089/omi.2011.0118
25. Hänzelmann S, Castelo R, Guinney J. GSVA: gene set variation analysis for microarray and RNA-seq data. BMC Bioinformatics. 2013;14:7. doi:10.1186/1471-2105-14-7
26. Ding L, Dang S, Sun M, et al. Quercetin induces ferroptosis in gastric cancer cells by targeting SLC1A5 and regulating the p-Camk2/p-DRP1 and NRF2/GPX4 Axes. Free Radic Biol Med. 2024;213:150–163. doi:10.1016/j.freeradbiomed.2024.01.002
27. Huang Y, Hong W, Wei X. The molecular mechanisms and therapeutic strategies of EMT in tumor progression and metastasis. J Hematol Oncol. 2022;15(1):129. doi:10.1186/s13045-022-01347-8
28. Deng H, Zhang J, Wu F, et al. Current status of lymphangiogenesis: molecular mechanism, immune tolerance, and application prospect. Cancers. 2023;15(4):1169. doi:10.3390/cancers15041169
29. Poltavets V, Kochetkova M, Pitson SM, et al. The role of the extracellular matrix and its molecular and cellular regulators in cancer cell plasticity. Front Oncol. 2018;8:431. doi:10.3389/fonc.2018.00431
30. Yuan Z, Li Y, Zhang S, et al. Extracellular matrix remodeling in tumor progression and immune escape: from mechanisms to treatments. Mol Cancer. 2023;22(1):48. doi:10.1186/s12943-023-01744-8
31. Lecker LSM, Berlato C, Maniati E, et al. TGFBI production by macrophages contributes to an immunosuppressive microenvironment in ovarian cancer. Cancer Res. 2021;81(22):5706–5719. doi:10.1158/0008-5472.Can-21-0536
32. Lee S, Rauch J, Kolch W. Targeting MAPK signaling in cancer: mechanisms of drug resistance and sensitivity. Int J Mol Sci. 2020;21(3). doi:10.3390/ijms21031102
33. Reyes-Farias M, Carrasco-Pozo C. The anti-cancer effect of quercetin: molecular implications in cancer metabolism. Int J Mol Sci. 2019;20(13):3177. doi:10.3390/ijms20133177
34. Hinshaw DC, Shevde LA. The tumor microenvironment innately modulates cancer progression. Cancer Res. 2019;79(18):4557–4566. doi:10.1158/0008-5472.Can-18-3962
35. Savage PA, Klawon DEJ, Miller CH. Regulatory T cell development. Annu Rev Immunol. 2020;38:421–453. doi:10.1146/annurev-immunol-100219-020937
36. Yunna C, Mengru H, Lei W, et al. Macrophage M1/M2 polarization. Eur J Pharmacol. 2020;877:173090. doi:10.1016/j.ejphar.2020.173090
37. Boutilier AJ, Elsawa SF. Macrophage polarization states in the tumor microenvironment. Int J Mol Sci. 2021;22(13):6995. doi:10.3390/ijms22136995
38. Sauer N, Janicka N, Szlasa W, et al. TIM-3 as a promising target for cancer immunotherapy in a wide range of tumors. Cancer Immunol Immunother. 2023;72(11):3405–3425. doi:10.1007/s00262-023-03516-1
39. Wang Y, Du J, Gao Z, et al. Evolving landscape of PD-L2: bring new light to checkpoint immunotherapy. Br J Cancer. 2023;128(7):1196–1207. doi:10.1038/s41416-022-02084-y
 © 2025 The Author(s). This work is published and licensed by Dove Medical Press Limited. The
full terms of this license are available at https://www.dovepress.com/terms.php
and incorporate the Creative Commons Attribution
- Non Commercial (unported, 4.0) License.
By accessing the work you hereby accept the Terms. Non-commercial uses of the work are permitted
without any further permission from Dove Medical Press Limited, provided the work is properly
attributed. For permission for commercial use of this work, please see paragraphs 4.2 and 5 of our Terms.
© 2025 The Author(s). This work is published and licensed by Dove Medical Press Limited. The
full terms of this license are available at https://www.dovepress.com/terms.php
and incorporate the Creative Commons Attribution
- Non Commercial (unported, 4.0) License.
By accessing the work you hereby accept the Terms. Non-commercial uses of the work are permitted
without any further permission from Dove Medical Press Limited, provided the work is properly
attributed. For permission for commercial use of this work, please see paragraphs 4.2 and 5 of our Terms.