")
Back to Journals » Risk Management and Healthcare Policy » Volume 18
Research on Dynamic Outpatient Respiratory Nosocomial Infection Control Methods Through Multi-Data Prediction
Authors Wang Y, Ma W, Yang Y, Zhao H, Zhao Z, Zhao X
Received 26 November 2024
Accepted for publication 28 March 2025
Published 15 April 2025 Volume 2025:18 Pages 1323—1332
DOI https://doi.org/10.2147/RMHP.S508760
Checked for plagiarism Yes
Review by Single anonymous peer review
Peer reviewer comments 2
Editor who approved publication: Dr Jongwha Chang
Yuncong Wang, Wenhui Ma, Yang Yang, Huijie Zhao, Zhongjing Zhao, Xia Zhao
Hospital Infection Management Division, Xuanwu Hospital Capital Medical University, Beijing, People’s Republic of China
Correspondence: Yuncong Wang, Hospital Infection Management Division, Xuanwu Hospital Capital Medical University, No. 45 ChangChun Street, Xicheng District, Beijing, 100053, People’s Republic of China, Tel +86 10 83198692, Email [email protected]
Objective: This study aimed to develop a dynamic prevention and control method for fluctuating respiratory nosocomial infections in outpatients.
Methods: Six sets of surveillance data such as influenza-like case counts and their predicted results were used in the autoregressive integrated moving average model (ARIMA) to forecast the onset and end time points of the epidemic peak. A Delphi process was then used to build consensus on hierarchical infection control measures for epidemic peaks and plateaus. The data, predicted results, and hierarchical infection control measures can assist dynamic prevention and control of respiratory nosocomial infections with changes in the infection risk.
Results: The ARIMA model produced exact estimates. The mean absolute percentage errors (MAPE) of the data selected to estimate the time range of the high-risk and low-risk periods were 15.8%, 9.2%, 15.4%, 16.8%, 25.6%. The hierarchical infection control measures included three categories and nine key points. A risk-period judgment matrix was also designed to connect the surveillance data and the hierarchical infection control measures.
Conclusion: Through a mathematical model, dynamic prevention and control of respiratory tract infections in outpatients was constructed based on the daily medical service monitoring data of hospitals. It is foreseeable that when applied in medical institutions, this method will provide accurate and low-cost infection prevention and control outcomes.
Keywords: respiratory nosocomial infection, ARIMA, outpatient, dynamic infection control
Background
In the long struggle between human beings and diseases, respiratory infectious diseases have had the biggest impact on the development of human society and produced a serious medical burden and economic loss.1,2 Respiratory infectious diseases, which have a higher transmission efficiency than other types of infectious diseases, can cause hospital-acquired infection outbreaks3,4 and pose a severe threat to the safety of healthcare workers and patients. For example, as of May 2022, confirmed COVID-19 infection exceeded 519 million cases worldwide, causing an estimated economic loss of 77–2700 billion US dollars,5 and the indirect economic loss and negative impact are even more immeasurable.6 There was a certain regularity to respiratory epidemics, particularly throughout the fall and winter months. However, because of China’s poor vaccination coverage, the population’s recurring respiratory infectious disease epidemic has not been adequately managed, leading to recurring respiratory infection epidemics in hospital emergency rooms and outpatient clinics.7,8
Outpatient and emergency procedures involve several aerosol-generating medical examinations, such as sputum aspiration, endotracheal intubation, and respiratory tract endoscopy,9 which increase the risk of respiratory infection in outpatients and emergency departments. In addition, with the continuous promotion of health policy reforms, patients visiting hospitals at different levels have different risks of respiratory infection. Tertiary hospitals are more likely to receive critically ill patients and are more susceptible to respiratory infections.10,11
The weakness of infection prevention and control measures is a direct cause of hospital infection outbreaks.12 With the awareness of the key role of infection prevention in outpatients and emergency departments, there are still great obstacles to promoting infection control management.13 The epidemic law, epidemic peak, and epidemic cycle can all be estimated and computed using mathematical models. Predicting the potential number of new infections or deaths in a future time frame is the most significant and often used methodology for estimating the future trend of epidemics. This forecast is increasingly being used as a foundation for modifying nosocomial infection prevention and control strategies. The autoregressive integrated moving average (ARIMA) model is currently the most widely used model for predicting epidemic trends, particularly seasonal outbreaks of infectious diseases.14 In Canada, France, India, South Korea, and Italy, the ARIMA model provides accurate short-term (10-day) forecasts of the number of daily confirmed cases of COVID-19.15,16
Our research team has previously published a series of research results on methods and tools for the quantitative risk assessment of respiratory infections in outpatients and emergency departments.17,18 In this study, we used the ARIMA model, multiple types of surveillance data on outpatient medical services, and expert consultation to perform an accurate infection risk estimation and provide predictive recommendations for respiratory infection control in outpatients.
Data and Methods
Research Design
This study designed three steps to achieve precise control according to the surveillance data and model-predicted results. First, six types of outpatient medical service surveillance data were collected for 40 consecutive weeks and the ARIMA model used to perform continuous prediction for each type of data. Second, a multidisciplinary expert consultation was conducted to reach consensus on hierarchical infection control measures for respiratory nosocomial infections during peak and low epidemics. Third, the trend characteristics of these surveillance data were analyzed at the onset and end of the peak of the respiratory infection epidemic, and a risk period judgment matrix was constructed to estimate epidemic intensity one week in advance to select matched infection control measures.
Data
Six sets of data were collected for ARIMA model fitting: 1, surveillance data of influenza-like case counts (ILI); 2, the search frequency of respiratory tract infection keywords in the Baidu search engine (BS);19 3, outpatient visits to the fever clinic (FC); 4, outpatient visits to the pediatric outpatient department (PO); 5, prescribed amounts of antiviral drugs for influenza (ADI); and 6, cases positive for respiratory pathogens (RP) (including mycoplasma, parainfluenza virus, influenza virus, COVID-19, respiratory syncytial virus, Streptococcus pneumoniae, and Klebsiella pneumoniae). Influenza-like illness (ILI) was defined as an acute respiratory infection with fever >38 °C and cough within the last 10 days.20 Positive cases of respiratory pathogens were the sum of the types of test items provided by the clinical laboratory. Because Google Trends has some limitations in usage in mainland China, data from the Baidu Index were used for risk forecasting.21 The Baidu Index data were downloaded from the database (https://index.baidu.com/v2/index.html#/), The time span of these datasets was 92 weeks, from 27/03/2022 to 31/12/2023.
All data were collected from the database of the outpatient service system, the physician order system, and the disease control and prevention system of Xuanwu Hospital and were approved by the ethics committee of Xuanwu Hospital (ethics approval number: [2024] 003–001 Xuanwu Hospital Capital Medical University approval date: April 07, 2024). As the data used in this study were all derived from the number of patients admitted to the outpatient and emergency departments, the number of samples with positive pathogen tests, and the number of orders for respiratory infectious disease-related drugs, which were enumeration data and did not include any personal patient information, the ethics committee waived the requirement for informed consent from the participants. The time span of these datasets was 92 weeks, from 27/03/2022 to 31/12/2023.
Xuanwu Hospital, located in Beijing, which possesses the typical environment and epidemic features of respiratory infectious illnesses in northern China, provided all of the data used in this study. There are four distinct seasons in Beijing. The temperature steadily increases during the spring (March to May), and there is a significant temperature differential between day and night. In May, the temperature can rise to 20–25 °C, with an average of 5–20 °C. The summer months of June to August are hot and muggy, with average highs of 25 to 30 °Cand highs of over 35 °C in July. The average temperature in the fall (September to November) was between 8 and 20 °C, with a possible drop to 5 to 10 °C in November. The winter months of December to February are dry and chilly, with average temperatures between −8 and 0 °C. January is the coldest month, and the lowest temperature can drop as low as −10 °C. Patients with respiratory tract infections are generally stable and maintain a low epidemic level at other times, but the epidemic of respiratory infectious diseases exhibits a fairly clear periodicity, peaking in the fall and winter.
Methods
The Auto Regressive Integrated Moving Average Model
In the first step of our research, risk prediction was mainly implemented using the autoregressive integrated moving average model (ARIMA) developed by Box and Jenkins. This model is used to predict future trends and directions based on past data or samples and plays an important role in the stock and insurance markets, as well as in the field of public health research.22
The model has the following form:

and is also simply described as:
The autoregressive coefficient polynomial is calculated as:

The moving average coefficient polynomial is calculated as:

Model fitting depends on three parameters, p, d, and q, and can be summarized as ARIMA(p, d, q). p specifies the lag observations of the model, d determines the number of times the original observations are distinguished, and q determines the size of the moving-average window. Model fitting was done by the “forecast” package in R language.
Rolling forecasting was performed using the first 40 weekly datasets as training data to estimate the data for the 41st week and then moved to the next step to estimate the data for the 42nd week. The Mean Absolute Percentage Error (MAPE), which converts absolute errors into a percentage of actual numbers, was used to evaluate the model fitting results by comparing the continuous forecast values with actual values.
Construction of Hierarchical Prevention and Control Measures
The second step involved selecting an expert panel, with the following selection standards: associate senior professional title or above; more than 5 years of clinical medical treatment or outpatient management experience; more than 3 medical management papers published in the last five years; holding a position in a medical, nursing, or hospital infection management-related association, and high enthusiasm for participation. The panel consisted of 10 clinical physicians, 3 outpatient nurses, 5 experts on nosocomial infection control, 3 experts on outpatient management, and 2 experts on nursing management. The aim of the expert panel was to reach consensus on hierarchical infection control measures for respiratory nosocomial infections in peak and low epidemics from a pool of selected measures. The majority of the expert recruitment was done at Capital Medical University’s Xuanwu Hospital. Being a sizable general hospital with strong nosocomial infection prevention and control capabilities, Xuanwu Hospital is able to hire more top-notch multidisciplinary specialists. The expert committee was also extended an invitation to two specialists in hospital administration and nosocomial infection prevention and control from the National Medical Center for Infectious Diseases. The approach to expert recruitment was through prior work contacts.
Two experts searched electronic databases, such as PubMed, NCBI(Chinese), and CNKI(Chinese), to set a pool of recommendations for infection control measures in outpatients. The search terms including: “respiratory infection”, “COVID-19”, “infection control”, “outpatient”, “disinfection”, and “personal protective equipment”. Guidelines and standards from the National Health Commission of the People’s Republic of China, the Standardization Administration of China, and the Centers for Disease Control and Prevention of the USA were also searched for suggestions on infection control measures and interventions.
The inclusion criteria for articles in the search were as follows: 1) published between 1/1/2010 and 31/12/2023; 2) reported on infection control measures against respiratory infection, and 3) full-text availability. The exclusion criteria for articles were as follows: 1) articles without abstracts or unavailable for download; 2) conference articles, letters, case reports, and overviews (not systematic reviews); and 3) articles with no explicit infection control recommendations or with unreliable data analysis.
Construction of Early Warning Criteria
In the third step, early warning standards were constructed by addressing two problems: how to determine the threshold for the historical average level of these data; and how to use diverse data to determine the onset and end time points of the epidemic peak. The methods of the World Health Organization (WHO) and the US Centers for Disease Control and Prevention were used as references to set the threshold to address the first problem.20 “A+σ” was used as the threshold for the onset and endpoints of the epidemic peak. For the second problem, the time axis of all data was aligned and then, by comparing the sensitivity of each data point at the onset and end time points of the epidemic peak, as well as the characteristics of the data themselves, a risk-period judgment matrix was designed. The threshold and judgment matrix had the ability to analyze and predict the epidemic peak of respiratory nosocomial infections.
Results
Description Analysis of Datasets
All data were obtained from the system servers of Xuanwu Hospital Information Center, and use of the data was approved by the Ethics Committee of Xuanwu Hospital. The basic statistical descriptions and epidemic period thresholds for the data are presented in Table 1.
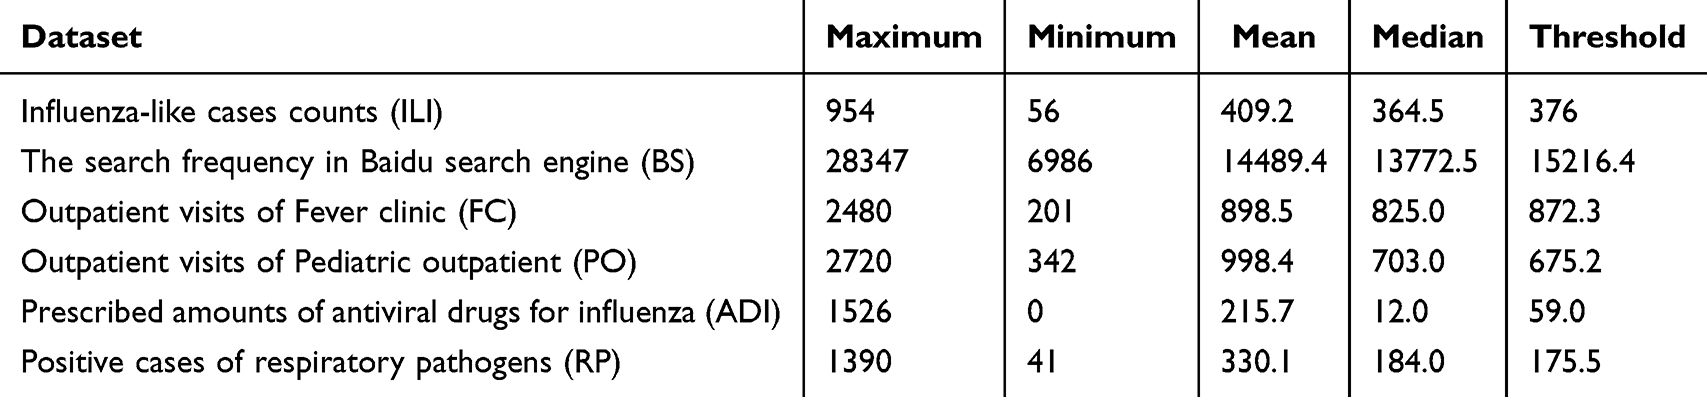 |
Table 1 The Description of the Surveillance Data |
Forecasting Results of the ARIMA Model
The best models for the ILI, BS, FC, PO, ADI, and RP data were ARIMA(1,0,1), ARIMA(1,0,5), ARIMA(1,0,3), ARIMA(1,0,3), ARIMA(1,0,3), and ARIMA(1,0,4), respectively. Rolling forecasting is shown in Figure 1. The MAPE between rolling forecasting and actual data of ILI, BS, FC, PO, and RP were 15.8%, 9.2%, 15.4%, 16.8%, and 25.6%, respectively. The MAPE of ADI was >100% because too many ADI data were 0 or <5 (over 26 weeks), and the forecasting results were all above the actual data, generating too many MAPE results >1. The tendencies of the actual and forecast data for all the datasets above are shown in Figure 1.
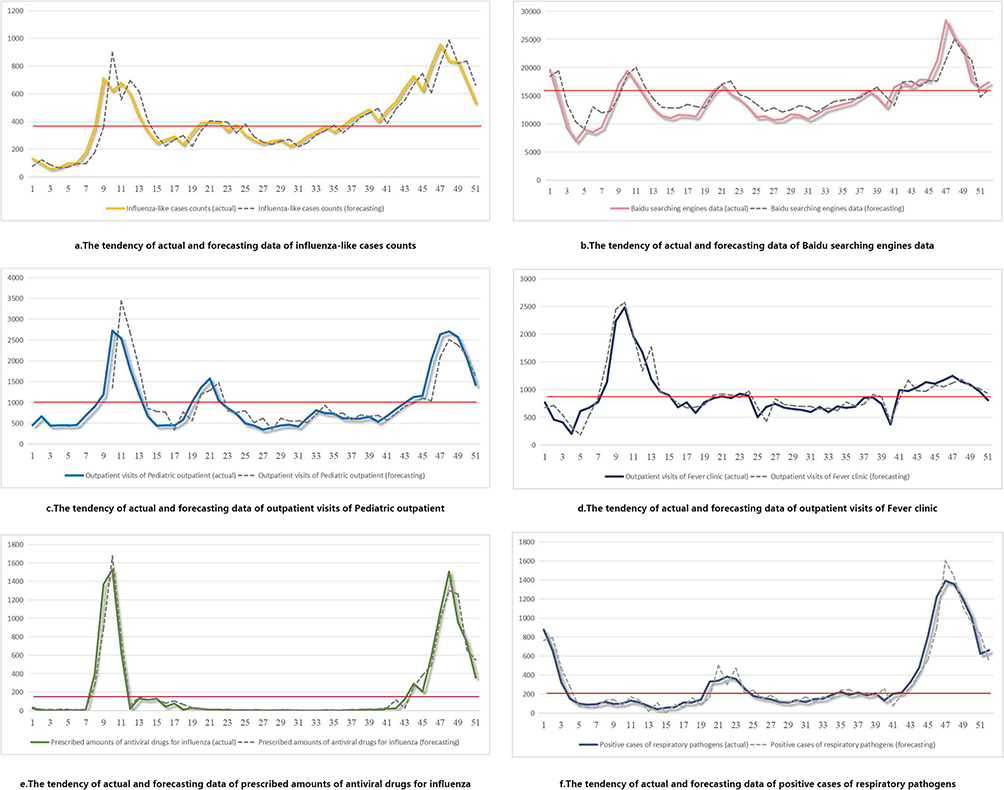 |
Figure 1 (a) Yellow line: actual influenza-like cases counts; Grey lines: forecasted influenza-like cases counts. (b) Pink line: actual Baidu searching engines data; Grey lines: forecasted Baidu searching engines data. (c) Blue lines: actual outpatient visits of Pediatric outpatient; Grey lines: forecasted outpatient visits of Pediatric outpatient. (d) Dark blue lines: actual outpatient visits of Fever clinic; Grey lines: forecasted outpatient visits of Fever clinic. (e) Green lines: actual prescribed amounts of antiviral drugs for influenza; Grey lines: forecasted prescribed amounts of antiviral drugs for influenza. (f) Purple lines: actual positive cases of respiratory pathogens; Grey lines: forecasted positive cases of respiratory pathogens. |
Early Warning Criteria
Through expert consultation and a comparison between the real and predicted values of the aforementioned data, a risk-period judgment matrix was designed to estimate the time range of the high-risk and low-risk periods (Table 2). Given the frequent occurrence of 0 or a large number of values below 5 in the ADI data, experts recommend that the predicted value of the ADI data not be used to estimate the start time of the epidemic peak.
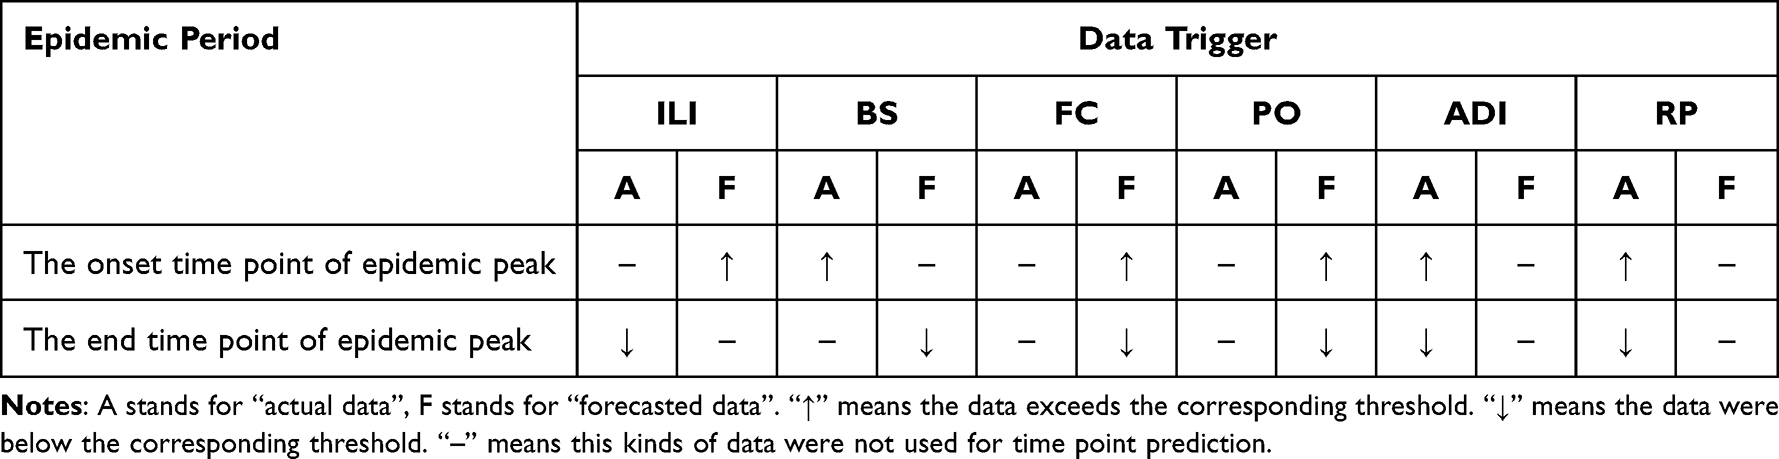 |
Table 2 The Risk Period Judgment Matrix |
Hierarchical Prevention and Control Measures Database
34 research papers, 8 standards, and 10 guidelines were among the 52 pertinent materials gathered for this study. 3 conference papers, 6 papers without explicit recommendations for prevention and control measures, 1 standard with low correlation, 1 guideline, and 7 papers whose conclusions could not be used as prevention and control measures were excluded based on the corresponding inclusion and exclusion criteria. 12 articles, 7 standards, and 9 recommendations were ultimately included (Supplementary Table). The hierarchical prevention and control measures database contained infection control measures for cleaning and disinfection, personal protection, isolation, and the process of medical care in the high-risk and low-risk periods (Table 3).
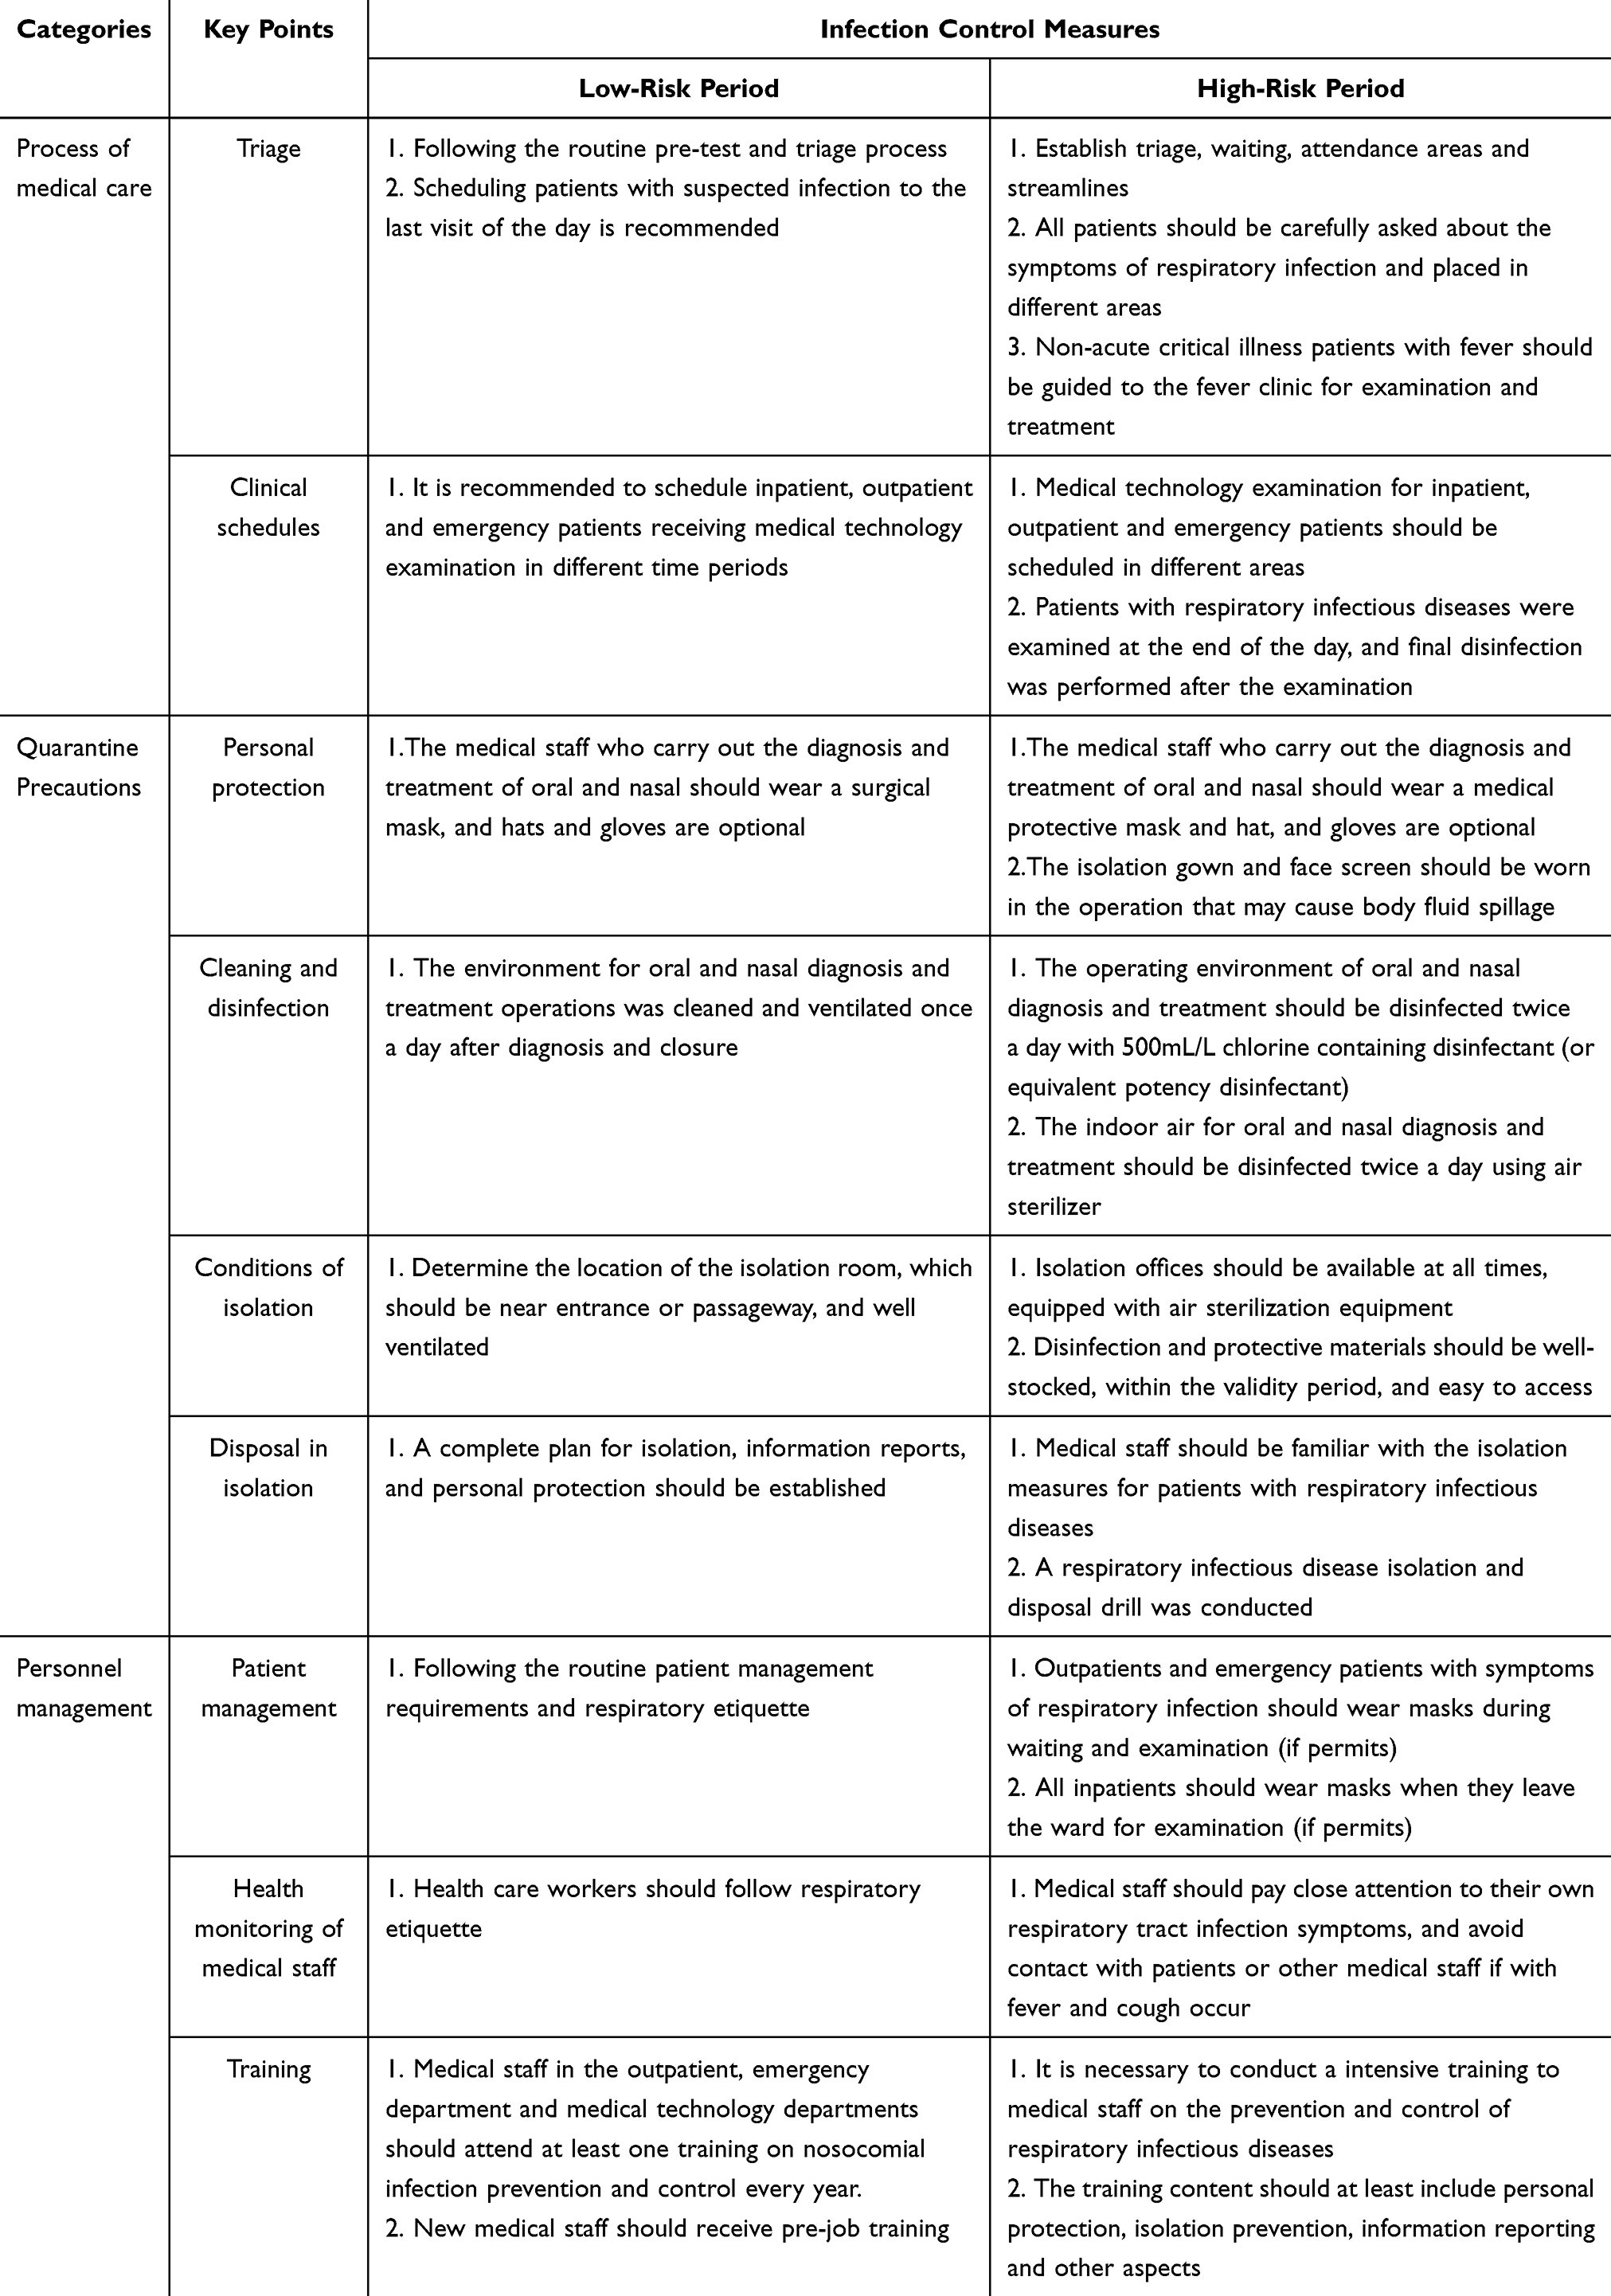 |
Table 3 The Hierarchical Prevention and Control Measures Database |
Discussion
Respiratory tract nosocomial infections are the most common nosocomial infection worldwide.14,23 The average incidence of adult inpatients worldwide is approximately 1%, and the crude mortality rate is approximately 13–30%, which can cause a health economic burden of approximately 3 billion US dollars every year.24 Respiratory tract infection can significantly prolong the hospitalization time, increase the cost of medical services, increase the mortality rate of patients, and the long-term physiological effects on heart, lung, endocrine and blood vessels similar to COVID-19.25–27
Respiratory nosocomial infections in outpatients and emergency departments have received insufficient attention. This is because infection prevention and control resources in outpatient and emergency areas are very limited. The prevention and control of respiratory tract infections in outpatient and emergency departments was a relatively large task, involving epidemiological features, social communication, personnel and process management, and other aspects, based on the actual situation of nosocomial infection prevention and control. There are many publications and guidelines accessible today as well, but we still facing a big problem, That is, in order to guarantee that the prevention and control measures have the effect in a suitable period of time, particularly during the epidemic period of respiratory infectious diseases, and to effectively control the cost, all of the measures provided in the literature or guidelines must be chosen by experts with rich experience. Because such excellent specialists are extremely uncommon and cannot be quickly developed in a short amount of time, this presents a significant challenge for primary hospitals and smaller hospitals.
The study’s dynamic preventive and control approach integrates dynamic data-based risk assessment with respiratory tract infection control measures in emergency rooms and outpatient clinics. Different from normal surveillance utilizing available data, this risk assessment also employs mathematical models for sophisticated prediction, we also evaluated and categorized the current state of respiratory tract infection risks in emergency rooms and outpatient clinics based on various data trends. The infection control measures were derived from the most effective preventive and control approaches. In order to break the current model of respiratory tract infection prevention and control in outpatient and emergency departments, this set of method uses dynamic mathematical model prediction technology. This allows the prevention and control measures outlined in papers and guidelines to be applied accurately and flexibly. It’s important to note that this study’s dynamic prevention and control approach also had some impact on preventing and managing pediatric respiratory tract infections. According to the previous study,28 the highest positive proportion of pathogens in children’s respiratory samples occurred during the respiratory epidemic period, making it a crucial early warning indicator during that time. Though the precise threshold and scope have not been established, the percentage of children with respiratory infections among outpatient and emergency patients can be utilized as representative data for infection risk early warning. Artificial intelligence technology has steadily advanced in recent years. It will be feasible to achieve effective and automated risk research and judgment if the judgment matrix can be optimized and modified. It will successfully address the preventive and control conundrum faced by small and primary hospitals, in conjunction with standardized prevention and control procedures, and it will improve the standardization of prevention and control quality.
The ARIMA model in our study showed clear advantages in predicting the number of patients with respiratory infections. Continuous surveillance data on infectious respiratory diseases, collected at the district or country level, can be used to predict likely peaks of infection 1–2 weeks in advance with high accuracy.29–31 The difference was that the surveillance data used in this study were generated from outpatients and emergency departments, which can better adapt to the actual infection risk in different medical institutions compared to the regional or national surveillance data in other studies. In addition, with the model prediction of the Baidu search engine, the intensity of community transmission outside medical institutions can be considered in management decisions.32 In the data selection process, The primary reason this study only included antiviral medications in its selection of prescription orders is that, among outpatient and emergency patients, viruses are the most common pathogens that cause respiratory tract infections, with bacteria accounting for a very little portion of these cases. Second, a significant number of antibiotics are used to treat infections in other regions out of the respiratory tract. According to the two aforementioned criteria, the shift in the quantity of antibiotic orders cannot be attributed to a rise or fall in the risk of respiratory tract infections in emergency rooms and outpatient clinics. Antibacterial medications were therefore not used in this investigation as indicators of respiratory tract infections in emergency rooms and outpatient clinics. Another concern is that different regions and hospitals should consult previous data, We strongly recommend the most indicative data for the risk of respiratory infections in outpatient and emergency departments should be used for risk prediction, not just the seven pathogens listed in this study.
In the process of constructing the risk-period judgment matrix, various data were reviewed and compared. After aligning the date coordinates, the sequence and predictive sensitivity of each dataset at the boundary time points of the high-risk and low-risk periods were comprehensively analyzed, and a risk period judgment matrix was constructed. Each dataset was divided into true and predicted values in a matrix. Different combinations of trigger points for each dataset were used to determine the risk period. For example, we found that the number of oseltamivir physician orders significantly increased in the high-risk period, whereas it was very small or even zero in the off-peak period. Such data characteristics cause the prediction accuracy of the ARIMA model to decrease during the off-peak period. Therefore, the study took advantage of the significantly elevated property during the peak periods and used only the true value of the number of orders as the trigger point. The number of positive cases of respiratory pathogens also had similar characteristics, and the sum of all types of pathogens was significantly different in the high-risk and low-risk periods, which could effectively indicate the risk of respiratory infection without considering the specific pathogens causing high risk. The pathogen composition ratio in the previous week can be used to identify the main pathogens during the peak period.
Infection prevention and control measures constructed by multidisciplinary experts included the selection of personal protection equipment, methods of environmental cleaning and disinfection, isolation, and medical process management. The prevention and control of respiratory infectious diseases frequently share similarities across countries and regions, and the majority of these methods have been incorporated into applicable guidelines and standards. As a result, throughout the literature screening, we mostly searched widely utilized databases, including American disease prevention and control, Chinese and Western industry standards, and Chinese industry standards. However, prevention and control strategies may differ differently throughout different parts of the world, and we advocate fine-tuning measures to reflect these variances.
This paper certainly has some shortcomings and limitations. We found the data types, prevention and control measure contents, and associated model parameters must be modified to reflect the real circumstances in various hospitals and regions, which improve the difficulty of use. However, if properly adjusted, the difficulty of daily prevention and control will be reduced and the accuracy of prevention and control will be improved. The types of data should be further enriched, and it is possible to obtain better risk analysis results. The judgement matrix was relatively simple, which can not yet complete complex risk assessment and judgment, and it is easy to be affected by abnormal fluctuations in a short time during the off-peak period.
Ethics
Our study complies with the Declaration of Helsinki.
Funding
This study was funded Supported by Beijing Qing Miao Talent Development Plan (QML20230816) from Beijing Hospitals Authority and Xuanwu Hospital Capital Medical University.
Disclosure
The authors report no conflicts of interest in this work.
References
1. Weber DJ, Rutala WA, Fischer WA, et al. Emerging infectious diseases: focus on infection control issues for novel coronaviruses (Severe acute respiratory syndrome-CoV and Middle East respiratory syndrome-CoV), hemorrhagic fever viruses (Lassa and Ebola), and highly pathogenic avian influenza viruses, A(H5N1) and A (H7N9). Am J Infect Control. 2016;44(5 Suppl):e91–e100. doi:10.1016/j.ajic.2015.11.018
2. Wei X, Li X, Cui J. Evolutionary perspectives on novel coronaviruses identified in pneumonia cases in China. Natl Sci Rev. 2020;7(2):239–242. doi:10.1093/nsr/nwaa009
3. Halle Julin C, Hayman Robertson A, Hungnes O, et al. Household transmission of SARS-CoV-2: a prospective longitudinal study showing higher viral load and increased transmissibility of the alpha variant compared to previous strains. Microorganisms. 2021;9(11):2371. doi:10.3390/microorganisms9112371
4. Jayaweera M, Perera H, Gunawardana B, Manatunge J. Transmission of COVID-19 virus by droplets and aerosols: a critical review on the unresolved dichotomy. Environ Res. 2020;188:109819. doi:10.1016/j.envres.2020.109819
5. Rezapour A, Souresrafil A, Mehdi Peighambari M, et al. Economic evaluation of programs against COVID-19: a systematic review. Int J Surg. 2021;85:10–18. doi:10.1016/j.ijsu.2020.11.015
6. Meyer BH, Prescott B, Simon Sheng X, et al. The impact of the COVID-19 pandemic on business expectations. Int J Forecast. 2022;38(2):529–544. doi:10.1016/j.ijforecast.2021.02.009
7. Members of the WHO Western Pacific Region Global Influenza Surveillance and Response System. Epidemiological and virological characteristics of seasonal influenza in the Western Pacific Region of the World Health Organization, 2011-2015. Western Pac Surveill Response. 2017;8(1):40–49. doi:10.5365/wpsar.2017.8.1.004
8. Sun G, Zhang L, Qiu Y, et al. Changes of influenza vaccination rate and associated influencing factors after the COVID-19 pandemic in Shanghai, China. Hum Vaccin Immunother. 2024;20(1):2287294. doi:10.1080/21645515.2023.2287294
9. Tran K, Cimon K, Severn M, et al. Aerosol generating procedures and risk of transmission of acute respiratory infections to healthcare workers: a systematic review. PLoS One. 2012;7(4):e35797. doi:10.1371/journal.pone.0035797
10. Yong L, Xing Y. Emperical study on the choice behavior of medical treatment in outpatients in China under the background of hierarchical diagnosis and treatment(Chinese). Chinese Hospital Manage. 2020;40(6):50–54.
11. Xingyue X, Jin Y, Zhang T, et al. Analysis of real-time settlement data of outpatients in a tertiary hospital in Beijing(Chinese). Chinese J Hospital Administration. 2021;37(z2):40–42.
12. OYong K, Coelho L, Bancroft E, et al. Health care–associated infection outbreak investigations in outpatient settings, Los Angeles County, California, USA, 2000-2012. Emerg Infect Dis. 2015;21(8):1317–1321.
13. Qiao F, Huang W, Zong Z, et al. Infection prevention and control in outpatient settings in China—structure, resources, and basic practices. Am J Infect Control. 2018;46(7):802–807. doi:10.1016/j.ajic.2017.12.006
14. Hauer ME. Population projections for U.S. counties by age, sex, and race controlled to shared socioeconomic pathway. Sci Data. 2019;6(1):190005. doi:10.1038/sdata.2019.5
15. Chakraborty T, Ghosh I. Real-time forecasts and risk assessment of novel coronavirus (COVID-19) cases: a data-driven analysis. Chaos Soliton Fract. 2020;135:109850.
16. Chintalapudi N, Battineni G, Amenta F. Covid-19 disease outbreak forecasting of registered and recovered cases after sixty day lockdown in Italy: a data driven model approach. Microbiol Immunol Infect. 2020;53(3):396–403. doi:10.1016/j.jmii.2020.04.004
17. Wang Y, Wang L, Zhao X, et al. Quantitative risk assessment on respiratory tract infection of health care workers in outpatient settings. Chinese J Nosocomiol. 2020;30(22):3493–3497. in Chinese.
18. Wang Y, Wang L, Zhao X, et al. Construction of risk assessment model on respiratory tract infection in health care workers in outpatient settings. Chin J Infect Control. 2021;20(3):227–231. in Chinese.
19. Araz OM, Bentley D, Muelleman RL. Using Google Flu Trends data in forecasting influenza-like-illness related ED visits in Omaha, Nebraska. Am J Emerg Med. 2014;32(9):1016–1023.
20. World Health Organization. Global epidemiological surveillance standards for influenza. ISBN 978 92 4 150660 1. Available from: https://www.who.int/publications/i/item/9789241506601.
21. Roccetti M, Marfia G, Salomoni P, et al. Attitudes of crohn’s disease patients: infodemiology case study and sentiment analysis of Facebook and twitter posts. JMIR Public Health Surveill. 2017;3(3):e51. doi:10.2196/publichealth.7004
22. Martin-Moreno JM, Alegre-Martinez A, Martin-Gorgojo V, et al. Predictive models for forecasting public health scenarios: practical experiences applied during the first wave of the COVID-19 pandemic. Int J Environ Res Public Health. 2022;19(9):5546.
23. Vincent JL, Rello J, Marshall J, et al. International study of the prevalence and outcomes of infection in intensive care units. JAMA. 2009;302:2323–2329.
24. Giuliano KK, Baker D, Thakkar-Samtani M, et al. Incidence, mortality, and cost trends in nonventilator hospital-acquired pneumonia in medicaid beneficiaries, 2015-2019. Am J Infect Control. 2023;51(2):227–230. doi:10.1016/j.ajic.2022.06.016
25. Zhang Y, Yao Z, Zhan S, et al. Disease burden of intensive care unit-acquired pneumonia in China: a systematic review and meta-analysis. Int J Infect Dis. 2014;29:84–90. doi:10.1016/j.ijid.2014.05.030
26. Abdel Moneim A, Radwan MA, Yousef AI. COVID-19 and cardiovascular disease: manifestations, pathophysiology, vaccination, and long-term implication. Curr Med Res Opin. 2022;38(7):1071–1079. doi:10.1080/03007995.2022.2078081
27. Kasiak P, Kowalski T, Rębiś K, et al. Is the ventilatory efficiency in endurance athletes different?-Findings from the NOODLE study. J Clin Med. 2024;13(2):490. doi:10.3390/jcm13020490
28. Zhang D, Liu Z, Zhao X, et al. Study on the incidence and hospitalization rate of influenza in Beijing during 2018-2019 influenza season (Chinese). Int J Virol. 2020;27(1):23–26.
29. Kibria HB, Jyoti O, Matin A. Forecasting the spread of the third wave of COVID-19 pandemic using time series analysis in Bangladesh. Inform Med Unlocked. 2022;28:100815. doi:10.1016/j.imu.2021.100815
30. Rguibi MA, Moussa N, Madani A, et al. Forecasting Covid-19 transmission with ARIMA and LSTM techniques in Morocco. SN Comput Sci. 2022;3(2):133. doi:10.1007/s42979-022-01019-x
31. Li C, Sampene AK, Agyeman FO, et al. Forecasting the severity of COVID-19 pandemic amidst the emerging SARS-CoV-2 variants: adoption of ARIMA model. Comput Math Methods Med. 2022;2022:3163854.
32. Mavragani A, Ochoa G. Google trends in infodemiology and infoveillance: methodology framework. JMIR Public Health Surveill. 2019;5(2):e13439. doi:10.2196/13439
 © 2025 The Author(s). This work is published and licensed by Dove Medical Press Limited. The
full terms of this license are available at https://www.dovepress.com/terms.php
and incorporate the Creative Commons Attribution
- Non Commercial (unported, 4.0) License.
By accessing the work you hereby accept the Terms. Non-commercial uses of the work are permitted
without any further permission from Dove Medical Press Limited, provided the work is properly
attributed. For permission for commercial use of this work, please see paragraphs 4.2 and 5 of our Terms.
© 2025 The Author(s). This work is published and licensed by Dove Medical Press Limited. The
full terms of this license are available at https://www.dovepress.com/terms.php
and incorporate the Creative Commons Attribution
- Non Commercial (unported, 4.0) License.
By accessing the work you hereby accept the Terms. Non-commercial uses of the work are permitted
without any further permission from Dove Medical Press Limited, provided the work is properly
attributed. For permission for commercial use of this work, please see paragraphs 4.2 and 5 of our Terms.