")
Back to Journals » Nature and Science of Sleep » Volume 16
Resting-State EEG Microstates Dynamics Associated with Interindividual Vulnerability to Sleep Deprivation
Received 3 July 2024
Accepted for publication 1 December 2024
Published 5 December 2024 Volume 2024:16 Pages 1937—1948
DOI https://doi.org/10.2147/NSS.S485412
Checked for plagiarism Yes
Review by Single anonymous peer review
Peer reviewer comments 2
Editor who approved publication: Dr Valentina Alfonsi
Zehui Liu, Tian Xie, Ning Ma
Philosophy and Social Science Laboratory of Reading and Development in Children and Adolescents (South China Normal University), Ministry of Education; Center for Sleep Research, Center for Studies of Psychological Application, Guangdong Key Laboratory of Mental Health & Cognitive Science, School of Psychology, South China Normal University, Guangzhou, 510631, People’s Republic of China
Correspondence: Ning Ma, Center for Sleep Research, School of Psychology, South China Normal University, Guangzhou, 510631, People’s Republic of China, Email [email protected]
Purpose: Sleep deprivation can induce severe deficits in vigilant maintenance and alternation in large-scale networks. However, differences in the dynamic brain networks after sleep deprivation across individuals have rarely been investigated. In the present study, we used EEG microstate analysis to investigate the effects of sleep deprivation and how it differentially affects resting-state brain activity in different individuals.
Participants and Methods: A total of 44 healthy adults participated in a within-participant design study involving baseline sleep and 24-hour sleep deprivation, with resting-state EEG recorded during wakefulness. The psychomotor vigilance task (PVT) was used to measure vigilant attention. Participants were median split as vulnerable or resilient according to their changes in the number of lapses between the baseline sleep and sleep deprivation conditions.
Results: Sleep deprivation caused decreases in microstates A, B, and D, and increases in microstate C. We also found increased transition probabilities of microstates C and D between each other, lower transition probabilities from microstates C and D to microstate B, and higher transition probabilities from microstates A and B to microstate C. Sleep-deprived vulnerable individuals showed decreased occurrence of microstate B and transition probability from microstate C to B after sleep deprivation, but not in resilient individuals.
Conclusion: The findings suggest that sleep deprivation critically affects dynamic brain-state properties and the differences in time parameters of microstates might be the underlying neural basis of interindividual vulnerability to sleep deprivation.
Keywords: sleep deprivation, electroencephalography, resting-state, microstates, vigilance, interindividual differences
Introduction
Sleep is a crucial determinant that affects multiple facets of our daily performance. In contemporary society, insufficient sleep has emerged as a widespread issue contributing to diminished and erratic cognitive performance, especially in sustaining vigilance.1,2 The “wake state instability” theory suggests that the interaction between the cumulative homeostatic sleep pressure and the deliberate efforts to resist sleep becomes unstable after prolonged wakefulness, resulting in increased variability in cognitive performance.3 Although a general cognitive decline is observed in all individuals during extended periods of sleep deprivation, the extent of performance deterioration differs significantly among individuals.4 Previous studies have established that the vulnerability to sleep loss and its impact on cognitive performance is stable and trait-like.5 Interindividual differences in response to sleep loss have been documented across diverse cognitive domains, including vigilance,6 working memory,7 and mathematical processing.8
Vigilant attention is an essential cognitive function and is strongly affected by sleep deprivation.9 Decreased vigilance, characterized by longer response times (RT) and more lapses, is most frequently measured by the standard 10-min psychomotor vigilance task.10 The individual differences in PVT performance deficits were mainly reflected in a wide range of RTs and the number of lapses following sleep deprivation.6 Previous studies have classified individuals as either resilient or vulnerable to the effects of sleep loss based on task performance. Vulnerable individuals were identified if they showed extremely significant attentional lapses after sleep deprivation, while resilient individuals had a less pronounced decrease.11,12 A recent study that comprehensively compared methods classifying individual resiliency and vulnerability to sleep deprivation using the PVT metric indicated that the approaches using lapses are stable and effective.13
It was well established that impaired vigilance after sleep deprivation was associated with reduced activity in the frontoparietal network (FPN), salience network (SN), auditory and visual networks, along with preserved activity in the default mode network (DMN), and erratic thalamic activity, as observed in task-based functional magnetic resonance imaging (fMRI) studies.14,15 The prevalent explanation for the neural basis of “state instability” after sleep deprivation is the thalamic-FPN-DMN circuits model.15 There is reciprocal inhibition between task-related FPN activity and task-negative DMN activity when well-rested. Following sleep deprivation, higher thalamic activity may sustain the anti-correlation between FPN and DMN, while lower thalamic activity may cause unstable FPN-DMN reciprocal inhibition and subsequent impaired behavioral performance.15 Consistent with this, static functional connectivity analysis revealed that the FPN-DMN anti-correlation was attenuated after sleep deprivation.16 Moreover, dynamic functional connectivity (DFC) studies showed that the low arousal state was associated with reduced anti-correlation between FPN and DMN.17 This reduction was correlated with slower vigilant performance during temporal fluctuations.18
Importantly, different individuals show different vulnerabilities in the brain regions affected by sleep deprivation.4 During the attentional performance, vulnerable individuals showed decreased task-related activation in inferior frontal and occipital regions after a night of total sleep deprivation, while resilient individuals did not exhibit such changes.11 Another study examining the effects of sleep deprivation with resting state functional connectivity found that the resilient individuals exhibited a relatively larger reduction in FPN-DMN anti-correlation following sleep deprivation since their anti-correlation was much higher in the well-rested state.19 Additionally, individuals with more enhanced functional connectivity between the left middle frontal gyrus and the left visual cortex had a more significant increase in PVT lapses after sleep deprivation, implying that the change of intrinsic spontaneous resting brain activity might represent the individual vulnerability of vigilance function to sleep deprivation.20 These findings suggested that individuals with more disrupted brain activity after sleep deprivation might have worse behavioral performance. In other words, the changes in brain regions or networks induced by sleep deprivation are probably key factors to explain the phenotypic differences in vulnerability to vigilant impairment.
EEG microstate analysis is a mature technique for assessing the spontaneous activity of large-scale brain networks, providing substantial potential to unveil the intricate communication between various brain regions on a millisecond timescale.21 Microstates exhibit a complex syntax characterized by parameters encapsulating various dimensions of stable neural attributes, such as mean duration, occurrence frequency, coverage, and transition probability.22 The duration and occurrence of a microstate reflect the stability and activity trends of underlying neuronal assemblies, respectively. The transition probabilities between each microstate reveal an encoded sequential activation of the neuronal assemblies,22 indicating information flows between different brain states to properly percept and process the incoming stimuli. In recent years, numerous studies have explored differences in EEG microstates between individuals with neuropsychiatric disorders and healthy controls, suggesting the changes in the temporal properties of four canonical microstates (termed A, B, C, and D) as objective neurophysiological biomarkers to reflect changes in brain activity.23 Four prototypical types of microstates account for > 70% of the variance in nearly all individual resting EEG recordings.24 They exhibit strong associations with RSNs, which are susceptible to the effects of sleep deprivation. Microstate A is linked to auditory processing, while microstate B correlates with visual processing and self-imagery. Microstate C is associated with the anterior DMN, a task-negative network characterized by reduced activity during cognitive tasks. Microstate D reflects executive functioning with underlying sources in the dorsal attention network (DAN).21,25 Previous studies using DFC analysis revealed significant declines in the proportion of dwell times and the occurrence in states with strong FPN-DMN anti-correlation, as well as significantly increased transition probability between sleep-deprived states after total sleep deprivation.26 Similarly, temporal properties of microstates can be more clearly associated with specific brain networks and show the effects of sleep deprivation on brain activity. EEG microstate has a higher temporal resolution than fMRI, and unstable fluctuations in the sleep-deprived brain are likely accompanied by changes in dynamical transition probabilities. The temporal properties of resting-state microstates have also demonstrated correlations with behavioral performance.27 Different changes in microstate parameters between individuals probably can reflect differences in impaired behavioral performance. In summary, analyzing the temporal sequence of EEG microstates provides a window to observe variation and individual differences in spontaneous brain activity after sleep deprivation.
In the present research, we used EEG microstate analysis to explore the spatial and temporal properties of brain network alternations after sleep deprivation and inter-individual differences in vulnerability. Initially, we examined differences in PVT performance and temporal properties of microstates between baseline sleep (BS) and sleep deprivation (SD). Then, the participants were median split into sleep deprivation-vulnerable (SD-vul) and sleep deprivation-resilient (SD-res) groups based on changes in PVT lapses,11,12 after which we investigated whether microstates parameters were differentially affected in SD-vul and SD-res groups. Specifically, we posited hypotheses as follows: First, we anticipated significant increases in mean RT, number of lapses, and sleepiness, along with alternations in the microstate time parameters after sleep deprivation. Microstates A, B, and D associated with the auditory network, visual network, and FPN would decrease, while microstate C corresponding to the DMN would increase,15 accompanied by the same trend in transition probabilities. Second, the SD-vul group would show greater differences in some of the above microstate parameters following sleep deprivation than the SD-res group. Specifically, we anticipated that SD-vul individuals would be characterized by remarkable alternations in certain temporal parameters of microstates B, C, or D (associated with visual network, DMN, and FPN, respectively), while expecting minimal or negligible alterations for SD-res individuals.7,11,19
Materials and Methods
Participants
A total of 44 healthy adults (22 females and 22 males; age = 21.2 ± 2.1 years) participated in the study. Eligibility criteria were: (1) normal or corrected-to-normal vision; (2) right-handedness; (3) no habitual drinking, smoking, or other substance addiction; (4) no history of psychiatric illness or sleep disorder; (5) no shift work, cross-meridian travel or irregular sleep-wake routines during the 60 days before the experiment; (6) good sleeping habits (7–9 h of sleep every day with sleep onset no later than 1:00 am);7,11 (7) no any caffeine or medicine intake within 72 h before the study. Before the in-lab experiment, all participants were asked to wear actigraphy (Actiwatch Spectrum, Philips) and complete a 2-week sleep diary to ensure a healthy sleep-wake schedule.7,11 The study was based on the principles of the “Helsinki Declaration” and was approved by the Ethics Committee of South China Normal University (No. SCNU-PSY-2021-215). All participants signed a written informed consent and received a certain amount of money upon completion of the study.
Experimental Protocol
The present study employed a within-subjects design. All 44 participants underwent two sessions, including one for baseline sleep (BS) and one for sleep deprivation (SD). All participants had adaptive sleep in the laboratory beforehand, to familiarize themselves with the laboratory environment and ensure they had no sleep disorders. The pre-test presentation of the experimental guidelines to all participants is conducted to guarantee their comprehension of the experimental protocol. During the BS session, participants arrived at the laboratory at ~8:00 pm and slept from 11:00 pm to 7:00 am. In the SD session, participants were asked to reach the laboratory at ∼8:00 pm and underwent a 24-h total sleep-deprived period under the monitoring of experienced experimenters. Only calming activities were allowed, such as reading, watching low-arousal videos, and taking short walks around the lab. On the morning following both the BS and SD sessions, resting-state EEG was recorded for 5 min with eyes open at approximately 08:30 ± 30 min, followed by the subjective ratings and a 10 min psychomotor vigilance task. To ensure the complete recovery of participants from sleep deprivation, a minimum interval of 3 weeks was maintained between the first session of SD and the subsequent session of BS. Conversely, if the BS session occurred first, two sessions were separated with an interval of at least 1 week. The experimental procedures are shown in Figure 1. According to the polysomnography (PSG) recording during the BS session, participants had a mean (SD) of 7.7 (0.3) hr total sleep time.
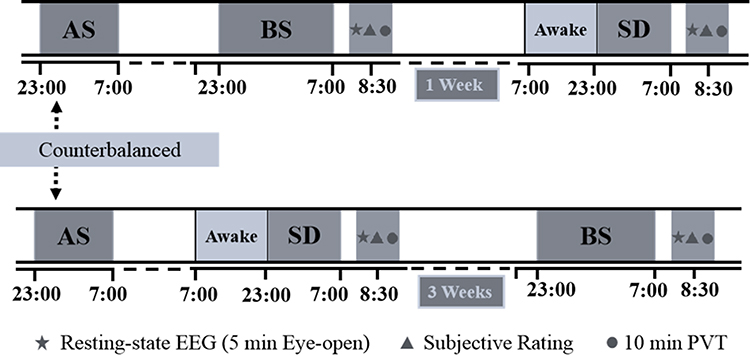 |
Figure 1 Experimental design and protocol. Asterisks indicate a 5 min eye open resting-state EEG. Triangles indicate subjective ratings. Circles indicate the 10 min psychomotor vigilance task (PVT). Abbreviations: AS, adaptive sleep; BS, baseline sleep; SD, sleep deprivation. |
Psychomotor Vigilance Task and Subjective Sleepiness Rating
The psychomotor vigilance test (PVT) was used to measure vigilance. Participants were asked to focus on a red rectangle in the center of the screen and respond quickly with a keystroke when it turned yellow, which appeared with randomized intervals ranging from 2 to 10s. The reaction time (RT) was presented as feedback after a button press. Trials with RT below 100 ms, responses without a stimulus, and no response were excluded. For this study, the following PVT primary metrics were assessed and included: mean reaction times (mean RT), calculated as the mean of all trials for the PVT; the number of lapses, defined as RTs ≥ 500 ms.
The Karolinska Sleepiness Scale (KSS) was used to assess subjective sleepiness ratings in each sleep condition.28 The KSS consists of a 9-point scale on which participants indicated current levels of sleepiness, where “1” indicates “Extremely Alert”, and “9” indicates “Extremely Sleepy”.
EEG Recording and Pre-Processing
Electroencephalography data were acquired with a 64-channel ANT amplifier (Waveguard® original CA-208, ANT Neuro), with an electrode recorded electrooculographic activity at the left infraorbital area. The sampling frequency for data collection was 512 hz and the resistance of each electrode was kept below 10 kΩ. Cpz and AFz served as online reference electrodes and ground electrodes, respectively. During the EEG recording, participants were asked to keep their eyes open (EO) and focus on the cross in the center of the screen.
All EEG data was preprocessed offline using MATLAB R2018b (The MathWorks Inc., Natick, MA), with the EEGLAB (v.14.1.2) toolbox. We used a 50 Hz notch filter and a 0.3–80 Hz band-pass Finite Impulse Response (FIR) filter (EEGLAB function eegfiltnew). The bad channels were identified by visual inspection and replaced by spherical spline interpolation (EEGLAB function interp). Artifacts (eg blinks, eye movements, and muscle artifacts) were semi-automatically rejected from the data using independent component analysis (ICA) (EEGLAB function runica), after which the data were re-referenced to the average of bilateral mastoid channels (M1, M2) (EEGLAB function reref). The 5-min continuous recordings of the EO resting-state were divided into 2s epochs (EEGLAB function epoch). Eventually, the BS session had an average of 80.72% components and 96.70% epochs, and the SD session had an average of 73.91% components and of 94.91% epochs retained.
EEG Microstate Analysis
Clean EO resting-state data were conducted for EEG microstate analysis using a free EEGLAB microstate plug-in and public code by Koenig.29 EEG data were re-referenced from reference at the bilateral mastoid line to average reference and filtered with a 1–40 hz band-pass filter. Artifact-free EEG data were extracted for each participant at time points of maximum global field power24 to obtain individual electric potential field maps. Topographic maps extracted from GFP-peaks were then subjected to an atomize-agglomerate hierarchical cluster analysis30 and the polarity of the topography was ignored.
We first conducted cluster analysis at the individual level, followed by clustering at the group level. Then, the maps of all participants were reordered according to the normative microstate template maps. Third, the four types of topographic maps of all participants were clustered to obtain the grand mean topographic map category across the conditions, labeled microstates A, B, C, and D. Based on spatial correlations with the four grand-mean microstate maps, each topographic map was matched to one best-fitting microstate. The fourth step extracted the following temporal parameters of each microstate for subsequent statistical analysis: duration (ie the mean time of consecutive maps assigned to the same microstate class, measured in milliseconds), occurrence (ie the frequency of appearance during a one-second period, measured in Hertz), contribution (ie the percentage of total time for which a microstate is accounted), and transition probability (ie the difference in transition counts among all microstates between observed and those estimated from the stochastic transition probability model31).
Statistics
Statistical analyses were performed using JAMOVI 2.3.18. Paired t-tests were used to compare the differences in the number of lapses in PVT, subjective sleepiness and microstate parameters between BS and SD. The Wilcoxon rank-sum test was used to test for differences in mean RT due to the non-normal distribution. All tests set the statistical significance level at p < 0.05. The results of microstates were corrected using the False Discovery Rate (FDR) method over 12 comparisons (either 3 parameters (duration, occurrence, and contribution) × 4 microstate classes or 12 transition probabilities) since the microstate parameters are closely related. To assess the interaction effect of state (BS or SD) and group (SD-vul or SD-res) on relevant microstate parameters, we employed a two-way, repeated-measures ANOVA. Post hoc analysis was performed using pairwise comparisons with a Bonferroni correction.
Results
PVT Performance and Subjective Ratings
Based on the changes in the number of lapses between two sessions, participants were classified as resilient if they were below the median and as vulnerable if they were above the median. With 22 participants each, the resilient and vulnerable groups were comparable in age (age of SD-res group = 21.3 ± 2.31 years; age of SD-vul group = 20.5 ± 1.91 years; t42 = 0.36, p = 0.72) and gender (12 females and 10 males in SD-res group, 10 females and 12 males in SD-vul group;  = 0.22, p = 0.64). Remarkably, the two groups did not present any significant differences in the conventional RT metrics throughout the BS session (Figure 2). At the overall level and in both groups, sleep deprivation significantly increased the mean RT, number of lapses, and sleepiness compared with baseline sleep (all p < 0.001, see Table 1).
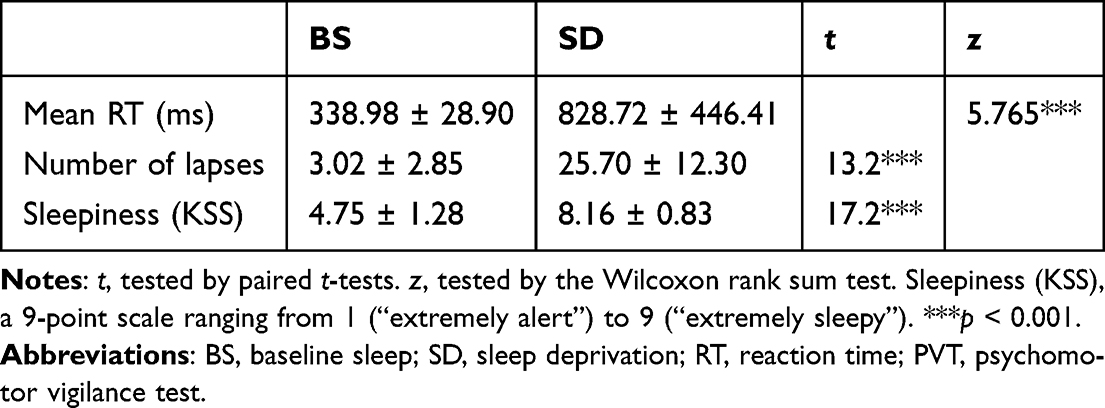 |
Table 1 Statistics of Behavior Performance (PVT) and Subjective Sleepiness in 2 Sleep Condition |
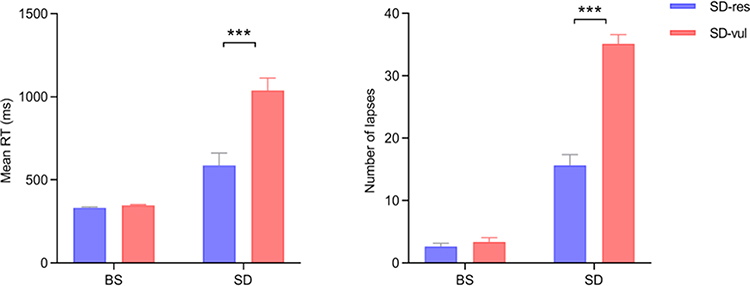 |
Figure 2 Performance metrics measured during the baseline sleep (BS) session and sleep deprivation (SD) session, including mean reaction time (RT) and number of lapses for participants resilient (SD-res) and vulnerable (SD-vul) to sleep deprivation. There was no statistically significant difference in PVT metrics between the two groups in BS (p = 0.086 for mean RT and p = 0.375 for the number of lapses), but the differences were significant in SD (***p < 0.001). Error bar represented a standard error of the mean. |
Resting-State EEG Microstates
The four microstate maps explained on average 74.58 ± 4.56% (74.62 ± 4.65% in BS and 74.54 ± 4.53% in SD) of the global variance across participants. This value is comparable to previous research, and the resulting microstate topographies were similar to normative classes described by Koenig et al (Figure 3).24
 |
Figure 3 Topographies of the four classes of microstates in two conditions (BS, baseline sleep; SD, sleep deprivation) and Grand-mean. |
The statistical analysis demonstrated a significant alteration in the four microstates after sleep deprivation (Figure 4). The duration (t43 = 4.08, p = 0.001), occurrence (t43 = 2.41, p = 0.035), and contribution (t43 = 3.75, p = 0.002) of microstate B, and the duration of microstates A (t43 = 2.88, p = 0.015) and D (t43 = 2.72, p = 0.019) were significantly much lower in SD. Compared to baseline sleep, there was an increase in the occurrence (t43 =−4.95, p = 0.000) and contribution (t43 =−3.79, p = 0.002) of microstate C following sleep deprivation.
 |
Figure 4 Comparison of the microstate parameters (Duration, Occurrence, Contribution) between the BS group and the SD group. Error bar represented a standard error of the mean. Stars correspond to the significance levels after FDR correction for 12 comparisons (*p < 0.05, **p < 0.005, ***p < 0.001). |
Further statistical tests showed a significant difference in temporal transition probabilities of microstates between BS and SD conditions (Figure 5). In the SD session, transition probabilities were greater from microstate A to C (t43 =−3.11, p = 0.013), B to C (t43 =−2.35, p = 0.046), from microstate C to D (t43 =−2.89, p = 0.014), and from D to C (t43 =−3.42, p = 0.008). Conversely, individuals following sleep deprivation demonstrated fewer transitions from microstate C to B (t43 = 2.94, p = 0.014), and from D to B (t43 = 4.187, p = 0.002).
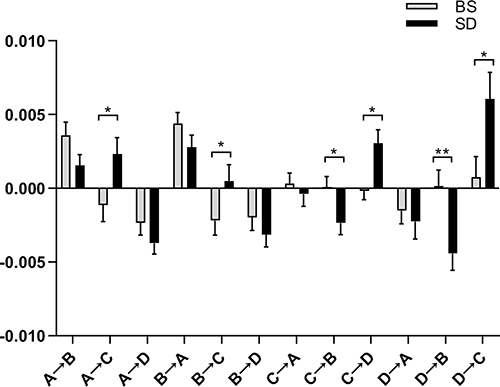 |
Figure 5 Comparison of the transition probabilities of the transitions between the four microstate classes between the BS group and the SD group. Error bar represented a standard error of the mean. Stars correspond to the significance levels after FDR correction for 12 comparisons (*p < 0.05, **p < 0.005). |
Effects of State and Group on Microstate Parameters
The ANOVA results were shown in Figure 6. There was a significant main effect of state on occurrence (F1,42 = 6.24, p = 0.016) of microstate B, as well as the transition probability from microstate C to B (F1,42 = 9.73, p = 0.003), which were all significantly lower in the SD state compared to the BS state. There was no main effect of group. The interaction of state and group was significant in the occurrence of microstate B (F1,42 = 4.17, p = 0.047), and the transition probability from microstate C to B (F1,42 = 6.35, p = 0.016), which indicated that the declines in these microstate parameters were modulated by group. After experiencing a state of sleep deprivation, the occurrence of microstate B (t21 = 2.86, p = 0.009), and the transition probability from microstate C to B (t21 = 3.42, p = 0.003) significantly decreased in vulnerable group, but were not observed in resilient participants (t21 = 0.37, p = 0.712; t21 = 0.53, p = 0.601).
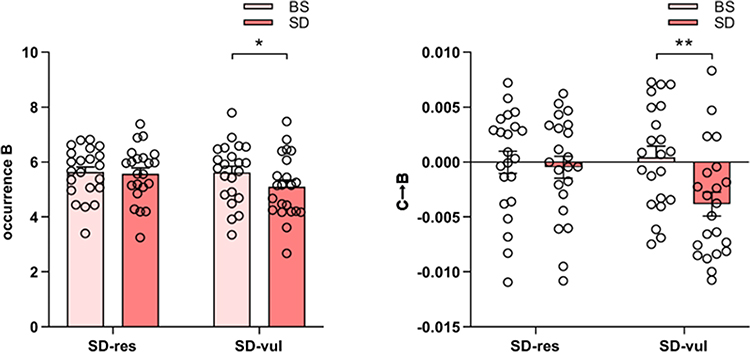 |
Figure 6 Microstate parameters for sleep deprivation-resilient (SD-res) and sleep deprivation-vulnerable (SD-vul) groups on the baseline sleep (BS) and after sleep deprivation (SD). SD-vul participants showed significantly lower occurrence of microstate B (*p = 0.009) and transition from microstate C to B (**p = 0.003) after sleep deprivation. SD-res participants showed no significant difference. Error bars represent one standard error of the mean. |
Discussion
In the current study, we utilized EEG microstate analysis to investigate the alternations in dynamic properties of large-scale brain activity after sleep deprivation and the inter-individual vulnerability of these temporal properties. Our results identified a wide detrimental effect of sleep deprivation on the resting-state networks, particularly in class B and class C, which are associated with visual networks and the DMN. Sleep deprivation also induced a higher transition probability from microstates A and B to C and a lower transition probability from microstates C and D to B, related to preserved bottom-up modulation and declined top-down control.32 Moreover, we also found higher probabilities of switching between microstates C and D, supporting the instability of the thalamic-FPN-DMN circuits model after sleep deprivation.15 Critically, the occurrence of microstate B and the transition probability from C to B were significantly lower in SD-vul participants after sleep deprivation, but SD-res participants showed no significant difference. The current findings indicate that sleep deprivation not only disrupts dynamic activity features in the resting brain, but also specifically impacts the visual network and top-down control in vulnerable individuals.
Effect of Sleep Deprivation on Temporal Parameters of Four Canonical Microstates
Consistent with our first hypothesis, sleep deprivation severely disrupted the temporal properties of the four canonical microstates, as well as the transition probabilities among them. These four microstates are not only associated with DMN and FPN (C and D), which are widely popular in sleep deprivation research, but also provide information on auditory and visual processing (A and B).
First, the results for microstates C and D show robust changes in DMN and FPN after sleep deprivation from the perspective of temporal properties. The frequency and contribution of microstate C increased significantly after sleep deprivation, reflecting increased activity in the anterior default mode network (DMN).25 DMN is a task-negative network associated with mind-wandering, self-related thoughts, and emotional and interoceptive processing.33 Sleep deprivation might cause improper DMN activation, and slower responses were related to increased activity in the medial prefrontal, which is part of the DMN.33 The declines in microstate C suggest an inability to disengage from off-task DMN activity and an increase in self-related mind wandering after sleep deprivation. Besides, consistent with our findings, it has been found that an increase in microstate C was characteristic of sleepiness,34 and mental fatigue.27 As for microstate D, the mean duration was shortened in the SD session, supporting that sleep deprivation can reduce activity in frontoparietal areas and impair the capacity to sustain attention.35 It has been observed that frontoparietal activity decreases from waking to light sleep,36 as well as a corresponding decrease in microstate D.37 Therefore, the decreased duration of microstate D might be explained by the detriment of FPN after sleep deprivation and participants’ drowsiness. Additionally, we also found increased transition probabilities of microstates C and D between each other, reflecting loss of functional anti-correlation between DMN and FPN observed in the sleep-deprived state.16,19 The results also support the “state instability” theory of unstable reciprocal inhibition between FPN activity and DMN activity in the thalamic-FPN-DMN circuits.15
Second, the changes in microstates A and B, as well as transition probabilities among four microstates, implied alternations in perceptual processing and attention regulation after sleep deprivation. The duration of microstate A, and the duration, frequency, and contribution of microstate B were significantly lower in the SD session, corresponding to previous findings on the reduced auditory38 and visual processing39 following sleep deprivation. Despite controversy regarding the exact correspondence of microstates A and B with auditory and visual processing,25 numerous studies have affirmed their relationship with perceptual processes. Meanwhile, there were lower transition probabilities from other microstates (C and D) to microstate B and higher transition probabilities from other microstates (A and B) to microstate C. Microstate time sequence is neither random nor predictable, which is crucial to ensuring flexible management of information flow at rest.25 The changes in such non-random time series may characterize disruption in mental processes associated with sleep deprivation. Sensory factors (eg, visual and auditory corresponding to microstates A and B) are concerned with bottom-up attentional regulation. High-order regions are involved in top-down modulation, including those corresponding to microstates C and D in the DMN and FPN.40,41 The decrease in transition probabilities from C and D to B and the increase in transition probabilities from A and B to C might reflect the deterioration of top-down control and relative enhancement of bottom-up control.32 Moreover, the reciprocal interaction between the weakened top-down control and unstable bottom-up modulation can be used to explain the vigilance decrement during sleep deprivation.2,32
Individual Differences to Sleep Deprivation on Dynamic Brain Activities
Corresponding to our second hypothesis, vulnerable participants had greater abnormal alterations on some parameters of microstates B and C. Specifically, they showed significantly lower occurrence of microstate B and transition probability from microstate C to B after sleep deprivation, while SD-resilient participants did not exhibit such changes. These findings demonstrated the neurobiological factors of inter-individual differences in vulnerability to sleep deprivation.
The decreased occurrence of microstate B can reflect a less fluctuating tendency in visual network activity among vulnerable individuals.22 It has been shown that sleep deprivation impairs both attentional arousal and central cognitive processes using the diffusion model. Larger variability in the non-decision component suggests an increased variability in the stimulus-encoding and response-output processes.42 Furthermore, sleep deprivation severely affected non-decision times in vulnerable individuals.12 The decline in the occurrence of microstate B observed only in SD-vulnerable individuals was partially consistent with the individual differences in the non-decision component, suggesting that part of this variation stemmed from stimulus-encoding processes.
The severely reduced occurrence of microstate B and the transition probability from B to C suggest that sleep deprivation primarily affects visual networks and top-down control in vulnerable individuals. Using task-based fMRI, vulnerable individuals displayed significant concurrent reduction in thalamus and visual cortex, as well as lower signal increases in regions of top-down attentional biasing.11 Likewise, our results showed similar degradation in visual networks and top-down control in resting sleep-deprived brains among vulnerable individuals. As mentioned previously, the intermittently diminished thalamic activity plays a modulating role in unstable FPN-DMN reciprocal inhibition after sleep deprivation, and lapses are frequently observed when thalamic activity markedly reduces.15 According to the well-established anatomy of the visual system, visual information travels to the visual cortex via the thalamus.43 These results supported the thalamic-FPN-DMN circuits model in the sleep-deprived brain and extended to the visual networks, implying that stronger thalamic inhibition leads to reduced information input to the visual cortex, resulting in more lapses in vulnerable individuals.
To summarize, individual differences in sensory input and top-down control might indicate a potential neural basis for individual vulnerability to sleep deprivation. However, much of the previous research has focused on the effects of sleep deprivation on higher-order cognitive brain regions (including FPN, DMN, and SN),14,15 relatively less research has been conducted on how sleep deprivation impacts primary sensory processing brain regions. Our results emphasized the detrimental effects of sleep deprivation on fundamental perceptual processes and their functional relevance with higher top-down control.
Study Limitations and Future Work
This study possesses several limitations as follows. First, we only investigated young adults, while the previous study showed that older adults are less impaired by sleep deprivation than younger adults.44 Individual differences in neural vulnerability to sleep deprivation may differ by age.4 Second, our study only focused on the vigilant function. However, the association of brain activation changes and performance is task-dependent.45 It is necessary to investigate phenotypic differential vulnerabilities to sleep deprivation of tasks involving aspects of executive functioning, such as working memory and risk-taking. Future research should be extended to a broader range of samples and various tasks.
Conclusion
The present study provides evidence indicating that the resting-state EEG microstate can be used to investigate the dynamic alternation in large-scale activity and vulnerability to sleep deprivation. The temporal parameters of four microstates changed significantly after sleep deprivation, suggesting that sleep deprivation severely alters the activity of dynamic brain networks. In terms of transition probabilities, sleep deprivation leads to unstable reciprocal inhibition between the DMN and FPN, impaired top-down control, and relatively enhanced bottom-up control. Notably, vulnerable individuals have a lower occurrence of microstate B and transition probability from microstate C to B after sleep deprivation, possibly due to their decreased visual input and weakened top-down control. The current findings highlight the importance of examining not only higher-order brain regions, but also the effects on perceptual systems and their behavioral correlates in future sleep deprivation studies.
Data Accessibility
The data that support the findings of this study are available on request from the corresponding author.
Ethical Approval
This study was conducted in accordance with the Declaration of Helsinki and approved by the Medical Ethical Committee of the South China Normal University (of the principal investigator N.M., Approval No. SCNU-PSY-2021-215). Each participant in the current study signed informed consent before study commencement.
Author Contributions
All authors made a significant contribution to the work reported, whether that is in the conception, study design, execution, acquisition of data, analysis and interpretation, or in all these areas; took part in drafting, revising or critically reviewing the article; gave final approval of the version to be published; have agreed on the journal to which the article has been submitted; and agree to be accountable for all aspects of the work.
Funding
This work was supported by Guangdong Basic and Applied Basic Research Foundation, China (No. 2023A1515011873), Research Center for Brain Cognition and Human Development, Guangdong, China (No. 2024B0303390003) and the funding of Striving for the First-Class, Improving Weak Links and Highlighting Features (SIH) Key Discipline for Psychology in South China Normal University.
Disclosure
The authors have no conflict of financial or academic interest.
References
1. Leong RLF, Chee MWL. Understanding the need for sleep to improve cognition. Annu Rev Psychol. 2023;74(1):27–57. doi:10.1146/annurev-psych-032620-034127
2. Hudson AN, Van Dongen HPA, Honn KA. Sleep deprivation, vigilant attention, and brain function: a review. Neuropsychopharmacology. 2020;45(1):21–30. doi:10.1038/s41386-019-0432-6
3. Killgore WDS. Effects of sleep deprivation on cognition. Prog Brain Res. 2010;185:105–129. doi:10.1016/B978-0-444-53702-7.00007-5
4. Tkachenko O, Dinges DF. Interindividual variability in neurobehavioral response to sleep loss: a comprehensive review. Neurosci Biobehav Rev. 2018;89:29–48. doi:10.1016/j.neubiorev.2018.03.017
5. Yamazaki EM, Goel N. Robust stability of trait-like vulnerability or resilience to common types of sleep deprivation in a large sample of adults. Sleep. 2020;43(6):zsz292. doi:10.1093/sleep/zsz292
6. Cui J, Tkachenko O, Gogel H, et al. Microstructure of frontoparietal connections predicts individual resistance to sleep deprivation. NeuroImage. 2015;106:123–133. doi:10.1016/j.neuroimage.2014.11.035
7. Chee MWL, Chuah LYM, Venkatraman V, Chan WY, Philip P, Dinges DF. Functional imaging of working memory following normal sleep and after 24 and 35 h of sleep deprivation: correlations of fronto-parietal activation with performance. NeuroImage. 2006;31(1):419–428. doi:10.1016/j.neuroimage.2005.12.001
8. Xu J, Zhu Y, Fu C, et al. Frontal metabolic activity contributes to individual differences in vulnerability toward total sleep deprivation-induced changes in cognitive function. J Sleep Res. 2016;25(2):169–180. doi:10.1111/jsr.12354
9. Lim J, Dinges DF. A meta-analysis of the impact of short-term sleep deprivation on cognitive variables. Psychol Bull. 2010;136(3):375–389. doi:10.1037/a0018883
10. Dinges DF, Powell JW. Microcomputer analyses of performance on a portable, simple visual RT task during sustained operations. BehavRes Methods Instrum Comput. 1985;17(6):652–655. doi:10.3758/BF03200977
11. Chee MWL, Tan JC. Lapsing when sleep deprived: neural activation characteristics of resistant and vulnerable individuals. NeuroImage. 2010;51(2):835–843. doi:10.1016/j.neuroimage.2010.02.031
12. Patanaik A, Zagorodnov V, Kwoh CK, Chee MWL. Predicting vulnerability to sleep deprivation using diffusion model parameters. J Sleep Res. 2014;23(5):576–584. doi:10.1111/jsr.12166
13. Yamazaki EM, Casale CE, Brieva TE, Antler CA, Goel N. Concordance of multiple methods to define resiliency and vulnerability to sleep loss depends on psychomotor vigilance test metric. Sleep. 2022;45(1):zsab249. doi:10.1093/sleep/zsab249
14. Ma N, Dinges DF, Basner M, Rao H. How acute total sleep loss affects the attending brain: a meta-analysis of neuroimaging studies. Sleep. 2015;38(2):233–240. doi:10.5665/sleep.4404
15. Krause AJ, Simon EB, Mander BA, et al. The sleep-deprived human brain. Nat Rev Neurosci. 2017;18(7):404–418. doi:10.1038/nrn.2017.55
16. De Havas JA, Parimal S, Soon CS, Chee MWL. Sleep deprivation reduces default mode network connectivity and anti-correlation during rest and task performance. NeuroImage. 2012;59(2):1745–1751. doi:10.1016/j.neuroimage.2011.08.026
17. Wang C, Ong JL, Patanaik A, Zhou J, Chee MWL. Spontaneous eyelid closures link vigilance fluctuation with fMRI dynamic connectivity states. Proc Natl Acad Sci. 2016;113(34):9653–9658. doi:10.1073/pnas.1523980113
18. Mai Z, Li M, Pan L, Ma N. Temporal fluctuations in vigilance and neural networks after sleep deprivation. Eur J Neurosci. 2022;55(8):1947–1960. doi:10.1111/ejn.15663
19. Yeo BTT, Tandi J, Chee MWL. Functional connectivity during rested wakefulness predicts vulnerability to sleep deprivation. NeuroImage. 2015;111:147–158. doi:10.1016/j.neuroimage.2015.02.018
20. Cai Y, Mai Z, Li M, Zhou X, Ma N. Altered frontal connectivity after sleep deprivation predicts sustained attentional impairment: a resting-state functional magnetic resonance imaging study. J Sleep Res. 2021;30(5):e13329. doi:10.1111/jsr.13329
21. Tarailis P, Koenig T, Michel CM, Griškova-Bulanova I. The functional aspects of resting EEG microstates: a systematic review. Brain Topogr. 2023;1–37. doi:10.1007/s10548-023-00958-9
22. Khanna A, Pascual-Leone A, Michel CM, Farzan F. Microstates in resting-state EEG: current status and future directions. Neurosci Biobehav Rev. 2015;49:105–113. doi:10.1016/j.neubiorev.2014.12.010
23. Khanna A, Pascual-Leone A, Farzan F. Reliability of resting-state microstate features in electroencephalography. PLoS One. 2014;9(12):e114163. doi:10.1371/journal.pone.0114163
24. Koenig T, Prichep L, Lehmann D, et al. Millisecond by millisecond, year by year: normative EEG microstates and developmental stages. NeuroImage. 2002;16(1):41–48. doi:10.1006/nimg.2002.1070
25. Michel CM, Koenig T. EEG microstates as a tool for studying the temporal dynamics of whole-brain neuronal networks: a review. NeuroImage. 2018;180(Pt B):577–593. doi:10.1016/j.neuroimage.2017.11.062
26. Xu H, Shen H, Wang L, et al. Impact of 36 h of total sleep deprivation on resting-state dynamic functional connectivity. Brain Res. 2018;1688:22–32. doi:10.1016/j.brainres.2017.11.011
27. Li W, Cheng S, Wang H, Chang Y. EEG microstate changes according to mental fatigue induced by aircraft piloting simulation: an exploratory study. Behav Brain Res. 2023;438:114203. doi:10.1016/j.bbr.2022.114203
28. Åkerstedt T, Gillberg M. Subjective and objective sleepiness in the active individual. Int J Neurosci. 1990;52(1–2):29–37. doi:10.3109/00207459008994241
29. Koenig T EEGLAB plugin for microstates. 2017. Available from: http://www.thomaskoenig.ch/indexphp/software/microstates-in-eeglab/getting-started.
30. Murray MM, Brunet D, Michel CM. Topographic ERP analyses: a step-by-step tutorial review. Brain Topogr. 2008;20(4):249–264. doi:10.1007/s10548-008-0054-5
31. Lehmann D, Faber PL, Galderisi S, et al. EEG microstate duration and syntax in acute, medication-naive, first-episode schizophrenia: a multi-center study. Psychiatry Res. 2005;138(2):141–156. doi:10.1016/j.pscychresns.2004.05.007
32. Pan L, Mai Z, Wang J, Ma N. Altered vigilant maintenance and reorganization of rich-clubs in functional brain networks after total sleep deprivation. Cereb Cortex. 2023;33(4):1140–1154. doi:10.1093/cercor/bhac126
33. Raichle ME. The brain’s default mode network. Annu Rev Neurosci. 2015;38:433–447. doi:10.1146/annurev-neuro-071013-014030
34. Comsa IM, Bekinschtein TA, Chennu S. Transient topographical dynamics of the electroencephalogram predict brain connectivity and behavioural responsiveness during drowsiness. Brain Topogr. 2019;32(2):315–331. doi:10.1007/s10548-018-0689-9
35. Javaheripour N, Shahdipour N, Noori K, et al. Functional brain alterations in acute sleep deprivation: an activation likelihood estimation meta-analysis. Sleep Med Rev. 2019;46:64–73. doi:10.1016/j.smrv.2019.03.008
36. Goupil L, Bekinschtein TA. Cognitive processing during the transition to sleep. Archives Italiennes De Biologie. 2012;150(2–3):140–154. doi:10.4449/aib.v150i2.1247
37. Brodbeck V, Kuhn A, Von Wegner F, et al. EEG microstates of wakefulness and NREM sleep. NeuroImage. 2012;62(3):2129–2139. doi:10.1016/j.neuroimage.2012.05.060
38. Zhang L, Shao Y, Liu Z, Li C, Chen Y, Zhou Q. Decreased information replacement of working memory after sleep deprivation: evidence from an event-related potential study. Front Neurosci. 2019;13:408. doi:10.3389/fnins.2019.00408
39. Chee MWL, Goh CSF, Namburi P, Parimal S, Seidl KN, Kastner S. Effects of sleep deprivation on cortical activation during directed attention in the absence and presence of visual stimuli. NeuroImage. 2011;58(2):595–604. doi:10.1016/j.neuroimage.2011.06.058
40. Margulies DS, Ghosh SS, Goulas A, et al. Situating the default-mode network along a principal gradient of macroscale cortical organization. Proc Natl Acad Sci U S A. 2016;113(44):12574–12579. doi:10.1073/pnas.1608282113
41. Miao Q, Zhang G, Yan W, Liu B. Investigating the brain neural mechanism when signature objects were masked during a scene categorization task using functional MRI. Neuroscience. 2018;388:248–262. doi:10.1016/j.neuroscience.2018.07.030
42. Ratcliff R, Van Dongen HPA. Sleep deprivation affects multiple distinct cognitive processes. Psychon B Rev. 2009;16(4):742–751. doi:10.3758/PBR.16.4.742
43. Behrens TEJ, Johansen-Berg H, Woolrich MW, et al. Non-invasive mapping of connections between human thalamus and cortex using diffusion imaging. Nat Neurosci. 2003;6(7):750–757. doi:10.1038/nn1075
44. Duffy JF, Willson HJ, Wang W, Czeisler CA. Healthy older adults better tolerate sleep deprivation than young adults: increased tolerance of sleep deprivation with age. J Am Geriatr Soc. 2009;57(7):1245–1251. doi:10.1111/j.1532-5415.2009.02303.x
45. Petersen SE, Posner MI. The attention system of the human brain: 20 years after. Annu Rev Neurosci. 2012;35(1):73–89. doi:10.1146/annurev-neuro-062111-150525
 © 2024 The Author(s). This work is published and licensed by Dove Medical Press Limited. The
full terms of this license are available at https://www.dovepress.com/terms.php
and incorporate the Creative Commons Attribution
- Non Commercial (unported, 3.0) License.
By accessing the work you hereby accept the Terms. Non-commercial uses of the work are permitted
without any further permission from Dove Medical Press Limited, provided the work is properly
attributed. For permission for commercial use of this work, please see paragraphs 4.2 and 5 of our Terms.
© 2024 The Author(s). This work is published and licensed by Dove Medical Press Limited. The
full terms of this license are available at https://www.dovepress.com/terms.php
and incorporate the Creative Commons Attribution
- Non Commercial (unported, 3.0) License.
By accessing the work you hereby accept the Terms. Non-commercial uses of the work are permitted
without any further permission from Dove Medical Press Limited, provided the work is properly
attributed. For permission for commercial use of this work, please see paragraphs 4.2 and 5 of our Terms.