")
Back to Journals » Diabetes, Metabolic Syndrome and Obesity » Volume 17
Risk Prediction Models for Mild Cognitive Impairment in Patients with Type 2 Diabetes Mellitus: A Systematic Review and Meta-Analysis
Authors Xia Z , Cao S , Li T , Qin Y , Zhong Y
Received 28 August 2024
Accepted for publication 16 November 2024
Published 25 November 2024 Volume 2024:17 Pages 4425—4438
DOI https://doi.org/10.2147/DMSO.S489819
Checked for plagiarism Yes
Review by Single anonymous peer review
Peer reviewer comments 4
Editor who approved publication: Dr Konstantinos Tziomalos
Zhuoran Xia,1,2 Songmei Cao,1 Teng Li,2 Yuan Qin,2 Yu Zhong1,2
1Department of Nursing, Affiliated Hospital of Jiangsu University, Zhenjiang, 212001, People’s Republic of China; 2School of Medicine, Jiangsu University, Zhenjiang, 212001, People’s Republic of China
Correspondence: Songmei Cao, Affiliated Hospital of Jiangsu University, 438 Jiefang Road, Jingkou District, Zhenjiang City, Jiangsu Province, People’s Republic of China, Email [email protected]
Objective: This study aimed to systematically review the existing research on risk prediction models for mild cognitive impairment in patients with type 2 diabetes mellitus and to analyze the predictive performance of these models.
Methods: A systematic computerized search was conducted for studies published in CNKI, Wanfang, VIP, CBM, PubMed, Embase, Cochrane Library, CINAHL, and Web of Science regarding risk prediction models for mild cognitive impairment in patients with type 2 diabetes mellitus, covering the period the inception of the databases through November 10, 2024. Two independent reviewers performed literature screening and data extraction based on predefined inclusion and exclusion criteria. The risk of bias and the applicability of the included studies were subsequently evaluated using the Risk of Bias Assessment Tool for Prediction Models. A meta-analysis of the predictive performance of the models was performed using Stata 17.0 software.
Results: A total of 12 studies and 17 prediction models were included in the analysis, with the area under the receiver operating characteristic curve (AUC) for the models ranging from 0.743 to 0.987. All studies were assessed to be at high risk of bias, particularly concerning the issue of underreporting in the area of data analysis. The combined AUC value of the six validated models was 0.854, indicating that these models exhibited favorable predictive performance. The multivariate models consistently identified age, education, disease duration, depression, and glycosylated hemoglobin level as independent predictors.
Conclusion: The development of risk prediction models for mild cognitive impairment in patients with type 2 diabetes mellitus is still in its infancy. In order to develop more accurate and practical risk prediction models for mild cognitive impairment in patients with type 2 diabetes mellitus, future studies must rely on large-sample, multicenter prospective cohorts and adhere to rigorous study designs.
Keywords: type 2 diabetes mellitus, cognitive impairment, prediction model, systematic review, meta-analysis
Introduction
Diabetes mellitus, particularly type 2 diabetes mellitus (T2DM), has emerged as a significant public health concern on a global scale. The latest data from the International Diabetes Federation (IDF) indicate that the number of individuals with diabetes worldwide has reached an alarming 537 million,1 with China accounting for the largest number of patients at 140 million. T2DM is a chronic metabolic disease that accounts for over 90% of all diabetes cases. It is characterized by insulin resistance and impaired insulin secretion, which result in persistently elevated blood glucose levels.2 Prolonged hyperglycemia can cause damage to blood vessels and nerves, leading to a variety of complications, including cardiovascular disease, nephropathy, retinopathy, and foot problems. Of particular concern is the association with cognitive impairment, which not only affects the quality of daily life but also shortens life expectancy.3–5 Mild Cognitive Impairment (MCI) represents a significant health concern for individuals with diabetes. MCI is defined as a gradual decline in cognitive function that does not yet meet the criteria for dementia. However, it is a condition that warrants attention and monitoring. The symptoms of MCI manifest as memory loss, diminished executive function, and difficulties with concentration. However, these symptoms typically do not significantly impair the individual’s ability to perform in daily activities.6 As a critical transitional phase between healthy aging and dementia, MCI presents a valuable opportunity for early detection and intervention. It is regarded as a crucial target for the slowing of cognitive decline and the prevention or postponement of dementia development.7 A growing body of evidence indicates that individuals with T2DM are at a significantly elevated risk of developing MCI, with a reported prevalence of up to 45%. This heightened risk is associated with an increased likelihood of progression to dementia, which represents a substantial burden on individuals, families, and the healthcare system.8–11
In light of the strong correlation between T2DM and MCI, as well as the significant impact that MCI can have on both individuals and the healthcare system, it is crucial to identify and manage the risk of MCI in patients with T2DM. Although the association between T2DM and MCI has been extensively studied, a comprehensive evaluation of MCI risk prediction models specifically for patients with T2DM is lacking. This study presents the first systematic review and analysis of existing risk prediction models for MCI in patients with T2DM. The aim is to assess the predictive performance and applicability of these models, as well as to explore strategies for optimizing them to improve the early identification of MCI risk and contribute to the development of effective prevention and intervention strategies. The findings of this study are expected to provide a solid scientific basis for managing the risk of MCI in patients with T2DM. In the long term, these efforts are anticipated to improve patient prognosis, refine treatment options, reduce healthcare costs, and alleviate the economic and social burdens faced by patients and their families, yielding far-reaching implications for clinical practice and public health policy.
Methods
Establishment of the Question
This study employed the PICOTS framework, as recommended by the Cochrane Prognostic Methodology Group, to construct evidence-based questions.12 The study population (P) comprised of patients with T2DM. The intervention (I) evaluated was the risk prediction models for MCI. There was no comparison (C). The outcome (O) measured was the occurrence of MCI during the progression of the disease. The timing of model use (T) involved real-time measurements throughout the course of the disease, while the setting (S) included both hospital or community environments. In this context, T refers to the real-time measurement of T2DM patients, and S denotes the scenarios in which the model is applied, encompassing both hospital and community settings.
Search Strategy
A comprehensive literature search on MCI risk prediction models for patients with T2DM was conducted using several databases, including CNKI, Wanfang, VIP, CBM, PubMed, Embase, Cochrane Library, CINAHL, and Web of Science. The search was restricted to literature published up to November 10, 2024. The search terms and expressions used for both Chinese and English databases are detailed in Appendix S1.
Inclusion and Exclusion Criteria
The inclusion criteria were as follows: (1) The study subjects were patients with T2DM;2 (2) The study focus on the construction and/or validation of risk prediction models for MCI in T2DM patients; (3) The study design was either cross-sectional, case-control, or cohort.
The exclusion criteria were as follows: (1) Studies that were genetic, cellular, or pharmacological in nature; (2) Studies that were research protocols; (3) Studies for which the full text could not be accessed.
Literature Screening and Data Extraction
The literature was organized using EndNote 20, and two researchers (LT and ZY) screened the literature based on the title, abstract, and full text according to the established inclusion and exclusion criteria. In the event of a discrepancy, a third researcher (XZR) was consulted for resolution. Standardized forms were created, and information was extracted in accordance with the Critical Appraisal and Data Extraction for Systematic Reviews of Prediction Modelling Studies (CHARMS).13 The data extraction was conducted independently by two researchers (LT and QY), and any discrepancy were discussed with the third researcher (XZR). The extraction process was carried out in two stages. The first stage involved gathering basic information, which included the following: the first author, year of publication, country, type of study, study population, sample source, and definitions of endpoints. The second stage concentrated on model-related information, encompassing the following: the modeling method, number of candidate variables, treatment method for continuous variables, model performance, model validation, method for handling missing data, and predictors.
Literature Quality Assessment
In this study, both the Agency for Healthcare Research and Quality (AHRQ) and the Prediction Model Risk of Bias Assessment Tool (PROBAST) were employed to assess the quality of the literature and the potential for bias in the models.14,15 The AHRQ was utilized to evaluate the risk of bias in the criteria for cross-sectional studies, which consisted of 11 items answered with “yes”, “no”, or “unclear”. A score of 1 was assigned for “yes”, while a score of 0 was given for “unclear or no”. A total score of 8 to 11 was deemed indicative of high quality, a score of 4 to 7 was considered indicative of moderate quality, and a score of 0 to 3 was regarded as indicative of low quality (Appendix S2). The PROBAST tool was used to assess the risk of bias, which includes four parts: study participants, predictors, outcomes, and statistical analysis.15 It consists of 20 key questions that are answered with “yes or probably yes”, “no or probably no”, or “unclear”. If all questions receive a response of “yes or probably yes”, the risk is classified as low. Conversely, if any question is answered with “no or probably no”, the risk is classified as high. If some questions marked as “unclear” while all other questions are answered with “yes or probably yes”, the risk is deemed “unclear”. The final assessment of risk of bias and applicability is categorized as low, high, or unclear. (Appendix S3). Two researchers independently evaluated the quality of the literature, the risk of bias in the models, and the applicability risk. In the event of disagreement, a discussion with a third researcher was held.
Statistical Analysis
A meta-analysis of the area under the receiver operating characteristic curve (AUC) for the predictive models was conducted using Stata 17.0 software. The heterogeneity index I²and the Q-test were employed to assess the heterogeneity of the included models. An I²value ≤25% indicated low heterogeneity, 25% ≤ I² < 50% indicated moderate heterogeneity, and I² ≥ 50% indicated high heterogeneity. Based on the extent of heterogeneity observed in the analysis results, either a random effects model or a fixed effects model was selected. Subgroup analysis was performed to identify the sources of substantial heterogeneity. Sensitivity analysis was conducted to evaluate the robustness of the results. The Egger’s test was utilized to assess the potential for publication bias, with a P-value of less than 0.05 generally accepted as indicative of possible publication bias.
Results
Literature Screening Process and Results
A search of the database yielded 439 pieces of literature, which were subsequently subjected to a screening process. Of these, 12 pieces were ultimately deemed suitable for inclusion (Figure 1).
 |
Figure 1 Flow chart of literature screening. |
Basic Characteristics of the Included Literature
All twelve papers were published between 2023 and 2024, comprising five in Chinese and seven in English. Each study utilized a cross-sectional design and was conducted during the hospitalization of patients with T2DM, with two of the studies being multicenter investigations. Among the publications, two were dissertations and ten were journal articles (Table 1).
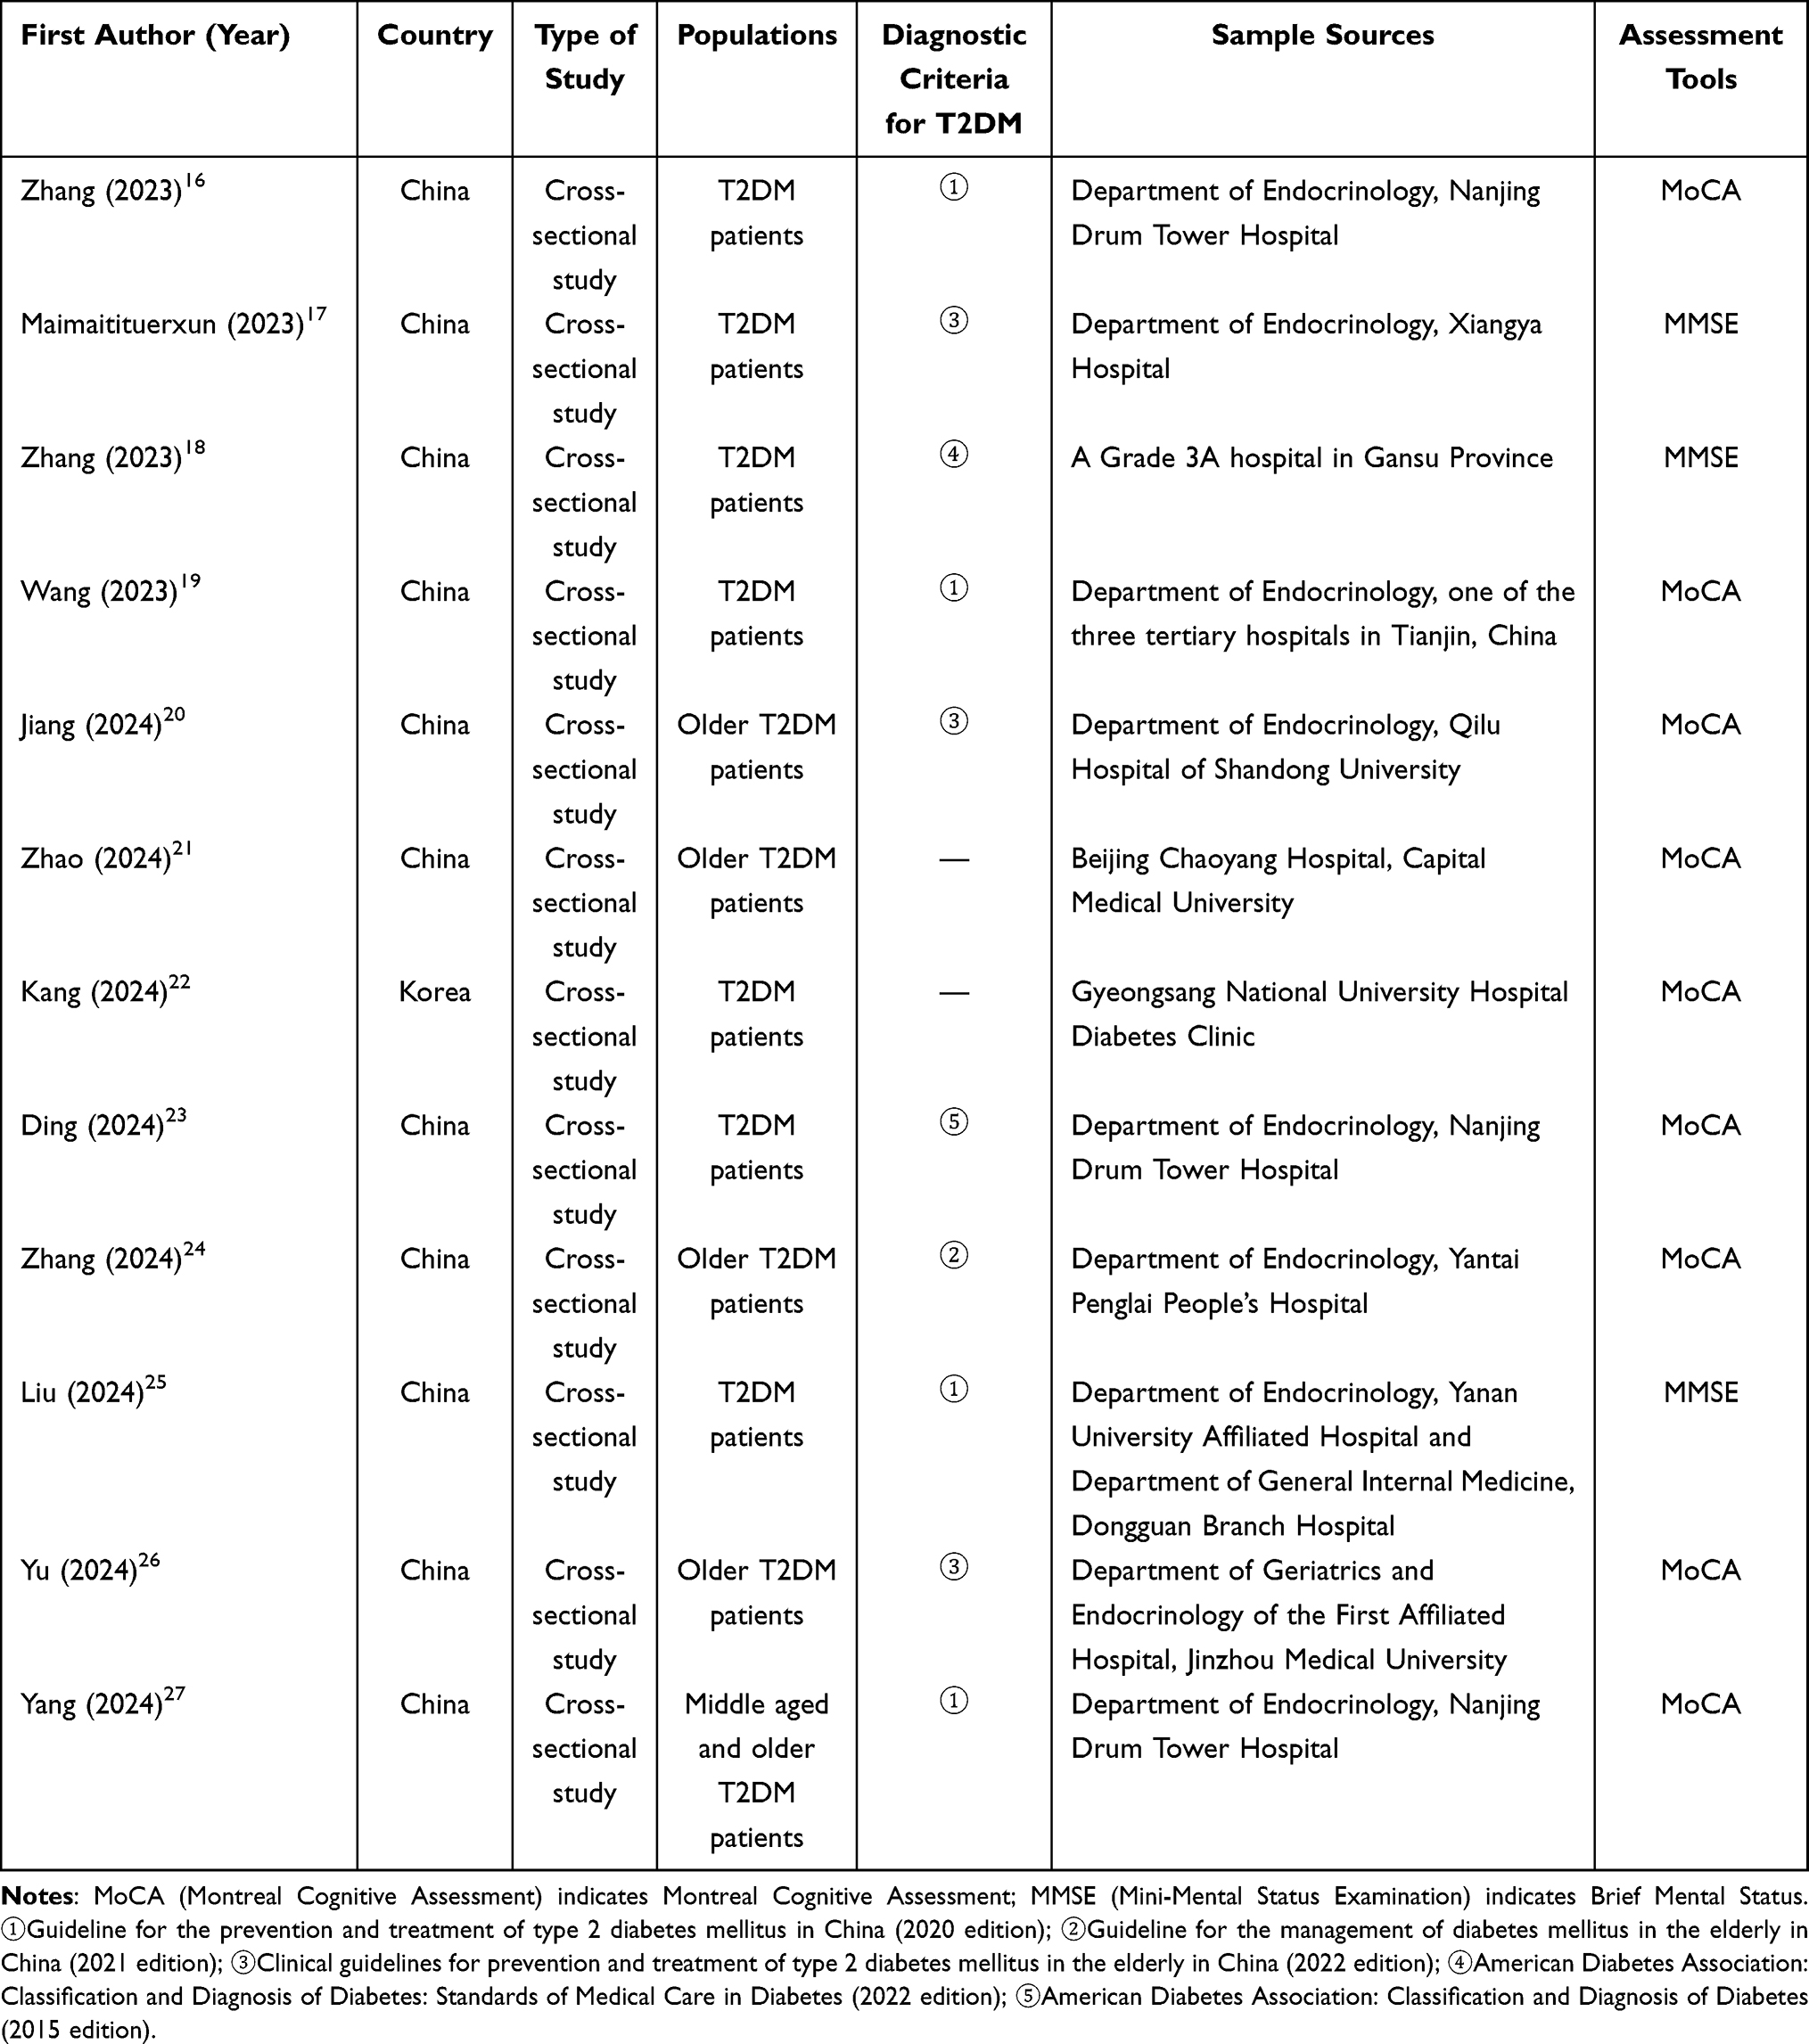 |
Table 1 Basic Characteristics of the Included Literature |
Establishment of the Models
The present study encompasses twelve papers, comprising a total of 17 predictive models. Of these, eleven studies constructed models based on logistic regression analysis.16–23,25–27 The total number of T2DM patients included in the studies ranged from 124 to 1319, with the incidence of MCI varying from 6.10% to 60.78%. Five studies reported missing data and treatment methods.17,19,22–24 Of these, three studies excluded missing data directly,17,20,23 while two studies employed multiple interpolation or a combination of methods to process the missing data.19,24(Table 2).
 |
Table 2 Establishment of a Risk Prediction Model for MCI in Patients with T2DM |
Performance of the Model and Predictors
The area under the curve (AUC) of the subjects’ operating characteristics was reported to be range from 0.743 to 0.987 across twelve studies. Furthermore, all models exhibited favorable predictive performance, with an AUC exceeding 0.70. Five studies employed both calibration curve plots and Hosmer-Lemeshow (H-L) goodness-of-fit tests to assess the calibration of the models.18,20,23,26,27 Four studies utilized either calibration graphs or H-L goodness-of-fit tests to evaluate model calibration.17,21,22,25 Nine studies conducted internal validation of the models.17,18,20–23,25–27 Two studies conducted external validation of the models.26,27 (Table 2). Ultimately, 17 models reported between 3 and 8 predictors, with age, education, duration of T2DM, depression, and hemoglobin level (HbA1c) appearing with greater frequency (Table 3).
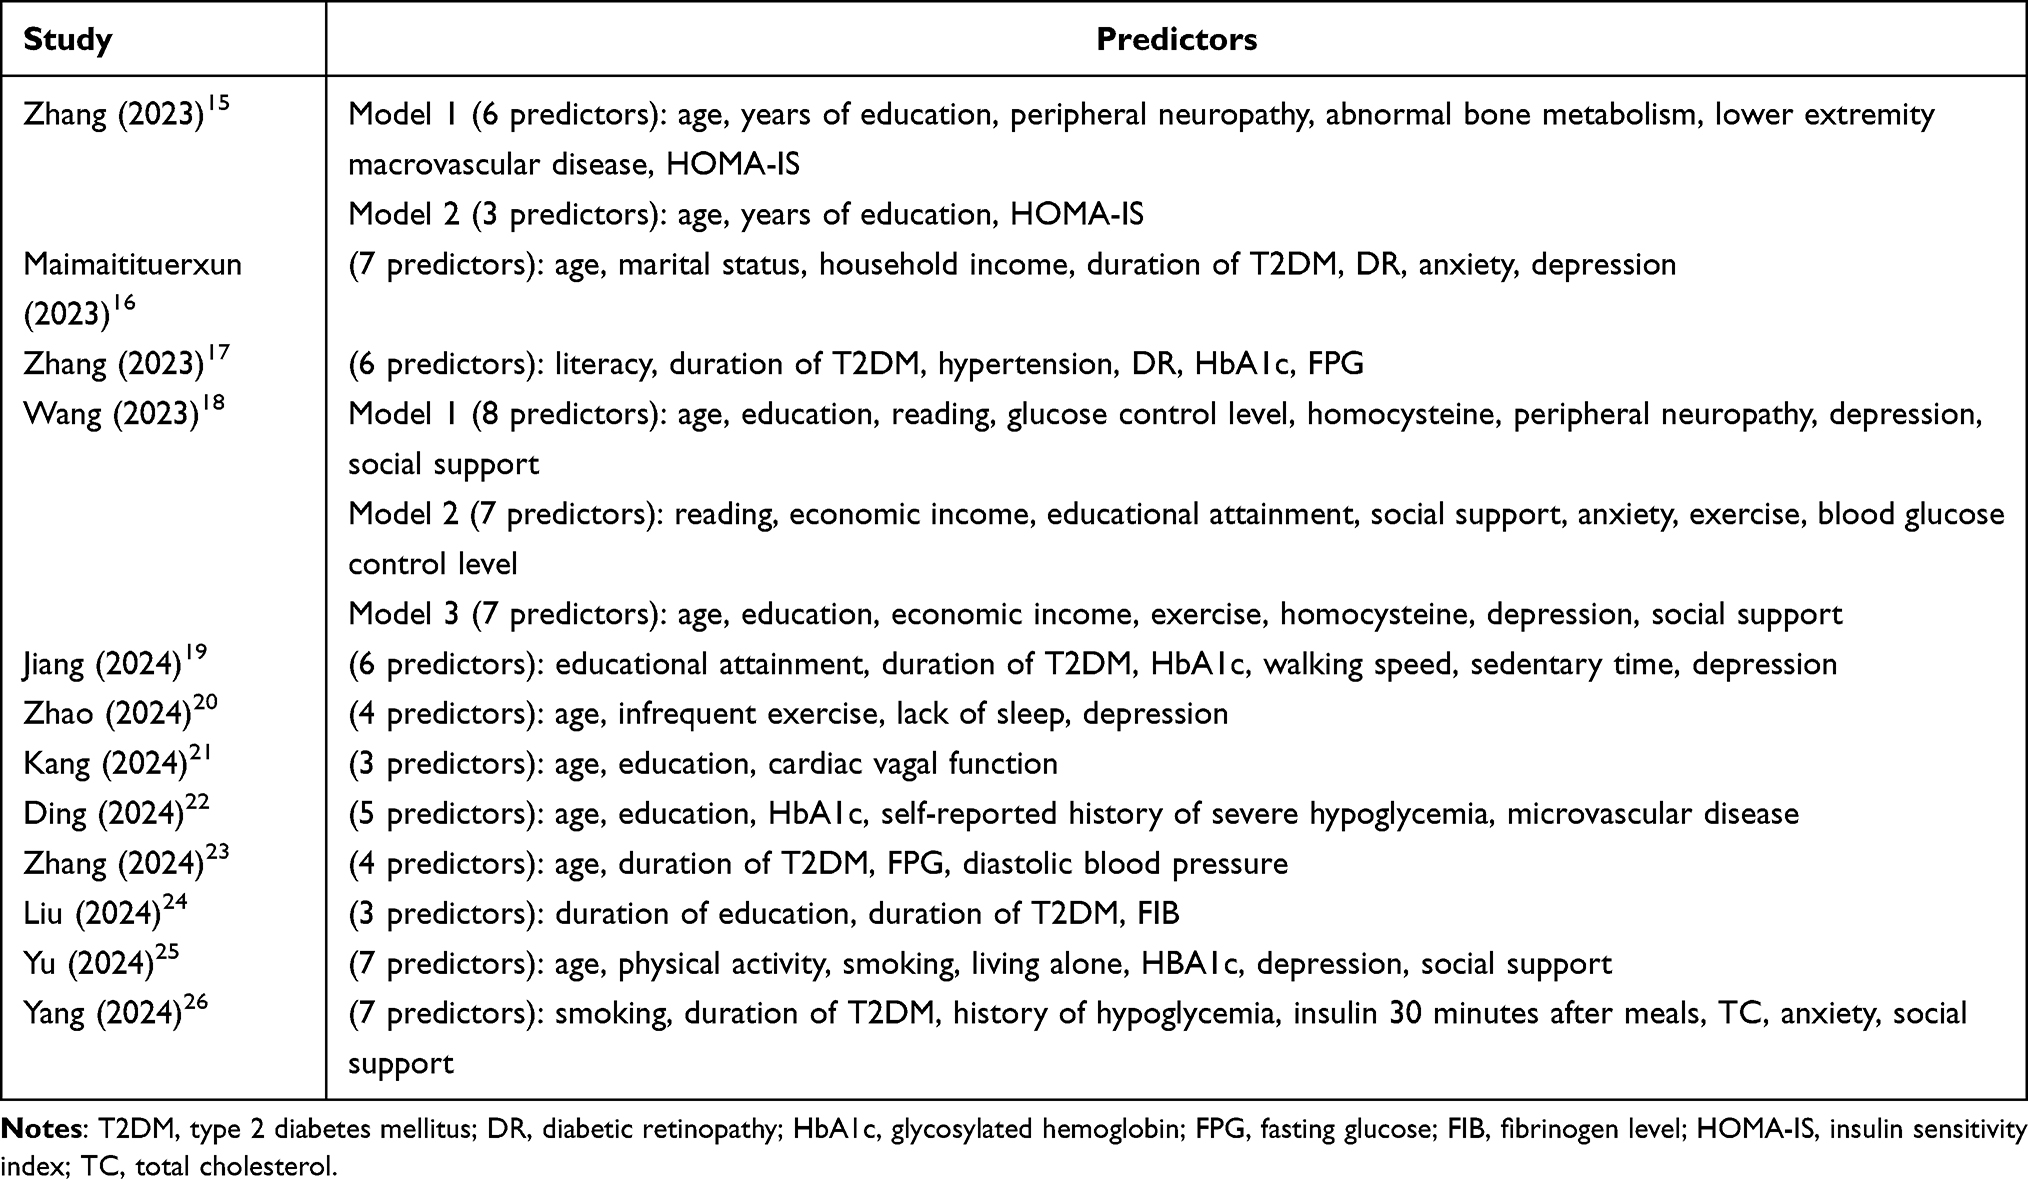 |
Table 3 Predictors of MCI Risk Prediction Model in T2DM Patients |
Literature Quality Assessment
A total of twelve studies were included in this study. The AHRQ evaluation revealed that four of these papers exhibited a high level of quality,17,19,22,23 while the remaining eight studies demonstrated a moderate level of quality.16,18,20,21,24–27 However, the PROBAST evaluation indicated that all the literature was at a high risk of bias. In terms of outcome areas, only three study was classified as low risk,17,26,27 while the others were classified as unclear. This classification was primarily due to the lack of clarity regarding the risk of bias, as the researchers did not provide sufficient information on whether the outcome assessors were blinded. Regarding the domain of data analysis, all studies were identified as being at high risk of bias. The number of events per independent variable in all studies had an events per variable (EPV) ratio of less than 20, indicating an inadequate sample size. Additionally, six studies converted continuous variables into categorical variables for analysis.17,19–21,26,27 Three studies excluded missing data outright.17,22,23 Only three of the 17 models employed Lasso analysis to screen predictors,16,26,27 while all utilized single-factor analysis. Notably, none of the studies reported any complexity in the data. Furthermore, only three studies did not provide information on the model calibration,16,19,24 and two studies assessed calibration using only H-L goodness-of-fit tests.21,25 Additionally, three studies did not indicate whether the model was internally validated,16,21,25 and three studies used randomized split validation for internal validation.18,19,23 The results of the overall suitability evaluation of the model indicated that all studies were at low risk regarding suitability (Table 4).
 |
Table 4 Evaluation of Risk of Bias and Applicability of the Included Literature |
Meta-Analysis Results
Some of the predictive models included in the literature lacked validation or provided insufficient data regarding the area under the curve (AUC). Ultimately, only six studies were included in the meta-analysis.17–20,23,26 One of these studies developed and validated multiple models using various modeling approaches,19 but all were based on the same sample. Consequently, only one model developed using logistic regression was included in the meta-analysis. The analysis was conducted using a random-effects model, yielding a combined AUC value of 0.854 (95% CI: 0.815–0.894) and a heterogeneity test I2 of 75.3% (P = 0.001). These results indicate a significant degree of heterogeneity among the studies (Figure 2). To identify the source of the observed heterogeneity, further subgroup analyses were conducted based on the type of assessment tool. The results of the analysis demonstrated that the I² of the heterogeneity test for the MMSE group was 0.0% (P = 0.454), indicating the absence of significant heterogeneity among the studies. In contrast, the I² of the heterogeneity test for the MoCA group was 83.1% (P < 0.001), indicating the presence of significant heterogeneity. The observed heterogeneity suggests that the type of assessment tool was not a source of variability in the analyzed results (Figure 3). Furthermore, the combined results of both subgroups exhibited a statistically significant outcome, indicating that the MCI prediction models for T2DM patients in the study were effectively differentiated, regardless of whether the MMSE or MoCA assessment tools were utilized. Upon exclusion of individual studies from the sensitivity analysis, the results remained consistent with the original combined results, indicating a certain degree of robustness (Figure 4). The results of Egger’s test demonstrated the absence of publication bias (P=0.462 > 0.05).
 |
Figure 2 Forest plot of AUC Meta-analysis of MCI prediction model in T2DM patients. |
 |
Figure 3 AUC subgroup analysis plot of the MCI prediction model in T2DM patients. |
 |
Figure 4 AUC sensitivity analysis of MCI prediction model for T2DM patients. |
Discussion
MCI Risk Prediction Models for T2DM Patients are Still in the Developmental Phase
In recent years, prediction models for the risk of MCI in patients with T2DM have increasingly become a focus point of research within the academic community, both domestically and internationally. This study presents a comprehensive analysis of 17 prediction models derived from 12 papers, all of which demonstrated high predictive efficacy (AUC > 0.7). Among these, six validated models exhibited a combined AUC value of 0.854. However, significant heterogeneity was observed in the analysis results. It was noted that the Mini-Mental State Examination (MMSE) exhibits high sensitivity for diagnosing dementia; however, its specificity and sensitivity as a screening tool for MCI are limited and influenced by the educational level of the subjects.28 In contrast, the Montreal Cognitive Assessment (MoCA) demonstrates enhanced sensitivity and specificity, even identifying patients with MCI who score within the normal range on the MMSE.9 This suggests that the choice of different MCI assessment instruments may impact the outcomes. Nevertheless, the subgroup analysis in this study did not identify the assessment tool as a source of heterogeneity, which may be attributed to the limited number of models included in the meta-analysis and the small number of studies in each subgroup. Consequently, further investigation into whether different assessment tools affect the predictive performance of models is warranted.
Despite the improved predictive efficacy of the models, shortcomings in study design and statistical methodology resulted in a heightened risk of bias across all studies. Regarding the outcome domain, nine studies did not report blinding in outcome determination,16,18–25 leaving the risk of bias remains uncertain. The lack of blinding not only compromises the internal validity of the studies but also undermines the objectivity and generalizability of the results. Future studies should provide comprehensive details regarding the blinded evaluations of predictor indicators. This includes ensuring mutual blinding between predictor and outcome indicators, as well as minimizing the potential for subjective judgments among predictors. In terms of data analysis, all studies were found to be at high risk of bias. The EPV for each study was less than 20, indicating that the sample size was insufficient. This limitation could easily lead to overfitting of the model, thereby affecting prediction accuracy. Future studies should aim to increase the sample size, utilize external data for validation, or adopt statistical methods that are appropriate for small samples. Additionally, three studies did not validate their models,16,21,25 and three studies employed random splitting for model validation,18,19,23 which may increase the risk of overfitting and reduce the predictive accuracy of the models. Internal validation evaluates the consistency of a model’s performance. Common methods for internal validation include random split validation, K-fold cross-validation, and bootstrap methods. Future researchers should consider factors such as sample size, model complexity, and intended application when selecting appropriate internal validation techniques. External validation reflects the generalizability of the model. While it does not directly validate internal validity, external validation is essential for confirming the model’s generalizability and extrapolation. This process necessitates validation with datasets that differ from the original study, which may be either temporally and geographically independent or entirely distinct, in order to provide reliable estimates of the model’s performance on other datasets. Three studies excluded missing data directly,17,22,23 and inappropriate treatment of missing data may lead to overestimation of model discrimination. Researchers are advised to select suitable processing strategies, such as multiple imputation, which has been shown to outperform other methods in terms of bias and precision, depending on the characteristics of the data and the objectives of the research. Six studies converted continuous variables into categorical variables,17,19–21,26,27 and nine studies used single-factor analysis to screen predictors,16,18–25 which may have led to the omission of significant predictors. In conclusion, the research and development of MCI risk prediction models for patients with T2DM is an ongoing process that necessitates continuous optimization and updates to align with advancements in medical technology and the evolving needs of clinical practice.
Analysis of Risk Predictors for MCI in Patients with T2DM
The predictive models in this study identified several common predictors, with high-frequency predictors proving critical for the rapid identification of individuals at higher risk of MCI in patients with T2DM. The high-frequency predictors most frequently identified by the models included age, education, duration of T2DM, depression, and glycosylated hemoglobin (HbA1c). Age is an irreversible risk factor that significantly impacts the development of MCI in patients with T2DM. Cognitive decline occurs at a rate approximately 50% faster in elderly patients with T2DM compared to the general elderly population.29 This phenomenon may be attributed to the increased likelihood of older patients with T2DM accumulating diabetes-related risk factors, such as chronic poor glycemic control, insulin resistance, and vascular complications, which accelerate cognitive decline.30,31 Additionally, degenerative changes in the brain associated with aging, such as a reduction in neural cells and diminished nerve conduction velocity, interact with diabetic pathological processes, potentially exacerbating cognitive impairment.32,33 Furthermore, a high level of education served as a protective factor for cognitive function in patients with T2DM. Higher educational attainment is closely linked to an enhanced cognitive reserve, which improves an individual’s health awareness and disease self-management abilities, effectively delaying the external manifestations of cognitive decline.30,32,33 Furthermore, disease duration is the most significant risk factor for the emergence of MCI in patients with T2DM. A substantial increase in the risk of MCI has been demonstrated with the prolongation of T2DM disease duration.34 This may be associated with chronic ischemia and hypoxia of brain tissue due to long-term metabolic disorders, as well as a notable increase in the levels of inhibitory neurotransmitters.33,35 Moreover, prolonged depressive disorders not only intensify psychological stress and impair brain structures through the action of stress hormones, such as cortisol, particularly affecting critical areas for cognition, such as the hippocampus; they may also alter patients’ daily routines by reducing social and physical activities, which diminishes cognitive stimulation in the brain and consequently impacts cognitive functions.29 A negative correlation has been observed between HbA1c levels and cognitive function test scores. For each 1% increase in HbA1c levels in patients with T2DM, test scores associated with cognitive decline are significantly lower.29,34 This phenomenon may be attributed to chronic hyperglycemia and the accumulation of advanced glycosylation end-products (AGEs) resulting from it. AGEs exert toxic effects on nerve cells through multiple mechanisms, thereby accelerating cognitive decline.29,30,32,35–37 Additionally, the history of hypoglycemia, low-density lipoprotein cholesterol levels, and monthly household income were identified as risk factors for the development of MCI in patients with T2DM this study. Future research should consider multiple dimensions when exploring potential predictors of MCI risk in patients with T2DM. Key factors to examine include age, educational background, disease duration, psychological status, and biochemical indicators. It is essential to emphasize that studies should not focus solely on the isolated effects of individual factors. Instead, researchers should investigate how these risk factors interact with one another and the cumulative impact of these interactions on the risk of MCI. This approach will improve the accuracy predictions and assessments related to the potential risk of developing MCI in patients with T2DM. Consequently, it will facilitate the development of more precise prevention and intervention strategies for clinical practice.
Implications for Future Research
Given the limitations of current MCI risk prediction models for patients with T2DM related to study design and statistical methods, there is generally a high risk of bias. Existing models are mostly constructed based on cross-sectional studies, which may encounter several limitations, including unclear causality, restricted generalizability, an inability to capture dynamic changes, and sample size constraints. These factors can adversely affect the accuracy and utility of the models. In the future, prospective study designs should be implemented to investigate causality through multi-center, real-time data collection. Additionally, it is essential to validate the effectiveness of these models in clinical settings to ensure it can effectively support practical medical decision-making. Simultaneously, a mechanism for the dynamic updating of the model should be established to incorporate the latest medical research findings promptly, thereby maintaining the model’s relevance and accuracy. Furthermore, establishing a data-sharing platform will facilitate data comparison and validation across studies, promoting standardization in data collection and reporting. This approach will enhance the generalizability and replicability of study results. The objective of predictive modeling is to provide a foundation for clinical interventions. Consequently, the development of these models should be closely integrated with early interventions to more effectively manage the risk of MCI in patients with T2DM. To achieve this goal, future research should promote interdisciplinary collaboration and integrate expert knowledge from various fields, including endocrinology, neurology, epidemiology, and statistics. Such collaboration will facilitate a more comprehensive study design and enable a deeper interpretation of results, ultimately enhancing the accuracy, generalizability, and applicability of predictive models in clinical setting. This approach will ensure that these models maximize their utility in real-world applications.
Limitations
In this systematic evaluation, we conducted a comprehensive review of MCI risk prediction models for patients with T2DM, but it is important to acknowledge several limitations that may impact our conclusions: (1) This study includes only literature published before November 2024, which means our findings may not reflect scientific developments that have occurred since then. As medical research continues to advance, we recognize that our existing conclusions may need to be updated in light of the latest findings. (2) Although we evaluated the overall predictive performance of the models, the variability in data processing methods across the original studies imposed limitations on our in-depth analyses at the predictor level. This variability may have hindered our comprehensive understanding of the models’ predictive power. Future research should address these limitations by enhancing the consistency and comparability of studies through the standardization of data collection and analysis methods. (3) Most of the predictive models included in this study were based on research conducted within Chinese populations. This geographic bias may have constrained our insight into the variations in MCI risk prediction across different populations. Consequently, our conclusions may not fully represent of the specifics of various populations worldwide. Despite these limitations, our systematic evaluation offers a valuable perspective on the current state of MCI risk prediction models in patients with T2DM. We recommend that future studies expand the scope of literature screening, update the timeframe, harmonize statistical methods, and consider the representation of diverse ethnic groups to obtain more comprehensive and accurate findings.
Conclusion
The twelve papers and seventeen prediction models included in this study exhibited AUC values ranging from 0.743–0.987. The meta-analysis revealed a combined AUC value of 0.854, indicating that the models demonstrated a good overall performance; however, they generally presented a high risk of bias. It is recommended that future research involve prospective cohort studies with large sample sizes and multicenter designs to enhance the generalizability and applicability of the results. Additionally, researchers should adhere to the PROBAST assessment framework to optimize study design and follow the TRIPOD reporting statement. A comprehensive report on the model construction process should be provided to further refine the MCI risk prediction model for patients with T2DM, thereby offering a more robust scientific basis for clinical decision-making.15,38
Data Sharing Statement
The data used and analyzed in this study can be obtained by contacting the corresponding author.
Ethics Approval and Informed Consent
This study is based on previously conducted research and does not include any new studies involving human participants or animals performed by any of the authors.
Funding
This study was supported by the Zhenjiang ‘Jinshan Talents’ High-level Leading Talents Training Programme (YLJ202103). The funder was not involved in the study’s design, data extraction and analysis, article writing, or publication preparation.
Disclosure
All authors declare that they have no conflicts of interest.
References
1. Sun H, Saeedi P, Karuranga S, et al. IDF diabetes atlas: global, regional and country-level diabetes prevalence estimates for 2021 and projections for 2045 [J]. Diabet Res Clin Pract. 2022;183:109119. doi:10.1016/j.diabres.2021.109119
2. Chinese Medical Association Diabetes Branch. Guidelines for the prevention and treatment of type 2 diabetes in China (2020 edition) [J]. Chinese J Diab. 2021;04:315–409.
3. Bellia C, Lombardo M, Meloni M, et al. Diabetes and cognitive decline [J]. Adv Clin Chem. 2022;108:37–71.
4. Mankovsky B, Zherdova N, VAN DEN BERG E, et al. Cognitive functioning and structural brain abnormalities in people with Type 2 diabetes mellitus [J]. Diabet Med. 2018;35(12):1663–1670. doi:10.1111/dme.13800
5. Cukierman-Yaffe T, Gerstein HC, Miller ME, et al. The relationship between the score on a simple measure of cognitive function and incident CVD in people with diabetes: a post hoc epidemiological analysis from the ACCORD-MIND study [J]. J Clin Endocrinol Metab. 2017;102(9):3218–3225. doi:10.1210/jc.2016-3480
6. China Dementia and Cognitive Impairment Diagnosis and Treatment Guideline Writing Group, Cognitive Impairment Disease Specialized Committee of Neurologists Branch of Chinese Physicians Association. China dementia and cognitive impairment diagnosis and treatment guidelines (V): diagnosis and treatment of mild cognitive impairment [J]. Chinese Med J. 2018;98(17):1294–1301.
7. Bai W, Chen P, Cai H, et al. Worldwide prevalence of mild cognitive impairment among community dwellers aged 50 years and older: a meta-analysis and systematic review of epidemiology studies [J]. Age Ageing. 2022;51(8). doi:10.1093/ageing/afac173.
8. Ware EB, Morataya C, Fu M, et al. Type 2 diabetes and cognitive status in the health and retirement study: a Mendelian randomization approach [J]. Front Genetics. 2021;12: 634767.
9. You Y, Liu Z, Chen Y, et al. The prevalence of mild cognitive impairment in type 2 diabetes mellitus patients: a systematic review and meta-analysis [J]. Acta Diabetol. 2021;58(6):671–685. doi:10.1007/s00592-020-01648-9
10. Ciudin A, Simo-Servat O, Pascual CH, et al. Type 2 diabetes is an independent risk factor for dementia conversion in mild cognitive impairment patients [J]. Diabetes. 2016;65:A386.
11. Ma F, Wu T, Miao R, et al. Conversion of mild cognitive impairment to dementia among subjects with diabetes: a population-based study of incidence and risk factors with five years of follow-up [J]. J Alzheimers Dis. 2015;43(4):1441–1449. doi:10.3233/JAD-141566
12. Moons KG, Hooft L, WILLIAMS K, et al. Implementing systematic reviews of prognosis studies in Cochrane [J]. Cochrane Database Syst Rev. 2018;10(10):ed000129. doi:10.1002/14651858.ED000129
13. Moons KG, De Groot JA, Bouwmeester W, et al. Critical appraisal and data extraction for systematic reviews of prediction modelling studies: the CHARMS checklist [J]. PLoS Med. 2014;11(10):e1001744. doi:10.1371/journal.pmed.1001744
14. Zeng XT, Liu H, Chen X, et al. Meta-analysis series IV: a quality assessment tool for observational studies [J]. Chinese J Evidence-Based Cardiovasc Med. 2012;4(04):297–299.
15. Moons KGM, Wolff RF, Riley D, et al. PROBAST: a tool to assess risk of bias and applicability of prediction model studies: explanation and elaboration. Ann Intern Med. 2019;170(1):w1–w33. doi:10.7326/M18-1377
16. Zhang N, Chen Y, Zhang H, et al. Construction of logistic regression and decision tree prediction model for the risk of mild cognitive impairment in type 2diabetes patients [J]. Chinese JPract Nurs. 2023;39(32):2514–2520.
17. Maimaitituerxun R, Chen W, Xiang J, et al. The use of nomogram for detecting mild cognitive impairment in patients with type 2 diabetes mellitus [J]. J Diabetes. 2023;15(5):448–458. doi:10.1111/1753-0407.13384
18. Zhang XL. Construction of a Risk Prediction Model for Mild Cognitive dysfunction in Patients with Type 2 Diabetes Mellitus. Gansu: Gansu University of Traditional Chinese Medicine; 2023. D.
19. Wang ZH. Construction and Validation of a Risk Prediction Model for Mild Cognitive Impairment in Patients with Type 2 Diabetes Mellitus. Tianjin: Tianjin University of Traditional Chinese Medicine; 2023.
20. Jiang Y, Liu X, Gao H, et al. A new nomogram model for the individualized prediction of mild cognitive impairment in elderly patients with type 2 diabetes mellitus [J]. Front Endocrinol. 2024;15: 1307837.
21. Zhao L, Ma Y, Li W. Study on the construction of risk prediction model and efficacy validation of cognitive decline in elderly patients with type 2 diabetes [J]. J Men Health. 2024;20(3):99–105.
22. Kang H, Kim M, Kim J, et al. Prediction model for mild cognitive impairment in patients with type 2 diabetes using the autonomic function test [J]. Neurol Sci. 2024;45:3757–3766. doi:10.1007/s10072-024-07451-6
23. Ding Q, Yu C, Xu X, et al. Development and validation of a risk score for mild cognitive impairment in individuals with type 2 diabetes in China: a practical cognitive prescreening tool [J]. Diab Metab Syndrome Obes. 2024;17:1171–1182. doi:10.2147/DMSO.S448321
24. Zhang HX, Zhang YF, ZL Xie, et al. A machine learning-based risk assessment model for mild cognitive impairment in elderly diabetic patients [J]. Chinese J Dis Contr. 2024;28(03):284–9+309.
25. Liu ML, Bian HY. Construction of a risk prediction model for cognitive dysfunction in patients with type 2 diabetes mellitus [J]. Health Career Edu. 2024;42(03):153–157.
26. Yu Q, Jiang X, Yan J, et al. Development and validation of a risk prediction model for mild cognitive impairment in elderly patients with type 2 diabetes mellitus [J]. Geriatr Nurs. 2024;58:119–126. doi:10.1016/j.gerinurse.2024.05.018
27. Yang B, Ye HF, Xiang LW, et al. Construction and validation of a risk prediction model for mild cognitive impairment in middle-aged and older patients with type 2 diabetes mellitus [J]. J Nurs. 2024;31(13):18–23.
28. Zhang LX, Liu XQ. Advances in screening and assessment tools for mild cognitive impairment in the elderly (Review) [J]. Chinese J Mental Health. 2008;02:129–132.
29. Chinese Medical Association Endocrinology Branch. Expert consensus on cognitive dysfunction in patients with diabetes mellitus [J]. Chinese J Diab. 2021;07:678–694.
30. Zhao L, Han C, Zheng Z, et al. Risk of mini-mental state examination (MMSE) decline in the elderly with type 2 diabetes: a Chinese community-based cohort study. BMC Endocr Disord. 2020;20(1):129. [J]. doi:10.1186/s12902-020-00606-4
31. Li CH, Guo X, Dou J, et al. Investigation and analysis of cognitive dysfunction and its influencing factors in patients with type 2 diabetes mellitus [J]. J Jilin Univ. 2018;44(02):431–437.
32. Ma J, Zhang MY, Zhang SW, et al. Study on factors associated with mild cognitive dysfunction in community-managed elderly patients with type 2 diabetes mellitus [J]. Chinese Fam Med. 2024;27(16):1984–1989.
33. Xue CH, Guo HJ, Li MM, et al. Meta-analysis of factors affecting mild cognitive dysfunction in patients with type 2 diabetes mellitus [J]. Chinese J of Evidence-Based Med. 2022;22(05):568–574.
34. Albai O, Frandes M, Timar R, et al. Risk Factors for Developing Dementia in Type 2 Diabetes Mellitus Patients with Mild Cognitive Impairment. J. Neuropsychiatr Dis Treat; 2019. Vol. 15. 167–175.
35. Yu SJ, Wang MJ, Chen L, et al. Factors affecting mild cognitive dysfunction in elderly patients with type 2 diabetes mellitus [J]. J Shandong Univ. 2022;60(11):108–112.
36. Chinese Society of Endocrinology. Chinese Adult Type 2 Diabetes Mellitus Treatment Targets Study Working Group. Chinese expert consensus on the prevention and treatment of cognitive dysfunction in patients with type 2 diabetes mellitus [J]. Chin J Endocrinol Metab. 2022;38(6):453–464.
37. Yu CC, Zhang Z, Bi Y. Reflections on the early prevention and control of diabetes-related cognitive dysfunction [J]. Chinese J Diab. 2023;15(9):797–803.
38. Collins GS, Reitsma JB, Altman DG, et al. Transparent reporting of a multivariable prediction model for individual prognosis or diagnosis (TRIPOD): the TRIPOD statement [J]. BMJ. 2015;350:g7594. doi:10.1136/bmj.g7594
 © 2024 The Author(s). This work is published and licensed by Dove Medical Press Limited. The
full terms of this license are available at https://www.dovepress.com/terms.php
and incorporate the Creative Commons Attribution
- Non Commercial (unported, 3.0) License.
By accessing the work you hereby accept the Terms. Non-commercial uses of the work are permitted
without any further permission from Dove Medical Press Limited, provided the work is properly
attributed. For permission for commercial use of this work, please see paragraphs 4.2 and 5 of our Terms.
© 2024 The Author(s). This work is published and licensed by Dove Medical Press Limited. The
full terms of this license are available at https://www.dovepress.com/terms.php
and incorporate the Creative Commons Attribution
- Non Commercial (unported, 3.0) License.
By accessing the work you hereby accept the Terms. Non-commercial uses of the work are permitted
without any further permission from Dove Medical Press Limited, provided the work is properly
attributed. For permission for commercial use of this work, please see paragraphs 4.2 and 5 of our Terms.