")
Back to Journals » Cancer Management and Research » Volume 17
Role of EFNAs in Shaping the Tumor Immune Microenvironment and Their Impact on Pancreatic Adenocarcinoma Prognosis
Authors Li YC, Zhang L, Wang YT , Hu H, Zhang ZY, Nie QQ, Zuo CJ
Received 18 November 2024
Accepted for publication 20 March 2025
Published 2 April 2025 Volume 2025:17 Pages 693—712
DOI https://doi.org/10.2147/CMAR.S502401
Checked for plagiarism Yes
Review by Single anonymous peer review
Peer reviewer comments 3
Editor who approved publication: Professor Seema Singh
Yu-Chao Li,1,* Lu Zhang,1,* Yi-Ting Wang,1,* Hao Hu,1 Ze-Yu Zhang,1 Qian-Qian Nie,2 Chang-Jing Zuo1
1Department of Nuclear Medicine, Changhai Hospital, Naval Medical University, Shanghai, People’s Republic of China; 2Department of Central Laboratory, Changhai Hospital, Naval Medical University, Shanghai, People’s Republic of China
*These authors contributed equally to this work
Correspondence: Chang-Jing Zuo, Email [email protected] Qian-Qian Nie, Email [email protected]
Purpose: Due to the highly heterogeneous and immunosuppressed tumor microenvironment (TME), pancreatic adenocarcinoma (PAAD) has limited therapeutic options and an abysmal prognosis. Ephrin A 1– 5 (EFNA1-5) have been shown to regulate tumorigenesis and metastasis in various cancers, but its role in PAAD remains unclear.
Methods: We comprehensively analyzed EFNA gene expression levels in pan-cancer and PAAD using the GEPIA and HPA databases. Then, we assessed the prognostic value of EFNA1-5 using the Kaplan-Meier plotter and nomogram model. Further exploration of the association of EFNA1-5 with clinicopathological features of PAAD used information from the UALCAN database, and the TIMER dataset was used to reveal the correlation between EFNA1-5 and the tumor immune microenvironment (TIME) of pancreatic cancer. In addition, cBioPortal Databases, GSEA, and GSCALite were used to explore gene changes, protein interactions, and biological functions. Finally, the oncogenic effect of EFNA5 was verified in vivo and in vitro.
Results: The expression levels of EFNA1-5 were significantly upregulated in PAAD. The expression of EFNA1/3/4/5 were significantly associated with overall survival (OS) and relapse-free survival (RFS) in PAAD patients. The high expression of EFNA2-5 were related to poor clinical features, such as higher tumor stage or grade and a wider range of lymph node metastasis. EFNA1-5 were closely associated with immune cell infiltration, CAFs, and MDSCs expression. Furthermore, EFNA5 is an independent risk factor for poor prognosis in PAAD patients, and it can promote the malignant progression of pancreatic cancer in vitro and in vivo.
Conclusion: Differential expression of EFNA1-5 is associated with TIME in pancreatic cancer, predicts different survival outcomes, and maybe a novel prognostic marker reflecting an immunosuppressive state and a potential therapeutic target.
Keywords: EFNA, pancreatic adenocarcinoma, PAAD, tumor microenvironment, TME, immune cell infiltration
Graphical Abstract:

Introduction
Pancreatic cancer is a highly malignant tumor of the digestive tract. Due to its insidious location, atypical early clinical symptoms, and rapid disease progression, the efficacy of various treatments are poor, and the five-year survival rate is still less than 5%.1,2 Worldwide, the overall incidence and mortality rates of pancreatic cancer are increasing year by year,3,4 with approximately 85% of cases being Pancreatic adenocarcinoma (PAAD).1,5,6 The objective of this study was to identify a promising molecular target to offer novel insights for addressing the therapeutic challenges associated with PAAD.
In PAAD, tumor components are dense with significant fibrosis. The accumulation of myeloid cells is abundant while T cells are relatively absent, forming a nutrient-poor immunosuppressive tumor microenvironment (TME), which is conducive to tumor cell survival, proliferation, invasion, and metastasis, making it difficult for common drugs to enter the tumor to take effect, leading to drug resistance and failure of radiotherapy, chemotherapy.7,8 Despite breakthroughs in immunotherapeutic strategies in multiple cancer types over the past decade, attempts to suppress immune checkpoints9 or eliminate the stromal barrier to drug delivery10,11 have shown limited and disappointing results in pancreatic cancer.12 Currently, the major impediments to pancreatic cancer immunotherapy are activated fibroblasts and myeloid cells with immunosuppressive functions within the TME, such as cancer-associated fibroblasts (CAFs) and myeloid-derived suppressor cells (MDSCs).13 CAFs can regulate MDSCs by secreting cytokines and inhibit the function of effector T cells through multiple pathways.14 These hindrances must be overcome before a T-cell response occurs. Therefore, finding new molecular targets to remodel the TME against PAAD is significant for guiding future therapeutic strategies.
The Eph receptor subfamily is the largest branch of the Receptor Tyrosine Kinases (RTK) family,15 which plays an essential role in cell proliferation, differentiation, and embryonic development.16 Ephrin (EFN) are ligand of the Eph receptors, which can be divided into two isoforms according to their structure and membrane attachment mode: Ephrin A isoforms are anchored to the cell membrane by glycosyl phosphatidylinositol linkage (GPI-linkage), with five species (A1-A5); Ephrin B isoforms are single transmembrane proteins, with three species (B1-B3).17 Previous studies have shown that Eph/Ephrin signal transduction axes play critical roles in biological processes such as axon development, neural network formation, capillary sprouting, cell migration, and adhesion.18–20 In particular, some Eph / Ephrin members have been proven to be differentially expressed in a variety of tumors (lung,21 breast,22,23 colon,24 liver,25,26 melanoma,27,28 prostate,29 nasopharyngeal,30,31 lymphoma32,33), suggesting that they can exert pro- or anti-cancer effects depending on the microenvironment and are potential targets for cancer therapy.34 Therefore, it is of great clinical significance to explore the function and mechanism of the Eph receptor and its ligand (Ephrin) in tumor genesis and development, and the role of this family in PAAD has not yet been reported, which prompted us to analyze the unique functional and prognostic role of EFNA in PAAD.
This is the first study to fully integrate the analysis of the expression pattern and prognostic value of EFNA1-5 in PAAD using a bioinformatics approach. Through comprehensively analyzing the data information in large-scale open databases such as GEPIA, HPA, Cbioportal, UALCAN, and TCGA, the correlation between EFNA gene expression and immune cell infiltration, clinicopathological features, and clinical outcomes was explored. The expression levels of the identified key gene were validated in human pancreatic cancer cell lines. The impact of targeted silencing of this gene on the proliferation, invasion, and migration of pancreatic cancer cells was assessed in vitro. Additionally, in vivo tumorigenicity experiments were conducted using nude mice. These findings may offer valuable insights for the development of future targeted therapies for PAAD.
Materials and Methods
Gene Expression Profiling Interactive Analysis
GEPIA (http://gepia.cancer-pku.cn/detail.php) is a newly developed interactive web server for analyzing the RNA sequencing expression data of 9,736 tumors and 8,587 normal samples from the TCGA and the GTEx projects using a standard processing pipeline,35 which can be used for cancer and normal gene expression profiling and interactive analyses. Transcriptional mRNA expression data for 5 EFNAs in various cancers and their corresponding normal adjacent tissues were retrieved from GEPIA. Meanwhile, GEPIA was used for the transcriptional mRNA expression of EFNAs between PAAD tissues and normal tissues. p < 0.01 was considered statistically significant. This study has been approved by the Ethics Committee of the First Affiliated Hospital of Naval Medical University, and the ethics review number is CHEC2021-071. The study has been registered in the Chinese Clinical Trial Registry (registration number: ChiCTR2100052378). We promise that all studies involving human data have passed the ethical review and complied with the regulations.
Human Protein Atlas
The Human Protein Atlas (https://www.proteinatlas.org) is an online tool including immunohistochemistry (IHC) expression data for protein distribution and expression in 20 cancer tissues, 48 healthy human tissues, 47 cell lines, and 12 blood cell types, which can be used to query protein expression in tissue atlases and pathology atlases.36 The protein expression levels of EFNAs between PAAD tissues and normal tissues were obtained from this database.
Kaplan–Meier Plotter
The Kaplan–Meier plotter (http://kmplot.com/analysis/) can assess the correlation between the expression of 30,000 genes on survival in 21 cancer types.37 To evaluate the prognostic value of the dysregulated EFNA genes, we estimated their OS and RFS in Pancreatic ductal adenocarcinoma by using Kaplan-Meier analysis methods. P < 0.05 was considered statistically significant.
The Cancer Genome Atlas (TCGA) Database
The transcriptome data of pancreatic cancer patients in the TCGA database (https://tcga-data.nci.nih.gov/tcga/) were downloaded. Inclusion and exclusion criteria were as follows: exclusion of the following three conditions: (1) incomplete gene expression data; (2) loss of survival follow-up time; (3) incomplete information of patient’s age, gender, histopathological grade, and tumor stage; After excluding the data without the information above, a total of 169 patients with pancreatic cancer in TCGA database were included in the study. The validation cohort GSE62452 had a total of 65 pancreatic cancer patients included in the study. The “survival” R package was used to analyze the univariate and multivariate prognostic correlation of the EFNA family. The R packages “survival”, “regplot”, and “rms” were used to construct the nomogram prediction model. The R packages “limma”, “ggplot2”, “ggpubr”, “ggExtra”, and “circlize” were used to analyze the genes related to EFNA5 in pancreatic cancer patients. “limma”, “org.Hs.eg.db”, “clusterProfiler” and “enrichplot” were used for GSEA enrichment analysis.
UALCAN
UALCAN (http://ualcan.path.uab.edu/index.html) is a comprehensive database that provides diverse, in‐depth analysis of TCGA expression data. We used the UALCAN online database to explore the relationship between the expression level of EFNAs and clinically relevant characteristics in patients with pancreatic adenocarcinoma.38
cBioPortal Databases
The cBioPortal (http://cbioportal.org) is an open-access resource for visualizing and analyzing multidimensional cancer genomics datasets.39 The cBioPortal was used to analyze the genome map of the EFNA genes in pancreatic adenocarcinoma and obtain the mutation data.
Biological Function and Pathway Enrichment
DAVID (https://david.ncifcrf.gov) is a Database for Annotation, Visualization, and Integrated Discovery, which provides a comprehensive set of functional annotation tools for investigators to understand the biological meaning behind large lists of genes.40 The GO function annotation and KEGG pathway enrichment were investigated using the DAVID database, ranked through P-value, and the top 10 relevant GO function annotation and KEGG pathways (P < 0.05) were plotted as bubble charts with the Bioinformatics platform (http://www.bioinformatics.com.cn/).
Tumor Immune Estimation Resource (TIMER)
The TIMER database can be utilized to analyze the infiltration of immune-related cells in various types of tumors.41 It was used to investigate the relationship between EFNA expression levels and the degree of infiltration of various immune-related cells, cancer-associated fibroblasts, and myeloid-derived suppressor cells in PAAD.
GSCALite
GSCALite offers a web-based platform for Gene Set Cancer Analysis.42 It explored the relationship between EFNA expression levels and tumor-related pathways in PAAD.
Cell Culture and Transfection
HPDE6-C7 (WHELAB C1248), BxPC-3 (WHELAB C1023), CFPAC-1 (WHELAB C1206) were kindly provided by SHANGHAI WHELAB BIOSCIENE LIMITED, pancreatic adenocarcinoma cell line (PANC1) was purchased from the Cell Bank of the Chinese Academy of Sciences (Shanghai, China). HPDE6-C7 cells were cultured in epithelial cell medium (M1005A, SHANGHAI WHELAB BIOSCIENE LIMITED, China) and 10% foetal bovine serum (Gibco, MA, USA) in an incubator at 37 °C and 5% CO2 and used as an in vitro model for analysis. The remaining pancreatic cancer cells were cultured in IMDM medium (Gibco, MA, USA) and 10% foetal bovine serum (Gibco, MA, USA). siRNA treatment was performed using Opti-MEM medium and lipofectamine 2000 following the manufacturer’s protocol. The efficiency of depletion was tested by Western blotting.
Western Blotting
Protein concentration was determined by Western blotting. Briefly, The protein concentration of whole-cell lysates was determined using a bicinchoninic acid protein assay kit (Beyotime, Shanghai, China). Protein samples were separated by electrophoresis on standard sodium dodecyl sulfate-polyacrylamide gel electrophoresis gels and transferred to 0.2 mm polyvinylidene difluoride membranes (Millipore). The membrane was blocked with 5% bovine serum albumin for one h at room temperature and then incubated overnight at four °C with the primary antibodies against Ki67 (1:1000, ab16667, Abcam), EFNA5 (1:500, sc-81945, Santa), MMP2 (1:1000, 87809S, CST), and MMP9 (1:1000, 13667S, CST). Membranes were exposed to light-sensitive film and quantified using ImageJ software.
Wound Healing Assays
Cell migration was assessed using wound healing assays. The cells were seeded in six-well plates containing serum and cultured for 1–2 days. A wound was inflicted in the confluent cell layer using a 200-µL pipette tip, and the wells were gently washed with PBS to remove all floating cells. The cells were cultured in a serum-free medium for 48 hours. Lesion edge images were acquired using an inverted microscope. The wound healing capacity was calculated from the acquired images.
CCK8 Experiment
The CCK8 experiment was used to assess cell proliferation capacity. Cells were seeded in 96-well plates and cultured for 24 hours; siRNA was transfected the next day. After 12, 24, 48, and 72 hours of cell culture, the cell proliferation ability was measured using the CCK8 kit (abbkine, China) and a spectrophotometer (450 nm).
Tumorigenicity Assay in Nude Mice
Four-week-old male BALB/c Nude mice were purchased from Bikai (shanghai). The mice were housed in an SPF experimental animal facility with a 12-hour light/dark cycle and constant temperature and relative humidity. The First Affiliated Hospital Ethics Committee of Naval Medical University approved the tumor-forming experiment in nude mice, and all experiments were performed following the ethics committee regulations and ARRIVE guidelines. Briefly, the CFPAC-1 cell line was selected and cultured with IMDM medium containing 10% fetal bovine serum until logarithmic growth; trypsin digested the cells and washed twice with PBS buffer, and cell concentration was adjusted to 1*10^6 by counting. The nude mice were randomly allocated into two groups, each comprising five individuals. The skin on the right dorsal side of each mouse was sterilized using an alcohol-soaked cotton ball. A syringe needle was then angled at 30° to perform a subcutaneous injection, during which 100 µL of cell suspension was slowly administered. Subsequently, the tumors’ length and short diameter were measured every three days using vernier calipers, and the growth curves were documented. After 18 days of observation, the tumor tissue was removed and photographed for recording.
Statistical Analysis
Bioinformatic analyses and R packages were performed using the R software, version 4.2.0. GraphPad Prism 8 was used for statistical analysis of molecular biology experiments, and graphs were generated. To detect the differences between the data of the intervention and control groups, the data of the two groups were independent of each other, and the outcome variables were continuous variables, conforming to a normal distribution with equal variances, using two independent samples t test; to detect the expression between different cell lines, the data of each group were independent of each other, and the outcome variables were continuous variables, conforming to a normal distribution with equal variances, using a one-way analysis of variance. The difference is statistically significant when P < 0.05.
Results
Pan-Cancer Analysis and Expression of EFNA1-5
The pan-cancer analysis aims to examine the similarities and differences in genomic and cellular changes by comparing multiple tumor types horizontally to find some universal rule.43,44 Analyzing the publicly available database GEPIA (Figure 1A), we discovered that EFNA1-5 was differentially expressed in multiple cancer types, suggesting that EFNA1-5 dysregulation may be associated with different human malignancies.
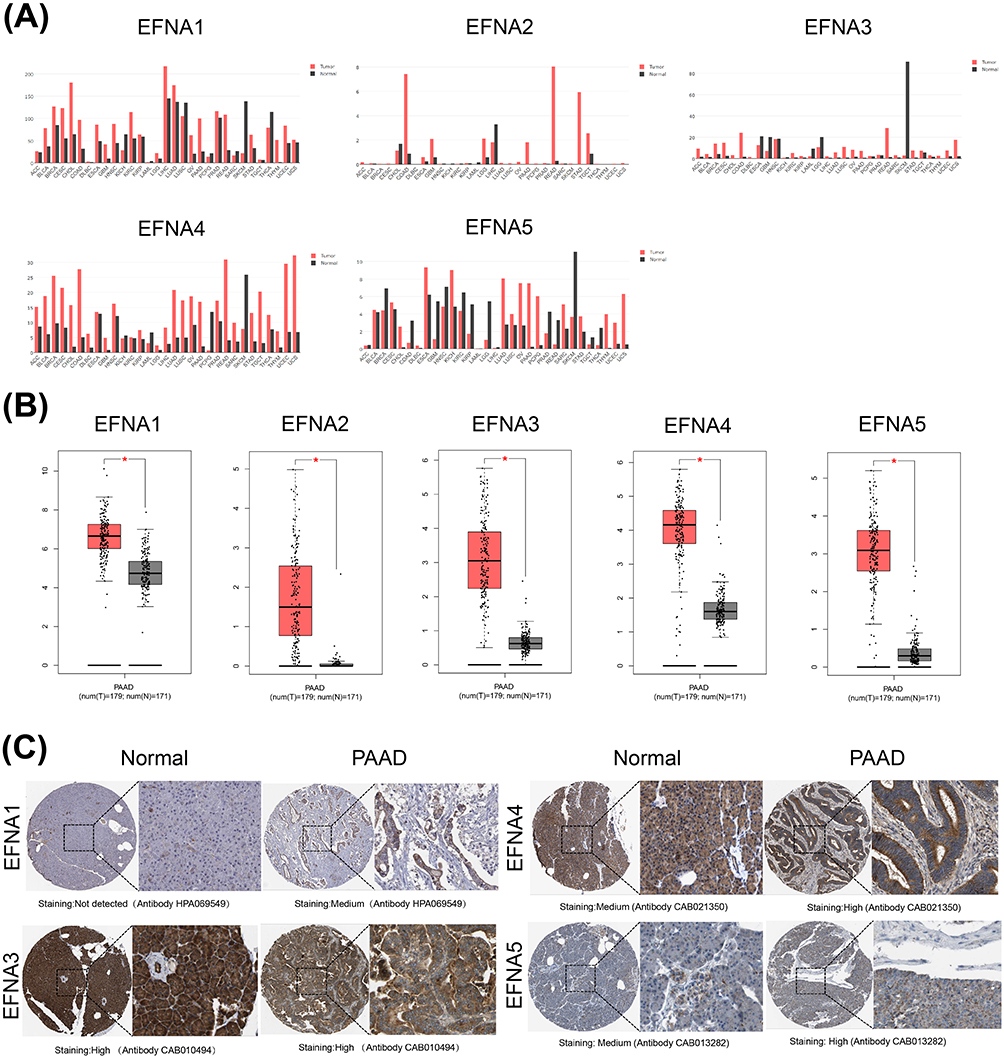 |
Figure 1 EFNA1-5 expression levels in different types of human cancers. (A) The expression differences of EFNA1-5 in 33 cancers and the corresponding normal tissues in the GEPIA database. (B) Boxplot showing the transcription levels of EFNA genes in PAAD (GEPIA database) (*p<0.05). (C) Representative immunohistochemistry of EFNAs in PAAD and normal pancreas tissues. |
We then explored the differential expression of EFNA1-5 between PAAD and normal tissues. The mRNA expression levels of all five Ephrin A subtype proteins were significantly upregulated in PAAD compared to normal samples (p<0.05, Figure 1B). Using the HPA database, we further analyzed the protein expression levels of EFNA1-5 in PAAD. Except for EFNA2, the immunohistochemical results of the remaining four members were presented in the HPA database, and the results are shown in Figure 1C. EFNA1 was not detected in normal tissues but showed medium expression in PAAD. EFNA3 was highly expressed in both normal and tumor tissues without significant differences. EFNA4-5 was moderately expressed in normal tissues but upregulated in PAAD tissues, showing high expression.
The Prognostic Value of EFNA mRNA Expression in Pancreatic Cancer Patients
Next, we evaluated the prognostic value of five EFNA Genes in pancreatic cancer using the Kaplan-Meier plotter. In addition to EFNA2 (hazard ratio [HR] = 1.38 95% confidence interval [CI]: 0.88–2.16, p = 0.16), the higher the expression level of EFNA1 (hazard ratio [HR] = 1.63 95% confidence interval [CI]: 1.08–2.47, p = 0.02), EFNA3 (hazard ratio [HR] = 1.54 95% confidence interval [CI]: 1.02–2.32, p = 0.038), EFNA4 (hazard ratio [HR] = 1.57 95% confidence interval [CI]: 1.04–2.36, p = 0.03) and EFNA5 (hazard ratio [HR] = 1.95 95% confidence interval [CI]: 1.29–2.94, p = 0.0013), the worse the overall survival (OS) of the patients, and the difference was statistically significant (Figure 2A).
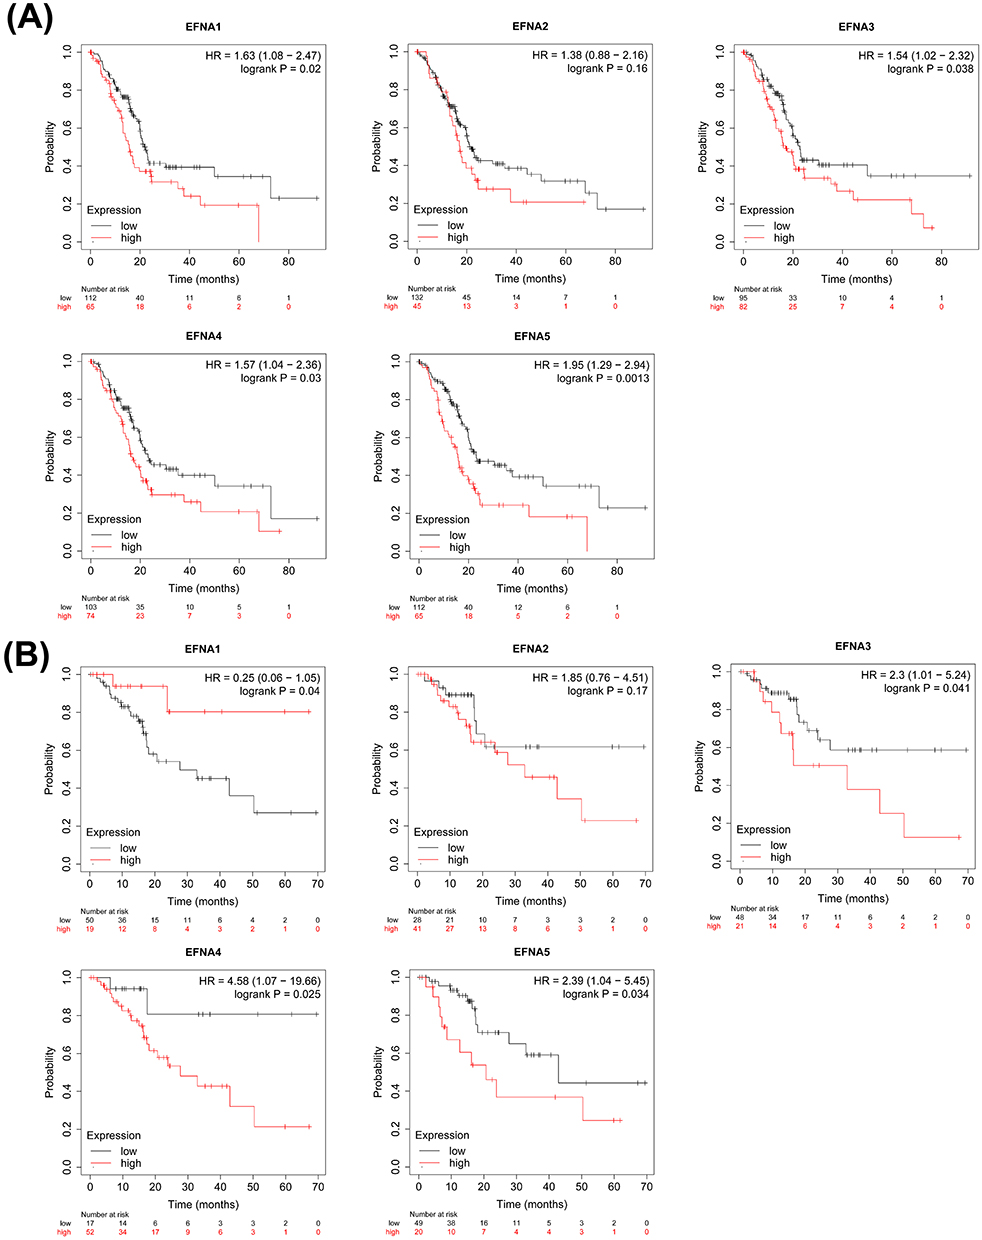 |
Figure 2 Survival analysis of pancreatic cancer (Kaplan-Meier plotter). OS (A) and RFS (B) curves comparing the high and low expression of EFNA1-5 in pancreatic cancer. |
Further analysis of relapse-free survival (RFS; time until recurrence/death) in patients with pancreatic cancer showed that the upregulation of EFNA3 (hazard ratio [HR] = 2.3 95% confidence interval [CI]: 1.01–5.24, p = 0.041), EFNA4 (hazard ratio [HR] = 4.58 95% confidence interval [CI]: 1.07–19.66, p = 0.025) and EFNA5(hazard ratio [HR] = 2.39 95% confidence interval [CI]: 1.04–5.45, p = 0.034) were significantly associated with poor RFS. Notably, unlike the role of EFNA1 in predicting OS (higher EFNA1 expression predicted worse OS), increased EFNA1 mRNA levels were associated with better RFS in pancreatic cancer (hazard ratio [HR] = 0.25 95% confidence interval [CI]: 0.06–1.05, p = 0.04). EFNA2 also had no significant correlation with RFS (hazard ratio [HR] = 1.85 95% confidence interval [CI]: 0.76–4.51, p = 0.17) (Figure 2B).
Relationship Between EFNA Genes Expression and the Clinical Characteristics of PAAD Patients
To further assess the relationship between EFNA1-5 and PAAD-related clinical features, we analyzed publicly available data from the UALCAN database. As shown in Figure 3A, the expression levels of EFNA2, EFNA3, and EFNA5 showed statistical differences among the different individual cancer stages of PAAD. Specifically, EFNA2 and EFNA3 in stage2 were significantly higher than those of the normal group (p< 1E-12 for EFNA2,p=4.39E-10 for EFNA3), and EFNA5 was significantly higher in stage4 than in the normal group (p=6.60E-03). The results of the analysis regarding nodal metastasis status showed that EFNA2 and EFNA3 were significantly higher in N0 and N1 stages than in the normal group (p<0.05), predicting worse disease (Figure 3B).EFNA4 and EFNA5 were closely related to tumor grade, as shown by: EFNA4 was significantly differentially expressed between normal group and grade3 (p=3.42E-02), grade1 and grade2 (p=3.24E-04), grade1 and grade3 (p=8.77E-04), grade3 and grade4 (p=3.42E-02); The difference between EFNA5 in grade1 and grade2 (p=2.38E-04) and grade1 and grade3 (p=4.85E-04) was statistically significant (Figure 3C).
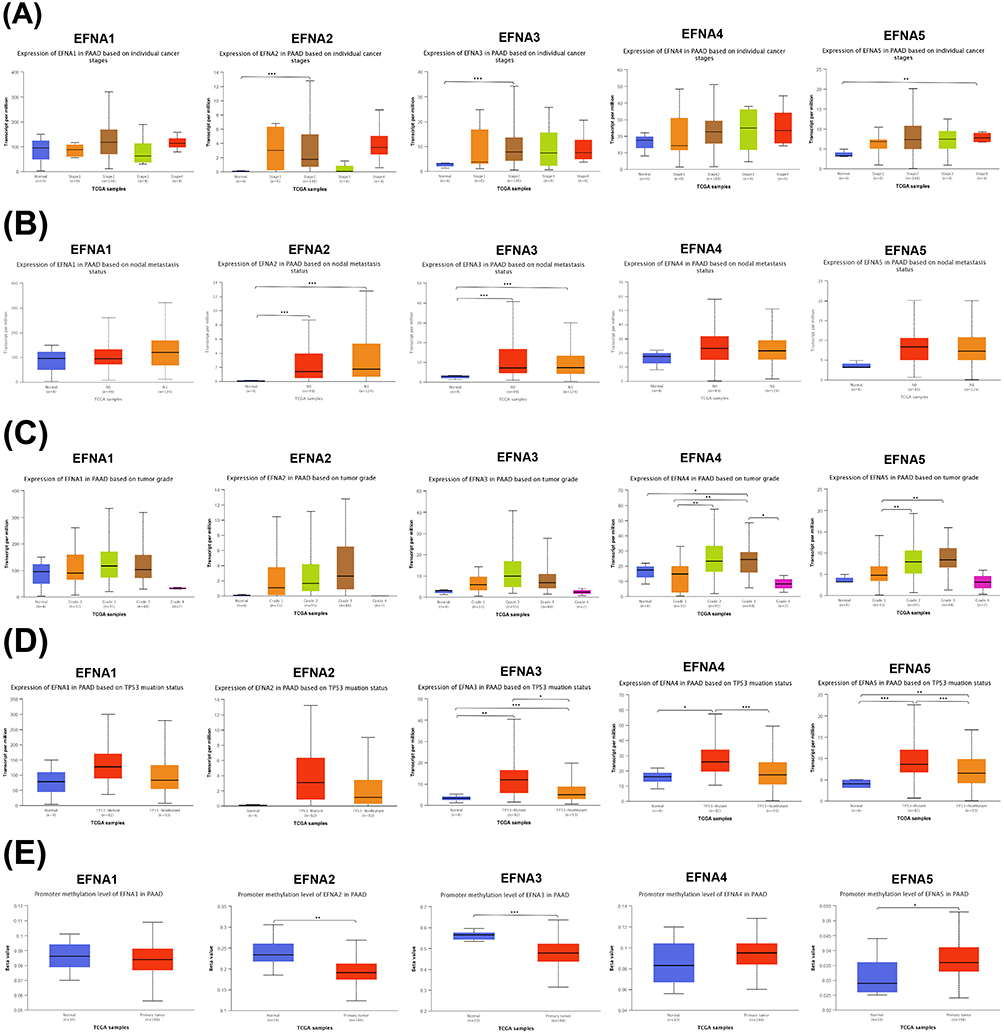 |
Figure 3 Association of EFNA1-5 mRNA expression with clinical parameters in PAAD. (A) individual cancer stage, (B) nodal metastasis status, (C) tumor grade, (D) TP53 mutation, and (E) promoter methylation levels; *p < 0.05, **p < 0.01, ***p < 0.001. |
Next, we explored the correlation between EFNA1-5 expression and TP53 mutation status. Previous studies have shown that 50%—80% of patients carry TP53-inactivating mutations that can drive pancreatic cancer metastasis.45,46 The results showed that EFNA3, EFNA4, and EFNA5 were significantly associated with TP53 mutation status (Figure 3D).
DNA methylation can regulate gene transcription in cell proliferation and survival. Several studies have demonstrated that the methylation status of DNA may be a potential novel epigenetic prognostic biomarker.47,48 This study found that the promoter methylation levels of EFNA2, EFNA3, and EFNA5 significantly differed between the normal group and the primary tumor (Figure 3E).
Tumor-Associated Pathways and Genetic Alteration Analysis of EFNA1-5
We then analyzed the GSCA database for common cancer-related pathway enrichment analysis. The results showed that EFNA1-5 is closely associated with several pathways widely demonstrated to be involved in malignant tumor progression. Examples include apoptosis, cell cycle, DNA damage response, and epithelial-mesenchymal transition (EMT) (Figure 4A). It is shown that EFNA genes may play an essential role in drug resistance, proliferation, apoptosis, invasion, and metastasis of pancreatic cancer.
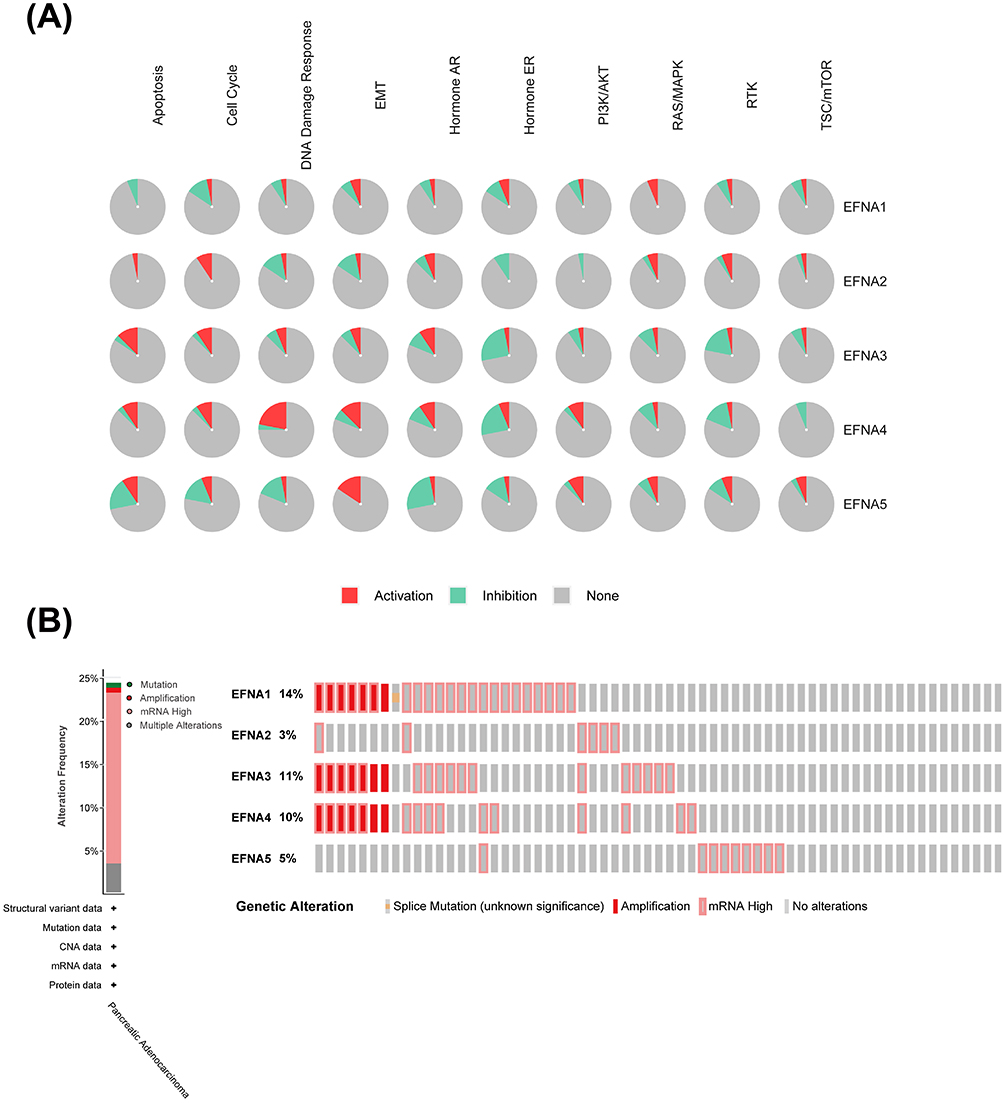 |
Figure 4 EFNA gene mutations and related tumor pathway in PAAD. (A) The relationship between EFNA1-5 and tumor-associated pathways in PAAD. (B) EFNA1-5 mutations in pancreatic cancer. |
Using cBioPortal, we further investigated the genetic alterations of EFNA Genes. All five members exhibited varying degrees of mutation frequency. EFNA1 had the highest mutation frequency of 14%. In addition, EFNA3 (11%), EFNA4 (10%), and EFNA5 (5%) had mutation rates of at least 5%. The genetic alterations in EFNA genes included splice mutation, amplification, and high mRNA (Figure 4B).
Relationship Between the EFNA1-5 and Tumor-Infiltrating Immune Cells in Patients with PAAD
Because pancreatic cancer has an immunosuppressive tumor microenvironment, even though immunotherapy has been shown to be effective in many other cancers, it has not been effective in pancreatic cancer (44). Therefore, to investigate why pancreatic cancer is insensitive to immunotherapy, we first analyzed the relationship between EFNA1-5 expression and the level of inflammatory cell infiltration in the tumor microenvironment using the TIMER database.
As shown in Figure 5A–E, EFNA1 and EFNA3 were negatively correlated with macrophages and dendritic cell infiltration. EFNA4 was negatively associated with macrophage infiltration. EFNA5 was positively correlated with CD8+T cell infiltration. No significant correlation has been found between EFNA2 and PAAD immune cell infiltration.
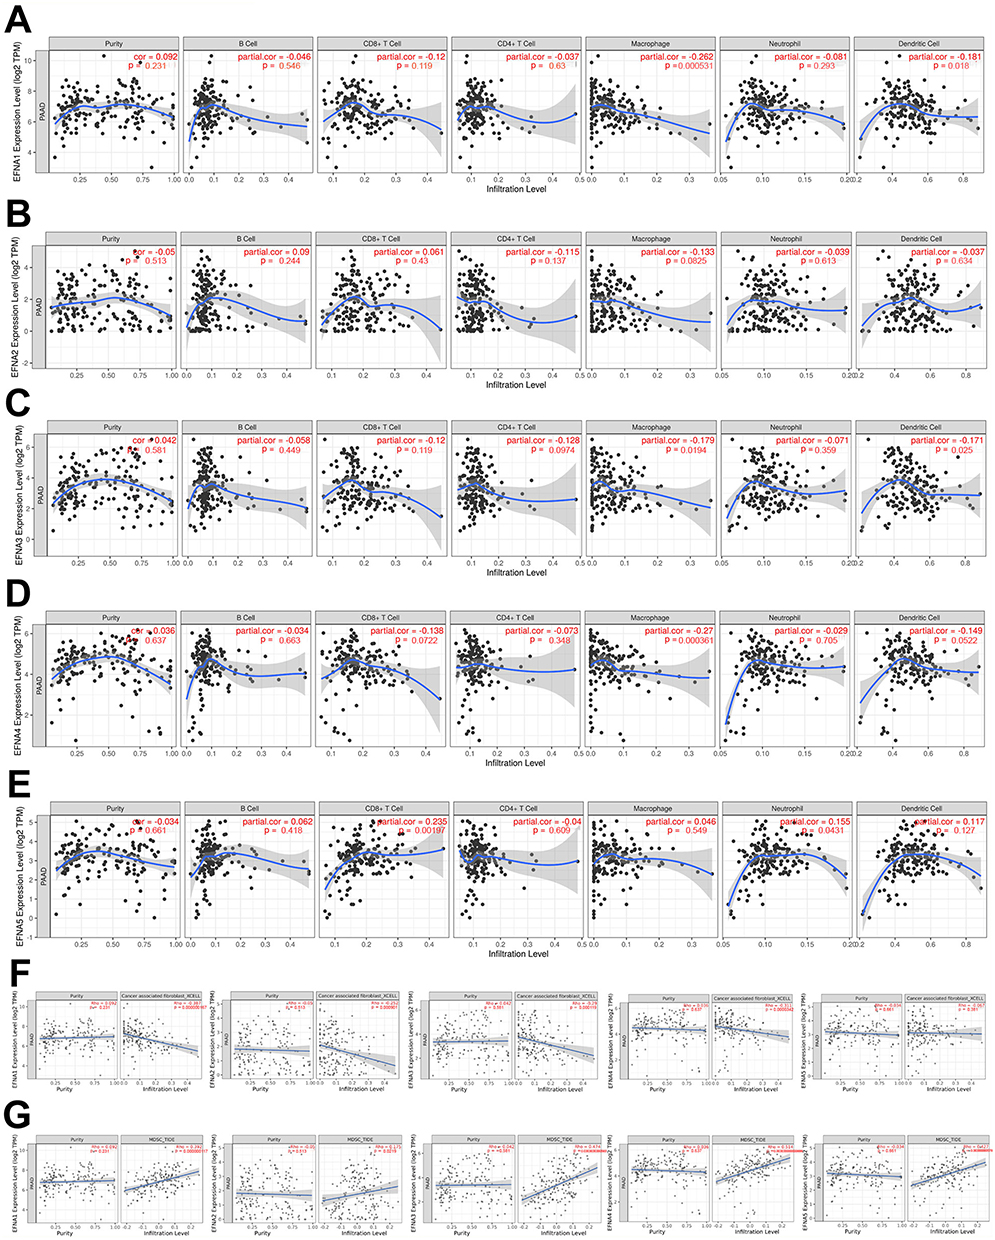 |
Figure 5 The relationship between EFNA1-5 and the immunosuppressive state of pancreatic cancer. (A) EFNA1, (B) EFNA2, (C) EFNA3, (D) EFNA4, and (E) EFNA5. (F) EFNA1-4 were significantly negatively associated with CAFs in PAAD. (G) EFNA1-5 were significantly positively correlated with MDSCs in PAAD. |
In addition, in the analysis regarding EFNA1-5 with CAFs and MDSCs, we found that EFNA1-4 were significantly negatively associated with CAFs (Figure 5F), whereas all five EFNA members were significantly positively correlated with MDSCs (Figure 5G).
Overall, the above results suggest that the EFNA gene is closely associated with the immunosuppressive state of pancreatic cancer. Targeted therapy against EFNA1-5 may alleviate the immune cell dysfunction within the tumor microenvironment.
Survival Prediction Study of EFNA1-5 in PAAD Patients
Based on TCGA transcriptome data, univariate and multivariate Cox regression analyses were used to determine whether EFNA1-5 expression was an independent risk factor for poor prognosis in PAAD patients (Figure 6A). The univariate Cox analysis revealed that EFNA4 (HR = 1.296; 95% CI 1.042–1.612; p < 0.020) and EFNA5 (HR = 1.362; 95% CI 1.048–1.770; p < 0.021) were high-risk factors. In the multivariate Cox proportional hazards regression analysis, EFNA4 and EFNA5 were independently associated with overall survival (p<0.05). These results suggest that EFNA4 and EFNA5 may play an essential role in the malignant process of PAAD.
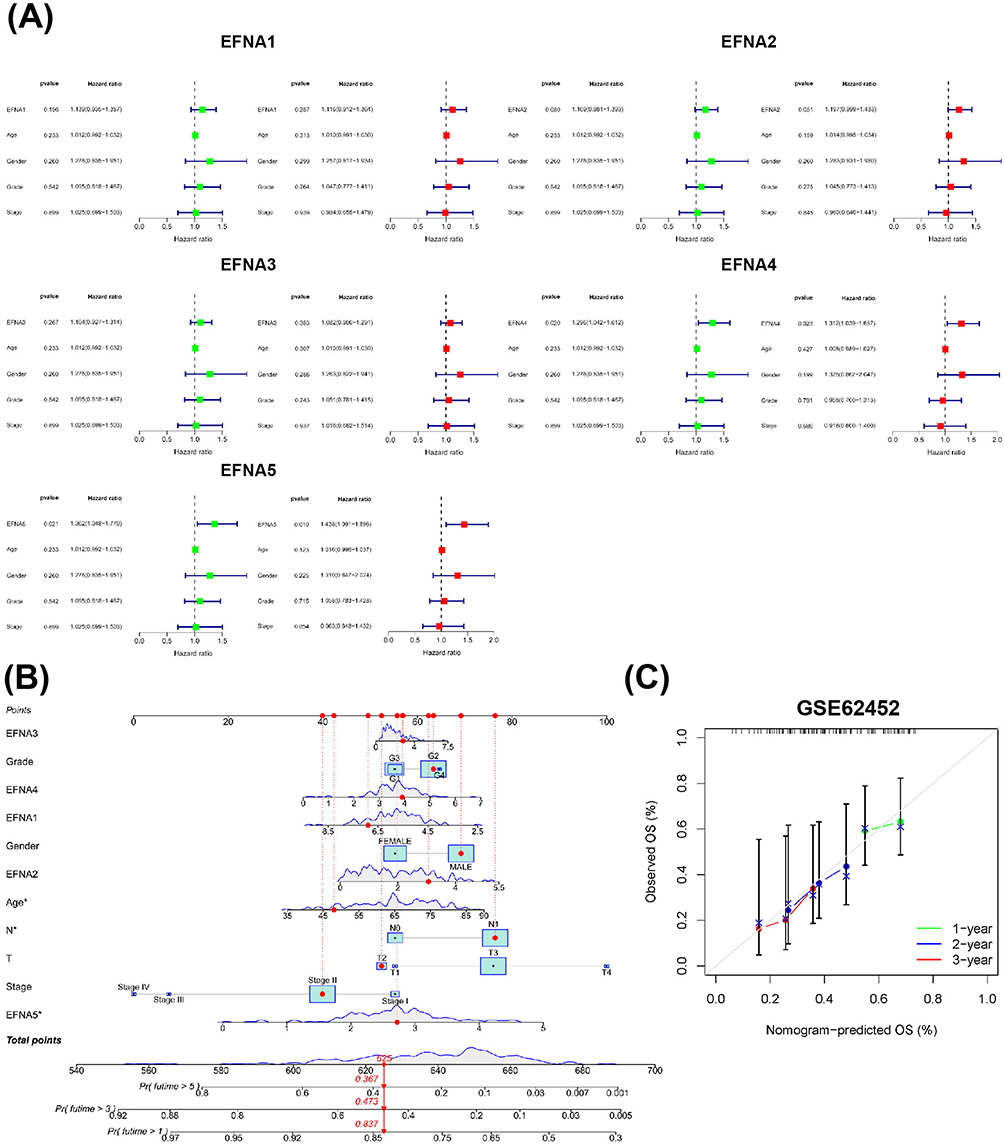 |
Figure 6 Analysis of the prognostic value of EFNAs. (A)Univariate Cox analysis(green) and multivariate Cox analysis(red) were performed to determine whether EFNA1-5 were prospective prognostic indicators and independent risk factors for pancreatic cancer. (B) A prognostic nomogram was constructed based on 11 variables, including TSPAN1-5 expression levels; corresponding “integral” values can be obtained, which can be summed to calculate the “total score”. Therefore, patients’ 1 -, 3 -, and 5-year overall survival (OS) rates can be predicted. (C) External validation cohorts cohort. The grey line indicates the ideal reference line where predicted probabilities would match the observed survival rates. The green line represents 1 year, the Blue line represents 2 years, and the red line represents 3 years. The closer the green, blue, and red solid lines are to the gray line, the more accurately the model predicts survival. |
To further quantitatively predict the individual survival chances of PAAD patients, we established a quantitative prognostic nomogram model based on risk scores and clinical characteristics and incorporated 11 relevant variables including EFNA1-5, among which age, lymph node metastasis, and EFNA5 expression were meaningful factors contributing to outcome events (Figure 6B). We then validated the model’s prediction accuracy in the external dataset GSE62452 to explore its generalization ability. The results presented in Figure 6C demonstrate that the predicted overall survival (OS) at 1, 2, and 3 years closely aligns with the observed OS. This alignment indicates that the model’s predicted OS in the external dataset corresponds well with the actual observations, thereby confirming the model’s robust calibration performance. Taken together, the expression of EFNA5 may predict the future survival of PAAD patients.
Functional Enrichment Analysis of EFNA1-5 and Its Co-Expressed Genes in PAAD Patients
To further analyze the role of EFNA1-5 in the occurrence and development of pancreatic cancer, we obtained the related genes of EFNA1-5 from the TCGA database (Figure 7A) and uploaded them to the DAVID database for Gene Ontology (GO) analysis and Kyoto Encyclopedia of Genes and Genomes (KEGG) pathway enrichment analysis. The top 10 most significant biological processes for each item are shown in the bubble diagram (Figure 7B–E).
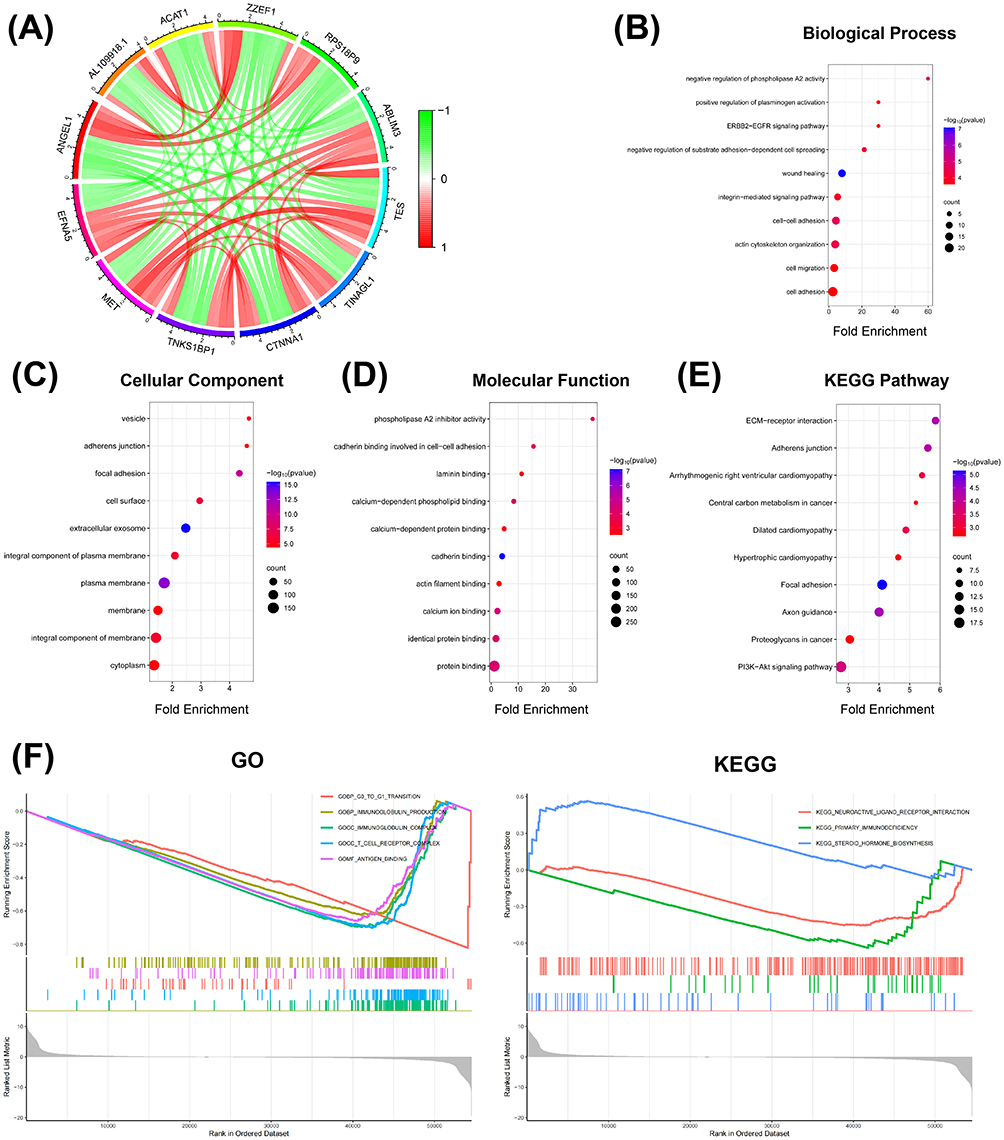 |
Figure 7 GO/KEGG enrichment of EFNA5 and its related genes. (A) EFNA5-related genes. The color of the lines represents the degree of correlation, which is between −1 and 1. Green represents a negative correlation, and red represents a positive correlation. (B) Biological processes enrichment analysis. (C) Cellular components enrichment analysis. (D) Molecular functions enrichment analysis. (E) KEGG enrichment analysis. (F) GSEA enrichment analysis of EFNA5 based on the TCGA database. |
The EFNA1-5 and their related genes were mainly enriched in biological processes related to cell migration and adhesion (Figure 7B). These genes were involved in the main cellular components of the extracellular exosome and plasma membrane (Figure 7C). The molecular functions for these genes were mainly cadherin binding and calcium ion binding (Figure 7D). The results of the KEGG enrichment analysis were primarily focused on the focal adhesion pathway (Figure 7E).
Previous analyses showed that EFNA5 may be the most relevant gene for PAAD prognosis. To further elucidate the possible biological function of the EFNA5 gene tag in PAAD, we downloaded the PAAD transcriptome data from the TCGA database for the single-gene GSEA enrichment analysis of EFNA5 (Figure 7F). The results showed that EFNA5 was mainly enriched in immune-related pathways.
EFNA5 Knockdown Inhibits Malignancy in Human Pancreatic Cancer Cells
The above results indicate that EFNA5 is significantly overexpressed in PAAD and is an independent risk factor for poor prognosis in patients with pancreatic cancer, which may be a valuable research target. We confirmed that EFNA5 was upregulated in three different human pancreatic cancer cell lines compared to human normal pancreatic cells by Western blot (Figure 8A). Furthermore, small interfering RNA (siRNA) was used to transfect pancreatic cancer cell lines to investigate the effect of specific silencing EFNA5 expression on the proliferation, invasion, and migration of pancreatic cancer cells. The results are shown in Figure 8B, and the siRNA3 with the highest transfection efficiency was selected for subsequent experiments. The expression of mesenchymal markers matrix metalloproteinase 2/9 (MMP2/MMP9) and proliferation indicator ki67 was decreased after knockdown of EFNA5 (Figure 8C). Trauma healing was slower in the EFNA5 knockdown group than in the control group at 48 h of the wound-healing assay (Figure 8D). Finally, silencing EFNA5 significantly inhibited the proliferation of pancreatic cancer cells in vitro and in vivo, as evidenced by the Cell Counting Kit-8 assay (Figure 8E) and the tumorigenicity Assay in Nude Mice (Figure 8F). Overall, EFNA5 plays an essential role in the malignant progression of pancreatic cancer and is expected to be a promising molecular therapeutic target.
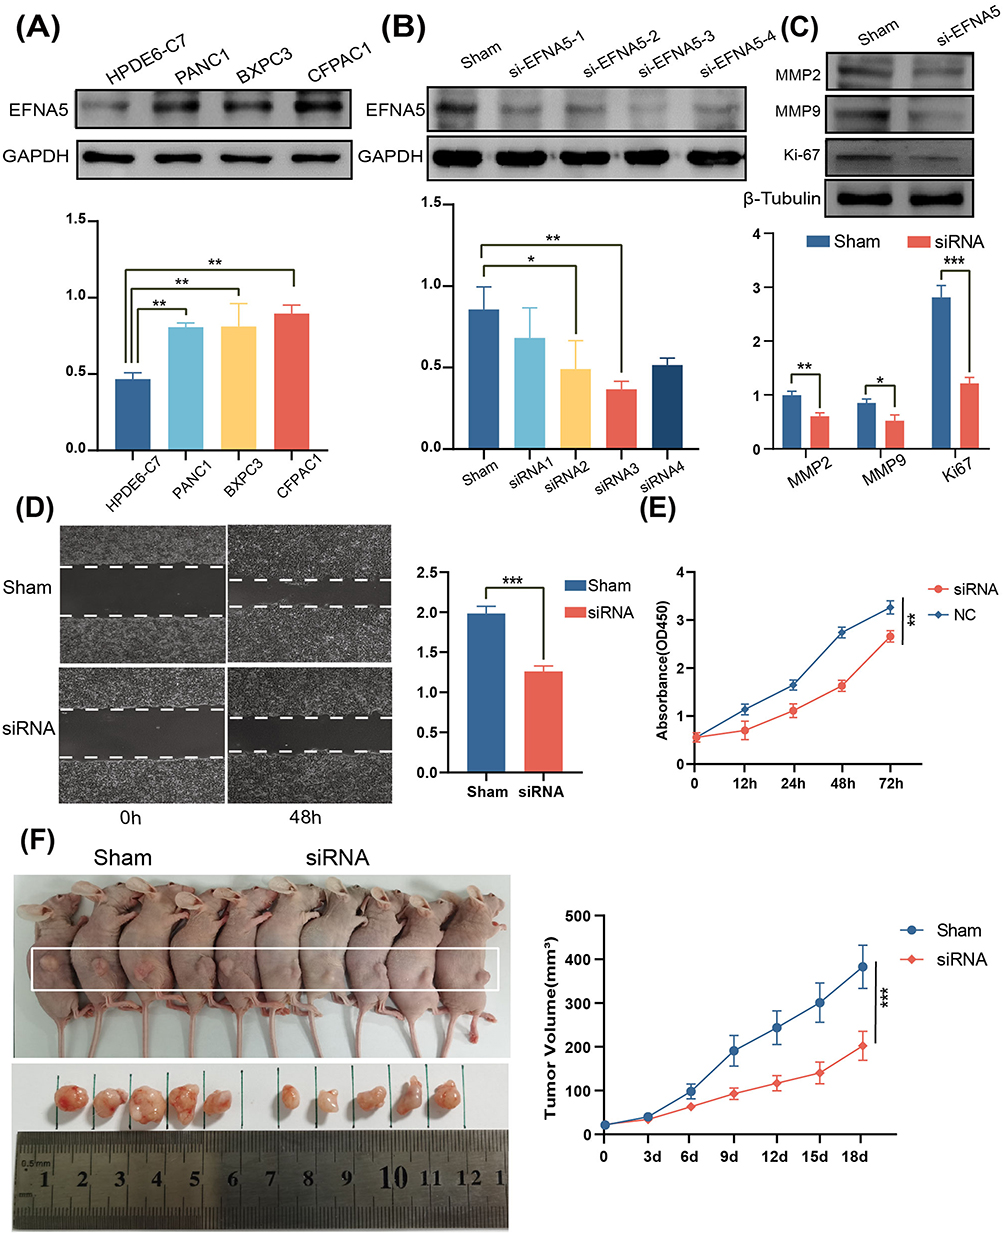 |
Figure 8 Effect of EFNA5 expression on the malignant progression of pancreatic cancer. (A) Western blotting (WB) results showed that the expression of EFNA5 was significantly upregulated in all three pancreatic cancer cell lines compared with normal human pancreatic cells. (B) Using small interfering RNA to transfect pancreatic cancer cells, the WB results confirmed that EFNA5 was knocked down. (C) WB results showed that the expression of mesenchymal markers MMP2/MMP9 and proliferation marker ki67 was decreased after EFNA5 knockdown. (D) The wound healing assays revealed an increased healing area after the EFNA5 knockdown. (E) The CCK8 proliferation assay showed that EFNA5 downregulation reduced Pancreatic cancer cell proliferation. (F) Tumorigenicity assay in nude mice showed that down-regulation of EFNA5 reduced pancreatic cancer tumor volume in vivo. *p<0.05,**p < 0.01,** *p< 0.001. |
Discussion
Ephrin-Eph signals were initially identified in the erythropoietin-producing hepatoma cell line, triggering a large number of studies.16,49 They have been shown to regulate angiogenesis, tissue architecture, and cell motility and play an essential role in cancer development, but detailed insights into the specific mechanisms are still lacking.50,51 Based on a large amount of public data, this study systematically analyzed the expression level, biological function, clinical value, genetic variation, immune infiltration, and prognostic significance of EFNA1-5 in pancreatic cancer for the first time and verified the role of EFNA5 in the malignant development of pancreatic cancer in vitro and in vivo. The findings may have essential theoretical guidance for gaining insight into the molecular mechanisms of pancreatic cancer, improving the accuracy of predicting prognosis, and designing new targeted therapies.
Previous studies have shown that hypoxia and tumor necrosis factor α (TNF-α) can lead to upregulation of EFNA1 expression in endothelial cells, stimulating vascular and tumor growth.52 Evidence for the involvement of EFNA1 in the pathogenesis of gastric cancer has also been reported in many ways.53,54 Our results showed that both mRNA and protein expression levels of EFNA1 were upregulated in PAAD compared with normal tissues, significantly correlating with the poorer OS. Notably, although high EFNA1 expression predicted worse OS, increased EFNA1 mRNA level was associated with better RFS in pancreatic cancer. More studies are needed in the future to explain this seemingly contradictory result. In addition, EFNA1 was significantly negatively associated with macrophages and dendritic cell infiltration, CAFs, and significantly positively correlated with MDSCs. These results demonstrate both the carcinogenic role and prognostic value of EFNA1 in PAAD, which also seems to play an essential role in the immunosuppressive microenvironment of pancreatic cancer.
EFNA2 has been shown to promote prostate cancer metastasis by enhancing angiogenesis and promoting epithelial-mesenchymal transition (EMT), which may be a potential therapeutic target for prostate cancer.55 In our study, the transcript level of EFNA2 was significantly higher in PAAD than in normal tissues, but its protein level was not significantly upregulated. In addition, EFNA2 was not significantly associated with OS and RFS in pancreatic cancer. Interestingly, however, EFNA2 levels were significantly associated with cancer grade, lymph node metastasis, CAFs, and MDSCs. More studies should be conducted in the future to determine the potential role of EFNA2 in the occurrence and development of PAAD.
A recent study showed that miR-210-3p-EFNA3-PI3K/AKT signaling axis plays a vital role in the progression of oral squamous cell carcinoma (OSCC).56 The upregulation of EFNA3 expression in breast and gastric cancers has also been associated with poor prognosis.57,58 However, the role of EFNA3 in pancreatic cancer is still lacking in research. According to our analysis results, the transcription level of EFNA3 was significantly upregulated in PAAD, predicting poorer tumor stage and nodal metastasis status, which were closely associated with poor OS and RFS. In addition, the promoter methylation level of EFNA3 was statistically higher in PAAD than in normal tissues. The TP53 mutation or not was also significantly associated with EFNA3 levels. Like EFNA1/2, EFNA3 may also play a vital role in promoting immunosuppression in the pancreatic cancer microenvironment, as evidenced by its significant negative correlation with macrophages and dendritic cells infiltration, CAFs, and significant positive correlation with MDSCs.
EFNA4 has been shown to promote proliferation and metastasis in hepatocellular carcinoma. Its upregulation is associated with a poor prognosis.25 In this study, both transcription and protein expression levels of EFNA4 were significantly upregulated in PAAD, usually showing poor OS and RFS. In addition, EFNA4 levels were quite different among different pancreatic cancer grades, suggesting that it may have potential value in predicting tumor risk levels. Immune-related analysis data showed that EFNA4 was significantly negatively correlated with macrophage infiltration and CAFs and positively correlated with MDSCs.
Accumulation of EFNA5 has been shown to promote the development of pancreatic cancer.59 Our results showed that both mRNA and protein levels of EFNA5 were significantly increased in PAAD, predicting a poor patient prognosis. The expression level of EFNA5 was closely associated with pancreatic cancer grade, stage, and TP53 mutation status. In addition, a recent study in 2022 reported that neoadjuvant therapy could alter the collagen structure of pancreatic cancer tissues and, thus, the tumor microenvironment through EFNA5.60 Our study demonstrated that EFNA5 was involved in the immunosuppressive mechanism in pancreatic cancer, as its expression was significantly positively correlated with MDSCs. Further, it demonstrated that EFNA5 overexpression promoted pancreatic cancer proliferation, invasion, and migration in vitro and in vivo.
CAFs, as a critical component of the PAAD matrix, create a protective niche, which can not only induce the formation of an acidic microenvironment to inhibit immune cell activity and promote tumor metabolism, invasion, and metastasis but also act as a barrier to the invasion of anti-tumor drugs and immune cells.12 Interestingly, however, a real-world study of breast cancer showed a higher 10-year survival rate in breast-conserving patients, confirming the possibility that the tumor matrix may also impose pressure on cancer clones.61 The paradox may be because CAFs are not a homogeneous cell population.62 Tumors have long been thought to be wounds that do not heal, so tumor-suppressive CAFs have increasingly become attractive research targets.63,64
MDSCs develop and differentiate from common myeloid progenitor (CMP) cells, which are recruited, amplified, and activated in peripheral blood, bone marrow, or lesion sites when tumors occur in the body, suppressing innate and adaptive immunity, promoting tumor angiogenesis and distant metastasis.65 Particularly in pancreatic cancer, tumor cells can produce granulocyte-macrophage colony-stimulating factor (GM-CSF), which contributes to the accumulation of MDSCs and suppresses T-cell responses.66 Although targeted drugs for MDSCs have been used clinically,67 the signaling mechanism of their activation is still unclear due to their heterogeneity and lack of specific surface markers. Further in-depth studies are needed to provide more powerful intervention targets for MDSCs-based studies.68
Our study found that significantly upregulated EFNA1, EFNA3, and EFNA4 in PAAD were associated with reduced infiltration of immune cells and increased infiltration of MDSCs, which predicted a poor prognosis. At the same time, they were negatively correlated with the expression of CAFs. A reasonable explanation is that they weaken the activity of anti-tumor CAF subsets and thus exert a pro-cancer effect. However, further studies are needed in the future. The role of EFNA5 in pancreatic cancer has been preliminarily demonstrated in several studies, and our study provides direct experimental validation of its malignant role. Although it did not show a significant direct association with CAFs, its considerable correlation with MDSCs further confirms its potential role in cultivating “soil” for pancreatic tumors. There is still a lack of reports on the role of EFNA1-5 in the tumor microenvironment of PAAD. Research on EFNA genes will provide a deeper understanding of pancreatic cancer progression at the genetic level, which is expected to control or shrink tumors, thus bringing survival benefits to more patients with progressive pancreatic cancer. At the same time, it may enrich the multi-target combination therapy paradigm to arrest the tumor progression better.
In conclusion, this study identified upregulated mRNA and protein expression of EFNA1, EFNA3, EFNA4, and EFNA5 in PAAD, which may be promising prognostic markers. EFNA1-5 and their related genes are mainly involved in tumor-associated pathways and are closely associated with the immunosuppressive tumor microenvironment of pancreatic cancer. However, the present study has some limitations that should be addressed in future studies. First, this study’s data and information were obtained from public databases, lacking detailed patient information. Secondly, although this study provides preliminary results in vitro and in vivo experiments, more in-depth studies are needed to promote the understanding of the oncogenic mechanism of EFNA1-5, especially the positive association of EFNA genes with CAFs should receive more attention. Targeting EFNA1-5 may inhibit pancreatic cancer seeds, repair tumor soil, and induce the formation of a tumor-suppressive microenvironment, offering new possibilities for treating pancreatic cancer.
Data Sharing Statement
Original datasets are available in a publicly accessible repository:
Gene Expression Profiling Interactive Analysis (GEPIA) (http://gepia.cancer-pku.cn/).
The Human Protein Atlas (HPA) (https://www.proteinatlas.org/).
The Cancer Genome Atlas (TCGA) database (https://portal.gdc.cancer.gov/).
DAVID Knowledgebase v2022q3 (https://david.ncifcrf.gov/).
The cBioPortal platform (http://www.cbioportal.org/).
Tumor Immune Estimation Resource (TIMER)TIMER (shinyapps.io).
Gene Set Cancer Analysis GSCA: Gene Set Cancer Analysis (wchscu.cn).
UALCAN UALCAN (uab.edu).
Kaplan-Meier plotter (kmplot.com).
Ethical Statement
The study was conducted following the Ethics Committee of the First Affiliated Hospital of Naval Medical University.
Funding
This work was supported by the Special Foundation for Emerging Interdisciplinary Field Research of Shanghai Municipal Health Commission (Grant No. 2022JC004) and the First Affiliated Hospital of Naval Medical University (Shanghai Changhai Hospital) “Guhai Plan in the 14th Five-Year Plan period” (Grant No. GH145-22).
Disclosure
The authors have no conflicts of interest to declare.
References
1. Vincent A, Herman J, Schulick R, Hruban RH, Goggins M. Pancreatic cancer. Lancet. 2011;378:607–620. doi:10.1016/s0140-6736(10)62307-0
2. Ilic M, Ilic I. Epidemiology of pancreatic cancer. World J Gastroenterol. 2016;22:9694–9705. doi:10.3748/wjg.v22.i44.9694
3. Tempero MA. NCCN guidelines updates: pancreatic cancer. J National Compr Cancer Network. 2019;17:603–605. doi:10.6004/jnccn.2019.5007
4. Sung H, Ferlay J, Siegel RL, et al. Global cancer statistics 2020: GLOBOCAN estimates of incidence and mortality worldwide for 36 cancers in 185 countries. CA. 2021;71:209–249. doi:10.3322/caac.21660
5. Hidalgo M, Cascinu S, Kleeff J, et al. Addressing the challenges of pancreatic cancer: future directions for improving outcomes. Pancreatology. 2015;15:8–18. doi:10.1016/j.pan.2014.10.001
6. Siegel RL, Miller KD, Fuchs HE, Jemal A. Cancer statistics, 2021. CA. 2021;71:7–33. doi:10.3322/caac.21654
7. Rahib L, Smith BD, Aizenberg R, et al. Projecting cancer incidence and deaths to 2030: the unexpected burden of thyroid, liver, and pancreas cancers in the United States. Cancer Res. 2014;74:2913–2921. doi:10.1158/0008-5472.Can-14-0155
8. Daley D, Mani VR, Mohan N, et al. Dectin 1 activation on macrophages by galectin 9 promotes pancreatic carcinoma and peritumoral immune tolerance. Nat Med. 2017;23:556–567. doi:10.1038/nm.4314
9. Brahmer JR, Tykodi SS, Chow LQM, et al. Safety and activity of anti-PD-L1 antibody in patients with advanced cancer. New Engl J Med. 2012;366:2455–2465. doi:10.1056/NEJMoa1200694
10. Ramanathan RK, McDonough SL, Philip PA, et al. Phase IB/II randomized study of FOLFIRINOX plus pegylated recombinant human hyaluronidase versus FOLFIRINOX alone in patients with metastatic pancreatic adenocarcinoma: SWOG S1313. J Clin Oncol. 2019;37:1062–1069. doi:10.1200/jco.18.01295
11. Hingorani SR, Zheng L, Bullock AJ, et al. HALO 202: randomized phase II study of PEGPH20 plus nab-paclitaxel/gemcitabine versus nab-paclitaxel/gemcitabine in patients with untreated, metastatic pancreatic ductal adenocarcinoma. J Clin Oncol. 2018;36:359–366. doi:10.1200/jco.2017.74.9564
12. Ho WJ, Jaffee EM, Zheng L. The tumour microenvironment in pancreatic cancer - clinical challenges and opportunities. Nat Rev Clin Oncol. 2020;17:527–540. doi:10.1038/s41571-020-0363-5
13. Feig C, Gopinathan A, Neesse A, et al. The pancreas cancer microenvironment. Clin Cancer Res. 2012;18(16):4266–4276. doi:10.1158/1078-0432.Ccr-11-3114
14. Lin Y, Cai Q, Chen Y, et al. CAFs shape myeloid-derived suppressor cells to promote stemness of intrahepatic cholangiocarcinoma through 5-lipoxygenase. Hepatology. 2022;75:28–42. doi:10.1002/hep.32099
15. Wu Y, Ferlay J, Siegel RL, et al. The functions of EphA1 receptor tyrosine kinase in several tumors. Curr Med Chem. 2023;30:2340–2353. doi:10.2174/0929867329666220820125638
16. Kania A, Klein R. Mechanisms of ephrin-Eph signalling in development, physiology and disease. Nat Rev Mol Cell Biol. 2016;17:240–256. doi:10.1038/nrm.2015.16
17. Gale NW, Holland SJ, Valenzuela DM, et al. Eph receptors and ligands comprise two major specificity subclasses and are reciprocally compartmentalized during embryogenesis. Neuron. 1996;17:9–19. doi:10.1016/s0896-6273(00)80276-7
18. Rudno-Rudzińska J, Kielan W, Frejlich E, et al. A review on Eph/ephrin, angiogenesis and lymphangiogenesis in gastric, colorectal and pancreatic cancers. Chin J Cancer Res. 2017;29:303–312. doi:10.21147/j.issn.1000-9604.2017.04.03
19. Egea J, Klein R. Bidirectional Eph-ephrin signaling during axon guidance. Trends Cell Biol. 2007;17:230–238. doi:10.1016/j.tcb.2007.03.004
20. Qiu P, Li D, Xiao C, et al. The Eph/ephrin system symphony of gut inflammation. Pharmacol Res. 2023;197:106976. doi:10.1016/j.phrs.2023.106976
21. Govindan R, Ding L, Griffith M, et al. Genomic landscape of non-small cell lung cancer in smokers and never-smokers. Cell. 2012;150:1121–1134. doi:10.1016/j.cell.2012.08.024
22. Noblitt LW, Bangari DS, Shukla S, et al. Decreased tumorigenic potential of EphA2-overexpressing breast cancer cells following treatment with adenoviral vectors that express EphrinA1. Cancer Genet Ther. 2004;11:757–766. doi:10.1038/sj.cgt.7700761
23. Psilopatis I, Souferi-Chronopoulou E, Vrettou K, Troungos C, Theocharis S. EPH/Ephrin-targeting treatment in breast cancer: a new chapter in breast cancer therapy. Int J Mol Sci. 2022;23. doi:10.3390/ijms232315275
24. Batlle E, Henderson JT, Beghtel H, et al. Beta-catenin and TCF mediate cell positioning in the intestinal epithelium by controlling the expression of EphB/ephrinB. Cell. 2002;111:251–263. doi:10.1016/s0092-8674(02)01015-2
25. Lin J, Zeng C, Zhang J, et al. EFNA4 promotes cell proliferation and tumor metastasis in hepatocellular carcinoma through a PIK3R2/GSK3β/β-catenin positive feedback loop. Mol Ther Nucleic Acids. 2021;25:328–341. doi:10.1016/j.omtn.2021.06.002
26. Kohara S, Ogawa K. Eph/Ephrin promotes the adhesion of liver tissue-resident macrophages to a mimicked surface of liver sinusoidal endothelial cells. Biomedicines. 2022;10. doi:10.3390/biomedicines10123234
27. Easty DJ, Hill SP, Hsu MY, et al. Up-regulation of ephrin-A1 during melanoma progression. Inte J Cancer. 1999;84:494–501. doi:10.1002/(sici)1097-0215(19991022)84:5<494::aid-ijc8>3.0.co;2-o
28. Yao N, Ma Q, Yi W, et al. Artesunate attenuates the tumorigenesis of choroidal melanoma via inhibiting EFNA3 through Stat3/Akt signaling pathway. J Cancer Res Clin Oncol. 2024;150:202. doi:10.1007/s00432-024-05711-8
29. Walker-Daniels J, Coffman K, Azimi M, et al. Overexpression of the EphA2 tyrosine kinase in prostate cancer. Prostate. 1999;41:275–280. doi:10.1002/(sici)1097-0045(19991201)41:4<275::aid-pros8>3.0.co;2-t
30. Xiang YP, Xiao T, Li QG, et al. Y772 phosphorylation of EphA2 is responsible for EphA2-dependent NPC nasopharyngeal carcinoma growth by Shp2/Erk-1/2 signaling pathway. Cell Death Dis. 2020;11:709. doi:10.1038/s41419-020-02831-0
31. Yi C, Lai SL, Tsang CM, et al. A three-dimensional spheroid-specific role for Wnt-β-catenin and Eph-ephrin signaling in nasopharyngeal carcinoma cells. J Cell Sci. 2021;134. doi:10.1242/jcs.256461
32. Oricchio E, Nanjangud G, Wolfe AL, et al. The Eph-receptor A7 is a soluble tumor suppressor for follicular lymphoma. Cell. 2011;147:554–564. doi:10.1016/j.cell.2011.09.035
33. Li X, Jiang Y, Deng M, Zhang C, Tang H. N-glycosylation of ephrin B1 modulates its function and confers therapeutic potential in B-cell lymphoma. J Biol Chem. 2025;301:108229. doi:10.1016/j.jbc.2025.108229
34. Mosch B, Reissenweber B, Neuber C, Pietzsch J. Eph receptors and ephrin ligands: important players in angiogenesis and tumor angiogenesis. J Oncol. 2010;135285. doi:10.1155/2010/135285
35. Tang Z, Li C, Kang B, et al. GEPIA: a web server for cancer and normal gene expression profiling and interactive analyses. Nucleic Acids Res. 2017;45:W98–w102. doi:10.1093/nar/gkx247
36. Asplund A, Edqvist PH, Schwenk JM, Pontén F. Antibodies for profiling the human proteome-The Human Protein Atlas as a resource for cancer research. Proteomics. 2012;12:2067–2077. doi:10.1002/pmic.201100504
37. Nagy Á, Lánczky A, Menyhárt O, Győrffy B. Validation of miRNA prognostic power in hepatocellular carcinoma using expression data of independent datasets. Sci Rep. 2018;8:9227. doi:10.1038/s41598-018-27521-y
38. Chandrashekar DS, Bashel B, Balasubramanya SAH, et al. UALCAN: a portal for facilitating tumor subgroup gene expression and survival analyses. Neoplasia. 2017;19:649–658. doi:10.1016/j.neo.2017.05.002
39. Cerami E, Gao J, Dogrusoz U, et al. The cBio cancer genomics portal: an open platform for exploring multidimensional cancer genomics data. Cancer Discovery. 2012;2:401–404. doi:10.1158/2159-8290.Cd-12-0095
40. Dennis G, Sherman BT, Hosack DA, et al. DAVID: database for annotation, visualization, and integrated discovery. Genome Biol. 2003;4:P3.
41. Li T, Fan J, Wang B, et al. TIMER: a web server for comprehensive analysis of tumor-infiltrating immune cells. Cancer Res. 2017;77:e108–e110. doi:10.1158/0008-5472.Can-17-0307
42. Liu CJ, Hu FF, Xia MX, et al. GSCALite: a web server for gene set cancer analysis. Bioinformatics. 2018;34:3771–3772. doi:10.1093/bioinformatics/bty411
43. Weinstein JN, Collisson EA, Mills GB, et al. The cancer genome Atlas Pan-Cancer analysis project. Nature Genet. 2013;45:1113–1120. doi:10.1038/ng.2764
44. Omberg L, Ellrott K, Yuan Y, et al. Enabling transparent and collaborative computational analysis of 12 tumor types within the cancer genome Atlas. Nature Genet. 2013;45:1121–1126. doi:10.1038/ng.2761
45. Kim MP, Li X, Deng J, et al. Oncogenic KRAS recruits an expansive transcriptional network through mutant p53 to drive pancreatic cancer metastasis. Cancer Discovery. 2021;11:2094–2111. doi:10.1158/2159-8290.Cd-20-1228
46. Escobar-Hoyos LF, Penson A, Kannan R, et al. Altered RNA splicing by mutant p53 activates oncogenic RAS signaling in pancreatic cancer. Cancer Cell. 2020;38:198–211.e198. doi:10.1016/j.ccell.2020.05.010
47. Lietz CE, Newman ET, Kelly AD, et al. Genome-wide DNA methylation patterns reveal clinically relevant predictive and prognostic subtypes in human osteosarcoma. Commun Biol. 2022;5:213. doi:10.1038/s42003-022-03117-1
48. Yang C, Zhang Q, Tang X, et al. BRCA2 promoter hypermethylation as a biomarker for the leukemic transformation of myeloproliferative neoplasms. Epigenomics. 2022;14:391–403. doi:10.2217/epi-2022-0025
49. Hirai H, Maru Y, Hagiwara K, Nishida J, Takaku F. A novel putative tyrosine kinase receptor encoded by the eph gene. Science. 1987;238:1717–1720. doi:10.1126/science.2825356
50. Barquilla A, Pasquale EB. Eph receptors and ephrins: therapeutic opportunities. Ann Rev Pharmacol Toxicol. 2015;55:465–487. doi:10.1146/annurev-pharmtox-011112-140226
51. Pasquale EB. Eph receptors and ephrins in cancer: bidirectional signalling and beyond. Nat Rev Cancer. 2010;10:165–180. doi:10.1038/nrc2806
52. Ahmed Z, Bicknell R. Angiogenic signalling pathways. Methods mol Biol. 2009;467:3–24. doi:10.1007/978-1-59745-241-0_1
53. Zhuo W, Liu Y, Li S, et al. Long noncoding RNA GMAN, up-regulated in gastric cancer tissues, is associated with metastasis in patients and promotes translation of Ephrin A1 by competitively binding GMAN-AS. Gastroenterology. 2019;156:676–691.e611. doi:10.1053/j.gastro.2018.10.054
54. Li Y, Nie Y, Cao J, et al. G-A variant in miR-200c binding site of EFNA1 alters susceptibility to gastric cancer. Mol Carcinogenesis. 2014;53:219–229. doi:10.1002/mc.21966
55. Zhao Y, Cai C, Zhang M, et al. Ephrin-A2 promotes prostate cancer metastasis by enhancing angiogenesis and promoting EMT. J Cancer Res Clin Oncol. 2021;147:2013–2023. doi:10.1007/s00432-021-03618-2
56. Wang L, Song Y, Wang H, et al. MiR-210-3p-EphrinA3-PI3K/AKT axis regulates the progression of oral cancer. J Cell Mol Med. 2020;24:4011–4022. doi:10.1111/jcmm.15036
57. Gómez-Maldonado L, Tiana M, Roche O, et al. EFNA3 long noncoding RNAs induced by hypoxia promote metastatic dissemination. Oncogene. 2015;34:2609–2620. doi:10.1038/onc.2014.200
58. Xie R, Yuan M, Jiang Y. The pan-cancer crosstalk between the EFNA family and tumor microenvironment for prognosis and immunotherapy of gastric cancer. Front Cell Develop Biol. 2022;10:790947. doi:10.3389/fcell.2022.790947
59. Xie J, Xing S, Shen B-Y, et al. PIWIL1 interacting RNA piR-017061 inhibits pancreatic cancer growth via regulating EFNA5. Human Cell. 2021;34:550–563. doi:10.1007/s13577-020-00463-2
60. Nakajima K, Ino Y, Naito C, et al. Neoadjuvant therapy alters the collagen architecture of pancreatic cancer tissue via Ephrin-A5. Br J Cancer. 2022;126:628–639. doi:10.1038/s41416-021-01639-9
61. van Maaren MC, de Munck L, de Bock GH, et al. 10 year survival after breast-conserving surgery plus radiotherapy compared with mastectomy in early breast cancer in the Netherlands: a population-based study. Lancet Oncol. 2016;17:1158–1170. doi:10.1016/s1470-2045(16)30067-5
62. Chen X, Song E. Turning foes to friends: targeting cancer-associated fibroblasts. Nat Rev Drug Discov. 2019;18:99–115. doi:10.1038/s41573-018-0004-1
63. Özdemir BC, Pentcheva-Hoang T, Carstens J, et al. Depletion of carcinoma-associated fibroblasts and fibrosis induces immunosuppression and accelerates pancreas cancer with reduced survival. Cancer Cell. 2014;25:719–734. doi:10.1016/j.ccr.2014.04.005
64. Rhim AD, Oberstein P, Thomas D, et al. Stromal elements act to restrain, rather than support, pancreatic ductal adenocarcinoma. Cancer Cell. 2014;25:735–747. doi:10.1016/j.ccr.2014.04.021
65. Condamine T, Kumar V, Ramachandran IR, et al. ER stress regulates myeloid-derived suppressor cell fate through TRAIL-R-mediated apoptosis. J Clin Invest. 2014;124:2626–2639. doi:10.1172/jci74056
66. Stromnes IM, Brockenbrough JS, Izeradjene K, et al. Targeted depletion of an MDSC subset unmasks pancreatic ductal adenocarcinoma to adaptive immunity. Gut. 2014;63:1769–1781. doi:10.1136/gutjnl-2013-306271
67. Iclozan C, Antonia S, Chiappori A, Chen DT, Gabrilovich D. Therapeutic regulation of myeloid-derived suppressor cells and immune response to cancer vaccine in patients with extensive stage small cell lung cancer. Cancer Immunol Immunother. 2013;62:909–918. doi:10.1007/s00262-013-1396-8
68. Brandau S, Trellakis S, Bruderek K, et al. Myeloid-derived suppressor cells in the peripheral blood of cancer patients contain a subset of immature neutrophils with impaired migratory properties. J Leukocyte Biol. 2011;89:311–317. doi:10.1189/jlb.0310162
 © 2025 The Author(s). This work is published and licensed by Dove Medical Press Limited. The
full terms of this license are available at https://www.dovepress.com/terms.php
and incorporate the Creative Commons Attribution
- Non Commercial (unported, 4.0) License.
By accessing the work you hereby accept the Terms. Non-commercial uses of the work are permitted
without any further permission from Dove Medical Press Limited, provided the work is properly
attributed. For permission for commercial use of this work, please see paragraphs 4.2 and 5 of our Terms.
© 2025 The Author(s). This work is published and licensed by Dove Medical Press Limited. The
full terms of this license are available at https://www.dovepress.com/terms.php
and incorporate the Creative Commons Attribution
- Non Commercial (unported, 4.0) License.
By accessing the work you hereby accept the Terms. Non-commercial uses of the work are permitted
without any further permission from Dove Medical Press Limited, provided the work is properly
attributed. For permission for commercial use of this work, please see paragraphs 4.2 and 5 of our Terms.