")
Back to Journals » International Journal of Nanomedicine » Volume 19
Silver Nanoparticles (AgNPs) Uptake by Caveolae-Dependent Endocytosis is Responsible for Their Selective Effect Towards Castration Resistant Prostate Cancer
Authors Morais M, Dias F , Figueiredo P, Tavares I, Escudeiro C, Teixeira MR , Teixeira A, Lisboa J , Mikkonen KS , Teixeira AL , Medeiros R
Received 14 November 2023
Accepted for publication 18 May 2024
Published 5 September 2024 Volume 2024:19 Pages 9091—9107
DOI https://doi.org/10.2147/IJN.S447645
Checked for plagiarism Yes
Review by Single anonymous peer review
Peer reviewer comments 2
Editor who approved publication: Prof. Dr. RDK Misra
Mariana Morais,1,2 Francisca Dias,1 Patrícia Figueiredo,3 Inês Tavares,1,2 Carla Escudeiro,4,5 Manuel R Teixeira,2,4,5 Alexandra Teixeira,6 Johnny Lisboa,6 Kirsi S Mikkonen,3,7 Ana L Teixeira,1 Rui Medeiros1,2,8– 10
1Molecular Oncology and Viral Pathology Group, Research Center of IPO Porto (CI-IPOP) / RISE@CI-IPOP (Health Research Network), Portuguese Oncology Institute of Porto (IPO Porto) / Porto Comprehensive Cancer Center (Porto.ccc), Porto, Portugal; 2ICBAS, Abel Salazar Institute for the Biomedical Sciences, University of Porto, Porto, Portugal; 3Department of Food and Nutrition, Faculty of Agriculture and Forestry, University of Helsinki, Helsinki, Finland; 4Department of Laboratory Genetics, Portuguese Oncology Institute of Porto (IPO-Porto)/Porto Comprehensive Cancer Center, Porto, Portugal; 5Cancer Genetics Group, IPO-Porto Research Center(CI-IPOP)/RISE@CI-IPOP (Health Research Network), Portuguese Oncology Institute of Porto (IPO-Porto)/Porto Comprehensive Cancer Center, Porto, Portugal; 6Fish Immunology and Vaccinology, i3S-Instituto de Investigação e Inovação em Saúde, Universidade do Porto, Porto, Portugal; 7Helsinki Institute of Sustainability Science (HELSUS), University of Helsinki, Helsinki, Finland; 8Biomedical Research Center (CEBIMED, Faculty of Health Sciences, Fernando Pessoa University (UFP), Porto, Portugal; 9Research Department, LPCC- Portuguese League Against Cancer (Nrnorte), Porto, Portugal; 10Faculty of Medicine, University of Porto (FMUP), University of Porto, Porto, Portugal
Correspondence: Ana L Teixeira, Molecular Oncology and Viral Pathology Group, Research Center of IPO Porto (CI-IPOP) /RISE@CI-IPOP (Health Research Network), Portuguese Oncology Institute of Porto (IPO Porto)/Porto Comprehensive Cancer Center (Porto. CCC), Research Center-LAB2, E Bdg 1st floor, Rua Dr António Bernardino de Almeida, Porto, 4200-072, Portugal, Tel +351 225 084 000 Ext:5115, Fax +351 225 084 001, Email [email protected]
Purpose: Castration Resistant Prostate Cancer (CRPC) is characterized by poor prognosis and limited therapeutic options. AgNPs functionalized with glucose (G-AgNPs) were observed cytotoxic to CRPC cell lines (PC-3 and Du-145) and not LNCaP. This study aims to evaluate AgNPs and G-AgNPs’ uptake mechanisms in these cells and understand their role in the selective effect against CRPC cells.
Methods: Uptake of AgNPs and G-AgNPs was assessed through transmission electron microscopy (TEM). A microRNA (miRNAs) analysis approach was used to uncover the main molecular differences responsible for the endocytic mechanisms’ regulation. Caveolin (Cav) 1 and 2 mRNA and protein levels were assessed in the three cell lines. Caveolae-dependent endocytosis was inhibited with genistein or siCav1− and siCav2− in PC-3 and Du-145 and resazurin assay was used to evaluate viability after AgNPs and G-AgNPs administration. Caveolae-dependent endocytosis was induced with Cav1+ and Cav2+ plasmids in LNCaP, resazurin assay was used to evaluate viability after AgNPs and G-AgNPs administration and TEM to assess their location.
Results: AgNPs and G-AgNPs were not uptaked by LNCaP. miRNA analysis revealed 37 upregulated and 90 downregulated miRNAs. Functional enrichment analysis of miRNAs’ targets resulted in enrichment of terms related to endocytosis and caveolae. We observed that Cav1 and Cav2 are not expressed in LNCaP. Inhibiting caveolae-dependent endocytosis in Du-145 and PC-3 led to a significative reduction of cytotoxic capacity of AgNPs and G-AgNPs and induction of caveolae-dependent endocytosis in LNCaP lead to a significative increase as well as their uptake by cells.
Conclusion: This study shows the potential of these AgNPs as a new therapeutic approach directed to CRPC patients, uncovers caveolae-dependent endocytosis as the uptake mechanism of these AgNPs and highlights deregulation of Cav1 and Cav2 expression as a key difference in hormone sensitive and resistant PCa cells which may be responsible for drug resistance.
Keywords: prostate cancer resistant to castration, silver nanoparticles, uptake mechanism, caveolins, endocytosis
Introduction
In the last decades, there have been breakthrough advances in the oncology field, but therapy resistance is still the main concern in the success of cancer cell control.1 In prostate cancer (PCa), androgen deprivation therapy (ADT) is the most frequent approach in advanced disease, affecting the androgen receptor (AR) signaling pathway, with high early response rates.2 However, patients develop resistance and progress to castration resistant PCa (CRPC) within a period of 2 to 3 years.3 This form of the disease is characterized by a poor prognosis, impaired quality of life and limited therapeutic options, making the development of new therapies an urgent need.4,5
When designing a new therapeutic agent, there are several aspects to be considered to achieve the highest efficacy of the potential treatment. One of the most important is the efficiency of the uptake of such drug by the targeted cells.6 Indeed, reduced drug uptake is reported as one of the key mechanisms driving resistance to treatment in cancer.7 The composition of cell membrane has been shown to modulate drug diffusion across plasma membrane. Plasma membranes of drug resistant cells show a different lipid composition and pH, making them less fluid and permeable, which reduces drug absorption.8 The activity of uptake transporters also influences drug resistance, modulating the uptake of different drugs in different ways. Interestingly, in PCa, overexpression of the organic anion transporting protein OATP1B3 benefits chemotherapy but not ADT, since it drives testosterone uptake.9 Nanomedicine has arrived as a promising solution regarding the development of new therapeutic approaches in different biomedical fields, including cancer medicine.10 Among the different nanomaterials’ formulation, metallic nanoparticles, such as silver nanoparticles (AgNPs), have brought special interest due to their apparent tissue-specificity, low side-effects, promising antitumoral effects and low production cost.11
Regarding drug delivery, AgNPs can both increase drug concentration in the tumor tissue and improve cellular uptake.12 On one hand, due to the pathophysiological differences of tumor and normal tissues, tumor tissues represent the primary accumulation target of AgNPs. This is called the enhanced permeability and retention (EPR) effect and represents the selective leakage of AgNPs from the vascular lumen and accumulation in the tumor tissue, because of its blood vessels’ high permeability and impaired lymphatic drainage.13 On the other hand, AgNPs need, not only to enter the tissue, but to translocate through cell membranes and target sub-cellular organelles, being endocytosis, which is commonly deregulated in cancer, the main pathway to achieve it.14 When in the extracellular environment, AgNPs interact with cell surface through electrostatic and hydrophobic interactions or via specific ligand-receptor interactions. This will lead to the formation of invaginations from the cell membrane around the AgNPs (budding) and consequent pinch off, forming different endocytic vesicles (early endosomes). The early endosomes will then work as sorting machine carrying the AgNPs either to the different organelles, to recycling endosomes or even evolve as lysosomes.12 Endocytosis can be classified as phagocytosis or pinocytosis, depending on the proteins involved. AgNPs are mainly incorporated through pinocytosis, which can be clathrin-mediated, caveolae-mediated or clathrin and caveolae-independent.15 In PCa, it is known that both clathrin and caveolins’ expression, the major players in clathrin-mediated and caveolae-mediated endocytosis, is androgen regulated, varying according to the stage of the tumor and resistance to therapy, which can influence the success of the uptake of AgNPs through these pathways.16–20
We have previously studied the effect of AgNPs functionalized with glucose (G-AgNPs) in PC-3 and Du-145, which are commercial cell lines derived from a grade IV adenocarcinoma and a prostate carcinoma, respectively, both unresponsive to androgens; and LNCaP, which is a cell line derived from a prostate carcinoma with AR expression and responsive to androgens. We have observed that they were only cytotoxic to the hormone resistant cell lines (PC-3 and Du-145 cells) and not to the hormone sensitive one (LNCaP cells).21 Therefore, and considering the importance of the uptake mechanisms for the cytotoxic effect, the aim of the current study is to evaluate the uptake mechanisms of AgNPs and G-AgNPs by these three cell lines and understand its possible role in the selective effect against CRPC cells. To do so, we applied a microRNA (miRNAs) analysis approach to uncover the main differences in the molecular pathways responsible for the regulation of the endocytic mechanisms. miRNAs are a class of short non-coding RNAs that negatively regulate gene expression at a post-transcriptional level through the binding to complementary sequences in the 3’ untranslated region (3’ UTR) of messenger ribonucleic acids (mRNAs).22 Having such a clear influence in the expression patterns of mRNAs and consequent activation and suppression of different signaling pathways, the levels of miRNAs are different in different pathophysiologic situations, varying between normal and tumor cells, and even among different states of the disease.23 Due to their stability and facility to isolate and quantify, they are an easy approach to screen the molecular state of the cells and find transcriptomic differences that can explain the different cytotoxic effect of G-AgNPs.
Materials and Methods
Cell Culture and Treatments Conditions
PC-3 (ATCC® CRL-1435™ RRID:CVCL 0035) and LNCaP (ATCC® CRL-1740™ RRID:CVCL_1379) cells were purchased at ATCC and Du-145 cells were kindly provided by Professor Cármen Jerónimo from IPO-Porto Research Center (Portugal). All cells were kept in culture in RPMI-1640 medium supplemented with 10% fetal bovine serum (FBS) and 1% penicillin-streptomycin in a humidified incubator at 37°C, 5% CO2 and 95% humidity. Cells were grown in tissue culture flasks and, when at 80–90% confluence, trypsinized with trypsin-EDTA 0.05% (Gibco®, Gaithersburg, MD, USA) and counted using trypan blue solution (VWRTM) and an automatic cell counter (EVETM – NanoEntek). All cells were weekly tested for mycoplasma presence and were found to be free from contamination.
Synthesis of AgNPs
AgNPs were synthesized and characterized as described by Morais et al.21 Briefly, an aqueous solution of 100 mL containing sodium citrate (5 mM) was mixed with tannic acid (5 mM) and heated at 100 °C, for 15 min under vigorous stirring. After boiling, 1 mL of AgNO3 (25 mM) was added. AgNPs were purified through centrifugation at 20,000 g for 15 min and redispersed in MilliQ (MQ) water. To functionalize the AgNPs, 1mg was redispersed with 2 mL of 2 mM sodium citrate containing 5 mM glucosamine hydrochloride and stirred for 24h at room temperature. The resulting G-AgNPs were washed, redispersed in MQ-water, and stored at 4 °C.
Determination of Cellular Localization of AgNPs and G-AgNPs by Transmission Electron Microscopy (TEM)
LNCaP cells were cultured in 12-multi-well plates at a density of 2×10⁵ cells per mL and treated with 2000μg/mL of either AgNPs or G-AgNPs for 24 h. This concentration was chosen, since it represented a higher concentration than the previously determined IC50 of Du-145 (AgNPs-1579 µg/mL and G-AgNPs-1528 µg/mL) and PC-3 cells (AgNPs-911 µg/mL and G-AgNPs-870 µg/mL) and did not present significant toxicity in LNCaP cells.21 After, cells were harvested with a solution of trypsin-EDTA and fixed. Cells were then further processed, and TEM images were collected by the Histology and Electron Microscopy platform from I3S Porto using a Transmission Electron Microscope Jeol JEM 1400.
RNA Extraction
Two million Du-145, PC-3 and LNCaP cells were counted and centrifuged to form a pellet. miRNA isolation and purification was done using the Plasma/Serum RNA Purification Mini Kit from NORGEN (Norgen Biotek Corporation, Thorold, ON, Canada) according to the manufacturer protocol. RNA concentration and purity were measured using the NanoDrop Lite spectrophotometer (Thermo Scientific®, Waltham, MA, USA).
miRNA Profiling Through NanoString Analysis
The miRNA profiling of the three cell lines was performed using the nCounter® Human v3 miRNA expression assay (NanoString Technologies), using an input of 100 ng of sample, according to manufacturer instructions. Through a NanoString’s amplification-free technology the assay does expression profiling by direct quantification of individual RNA molecules, without the use of reverse transcription or amplification by using molecular barcodes. This panel allows the analysis of 799 miRNAs, 5 mRNAs and contains 25 internal reference controls. Data was then analyzed through ROSALIND® (https://rosalind.onramp.bio/), with a HyperScale architecture developed by ROSALIND, Inc. (San Diego, CA). Read Distribution percentages, violin plots, identity heatmaps, and sample MDS plots were generated as part of the QC step. The criteria given by Nanostring (nSolver 4.0 Analysis Software User Manual) was used to calculate normalization, fold changes and p-values. After background subtraction based on POS_A probe correction factors, normalization was performed in two steps: positive control normalization and codeset normalization. During both steps the geometric mean of each probe set is used to create a normalization factor. Differential expression of the hormone resistant cell lines (PC-3 and Du-145) against hormone sensitive cell line (LNCaP) was then assessed through linear models, using the ROSALIND software, and miRNAs were classified as differentially expressed according to a fold‑change <-1.5 or >1.5 and p<0.05.
In silico Analysis
miRTarBase (version 9), the largest known online database of validated miRNA:mRNA target interactions, was used to establish a network of the target mRNAs of the deregulated miRNAs.24 A total of 699 validated targets for the downregulated miRNAs and 965 validated targets for the upregulated miRNAs were retrieved. The Search Tool for the Retrieval of Interacting Genes (STRINGapp) in the Cytoscape software (v3.9.1) was used to build the protein interaction relationship of the selected target genes encoding proteins, considering as significant the ones with a combined score of >0.4. To better understand the resulting PPI network, proteins were grouped according to their cellular compartment location using the compartment filters of cytoscape focusing on three different categories: lysosome, plasma membrane and endosome. Following, the functional enrichment analysis of GO, Reactome, Kyoto Encyclopedia of Genes and Genomes (KEGG) pathways and Compartments was performed with the enrichment analysis tool of the STRINGapp, with a False Discovery Rate (FDR) of p < 0.01 as significance threshold. The enrichment results were filtered to remove redundant terms, using the redundancy filtering and the Jaccard índex.
Caveolins mRNA Quantification
Two million cells were counted and centrifuged to form a pellet. mRNA extraction was performed using the GRS Total-Blood & Cultured Cells kit (Grisp Research Solutions®, Porto, Portugal). Concentration and purity of the isolated mRNA was assessed by absorbance measurement at 260/280 nm using NanoDrop Lite Spectrophotometer (Thermo fisher®, Waltham, MA, USA). mRNA samples served as templates for complementary DNA (cDNA) synthesis using a High-Capacity cDNA Reverse Transcription Kit (Applied Biosystems®, Waltham, MA, USA). The thermal conditions for PCR amplification were optimized to 25 °C for 10 min, followed by 37 ◦C for 120min and 85 ◦C for 5 min. mRNA expression was assessed by quantitative real-time PCR using StepOneTMqPCR Real-Time PCR machine. The reaction was performed using 1X Master mix (Applied Biosystems), with 1X probes (TaqMan mRNA Expression Assays CAV1 Hs00971716_m1, CAV2 Hs00184597_m1, CAV2 Hs00971711_m1 and B2M Hs00187842_m1) and cDNA sample. The amplification conditions were as follows: holding stage 95 °C for 20 sec, followed by 45 cycles of 95 °C for 1sec and 60 °C for 20 sec. Three technical replicates were made for each sample. StepOne Software v2.2 (Applied Biosystems®, Waltham, MA, USA) was used for data analysis and the baseline and thresholds were set for each plate to create the threshold cycle (Ct) values. All quantifications were performed in duplicate, and each plate had a negative control.
Caveolins Protein Expression
Two million PC-3, Du-145 and LNCaP cells were counted and centrifuged to form a pellet. Pellet was incubated for 15sec with 150 μL of RIPA buffer (Radioimmunopre-cipitation Assay Buffer) (Santa Cruz Biotechnology®, Dallas, TX, USA) supplemented with 1.5 μL of phosphatase inhibitor cocktail (Thermo Fisher Scientific®) and then centrifuged for 15 min at 14,000× g, at 4 ◦C. The supernatant was recovered for protein quantification using a DC Protein Assay (BioRad Laboratories®, Hercules, CA, USA), measuring the solution’s absorbance at 750 nm. The electrophoretic separation of proteins (25 μg) was performed in Mini-Protean TGX Gels (4–20%) (BioRad Laboratories®) and transferred onto a nitrocellulose membrane in 25 mM Tris-base/glycine buffer. Membranes were blocked using 5% BSA (Albumin BovineFraction V) (Enzytech®, Lisbon, Portugal) in Tris-buffered saline with Tween 20 (TBS-T). Membranes were then incubated with primary antibodies (CAV1 (HPA049326) (1:1000) (Sigma-Aldrich®), CAV2 (ZC013) (1:1000) (Thermofisher®), B-Actin (C4): sc-47778) (1:5000) (SantaCruz), overnight at 4°C. Membranes were then incubated with conjugated secondary antibodies (anti-mouse (1:70,000) (62–6520) and anti-rabbit (65–6120) (1:60,000) (Thermofisher®)) for 30’ at room temperature. The chemiluminescence was evaluated using ECLTM Prime Western Blotting System (CytivaTM, Amersham, UK), according to manufacturer’s instructions.
Endocytosis Inhibition Through Genistein
Genistein is a highly specific, dose-dependent inhibitor of tyrosine kinases and is known to disrupt the arrangements of actin and prevent the mobilization of dynamin for plasma membranes, two mechanisms vital for Caveolae-dependent endocytosis.25 To inhibit caveolae-dependent endocytosis, Du-145 and PC-3 cells were plated at a concentration of 2.0×10⁵ cells/mL in 96-well plates at a final volume of 100μL/well. The following day, genistein was added at the ideal concentration for each cell line. In a first instance, a dose screening of genistein was performed in each cell line to select the ideal genistein concentration and incubation time, to inhibit endocytosis without affecting viability and 25μM for 1 h and 20μM for 2 h were selected for Du-145 and PC-3, respectively. After incubation time, genistein was washed off with PBS and nanoparticles were added.
siRNA Cav1 and Cav2 Transfection
2.5x10⁵ cells were plated per well in 6-well plates at a final volume of 2.2mL of antibiotics-free RPMI medium supplemented with 10% FBS. After 24 h, transfection mix was incubated for 15’ in a final volume of 300μL/well of Opti-mem (Thermofisher®), using 40nM siCav1 (Thermofisher®, Assay ID 10297) or siCav2 (Thermofisher®, Assay ID 145681) alone and in combination with 6μL (or 9μL, when co-transfected Cav1 and Cav2) of Lipofectamine RNAimax (Thermofhisher®). siCav1, siCav2 and lipofectamine concentrations were selected to maximize transfection potential and cells tolerability. Transfection mix was then added to the plated cells for 24h. All cells were checked for detachment and stress signals through bright field microscopy observation. After, cells were collected for RNA or protein extraction. Silencer™ Negative Control No. 1 siRNA (#4404021) was used as a negative control of transfection, BLOCK-iT™ Alexa Fluor™ Red Fluorescent Control (Thermofisher®) was used as a positive control of transfection and cells were imaged with filter set appropriate for Tetramethylrhodamine (TRITC) using a fluorescence microscope OLYMPUS IX51 (Tokyo, Japan). For resazurin assay, 2.0×10⁵ cells/mL were plated in 96-well plates at a final volume of 100μL/well in antibiotics-free RPMI medium supplemented with 10% FBS. After 24 h, transfection mix was incubated for 15 min in a final volume of 50μL/well of Opti-mem, using 40nM siCav1 or siCav2 alone and in combination with 1μL (or 1.5μL when co-transfected Cav1 and Cav2) of Lipofectamine RNAimax. Transfection mix was added to the plated cells for 24 h. After incubation time, transfection mix was washed off with PBS, cells were checked for detachment and stress signals through bright field microscopy observation, nanoparticles were added, and resazurin assay was performed.
Plasmid Transfection
pCMV6-CAV1 (RefSeq: NM_001753.3, Origene, Cat#RC210274L3V) and pCMV6-CAV2 (RefSeq: NM_198212.3, Origene, Cat#RC217364) were transformed in E. coli DH5α strain, by heat shock method (Rahimzadeh et al, 2016; Li et al, 2007), using 100 ng of plasmid. Transformed E. coli DH5α cells were cultured overnight at 37°C in 20 mL of Luria Bertani (LB) broth with shaking (200 rpm) to obtain a large quantity of the desired plasmid. Plasmid extraction was performed using NZYMiniprep kit (NZYTech, MB01002) following manufacturer’s instructions and final DNA plasmid was quantified using the NanoDrop One (ThermoFisher). 5×10⁵ cells were plated per well in 6-well plates at a final volume of 2.25mL of antibiotics-free RPMI medium supplemented with 10% FBS. After 24 h, transfection mix was incubated for 10’ in a final volume of 250μL/well of Opti-mem, using 3μg of each plasmid, 5.75μL of Lipfectamine3000 (Thermofisher®) and 5μL of P3000 (Thermofisher®). Plasmids and lipofectamine concentrations were selected to maximize transfection potential and cells tolerability. Transfection mix was then added to the plated cells for 24h. All cells were checked for detachment and stress signals through bright field microscopy observation. After, cells were collected for RNA or protein extraction. For resazurin assay, 2.0×10⁵ cells/mL were plated in 96-well plates at a final volume of 100μL/well in antibiotics-free RPMI medium supplemented with 10% FBS. After 24 h, transfection mix was incubated for 10’ in a final volume of 10μL/well of Opti-mem, using 150ng of each plasmid, 0.4μL of Lipfectamine3000 and 0.2μL of P3000. Transfection mix was added to the plated cells for 24 h, after which AgNPs and G-AgNPs were added, and the assay was performed.
Resazurin Assay
After transfection of Cav1 or/and Cav2, AgNPs and G-AgNPs were administrated at a concentration range of 600µg/mL-1000µg/mL for PC-3 cells, 600–25000µg/mL for Du-145 and 500–25000µg/mL for LNCaP cells, for 24 h. The range of concentrations was the same previously used to test AgNPs and G-AgNPs cytotoxic effect in these cell lines.21 After, resazurin Sodium Salt (ACROS Organic™ – Fisher Scientific®, MA, USA) was used to assess cells’ viability. Cell’s viability after AgNPs and G-AgNPs administration was compared to cells administrated with genistein, siRNA or plasmid, alone.
Statistical Analysis
Using the sample T test, the Mann–Whitney and the Kruskal Wallis tests (depending on whether the results followed or not a normal distribution), the results were analyzed using SPSS28 software (release 28, SPSS Inc., Chicago, IL/USA). p-values less than <0.05 were considered as statistically significant.
Results
AgNPs were previously characterized showing an average size of 61 ± 10 nm and a PDI value lower than 0.25, suggesting moderate monodispersity. Their surface charge was highly negative (−59 ± 6 mV), their shape was roughly round, and they showed a UV-Vis absorption peak at 412 nm. After functionalization with glucosamine, G-AgNP average size was of 64 ± 11 nm with no significant change in the PDI value. Their ζ-potential slightly increased to −50 ± 4 mV and they showed a UV-Vis absorption peak at 563 nm. Interestingly, AgNPs and G-AgNPs remained stable when incubated with cell culture medium, with a slight increase of size, and surface charge, remaining monodispersed.21
AgNPs and G-AgNPs are Not Uptake by LNCaP Cells
We have previously demonstrated that AgNPs and G-AgNPs were cytotoxic to PC-3 and Du-145 cells, being uptaked through an apparent endocytic mechanism and being located in different subcellular locations of the cell. However, they were found not cytotoxic to LNCaP cells.21 Through the TEM analysis, we can observe that both AgNPs (Figure 1A–C) and G-AgNPs (Figure 1D–F) are mainly located outside the cell, which indicates there is no significant uptake by LNCaP cells.
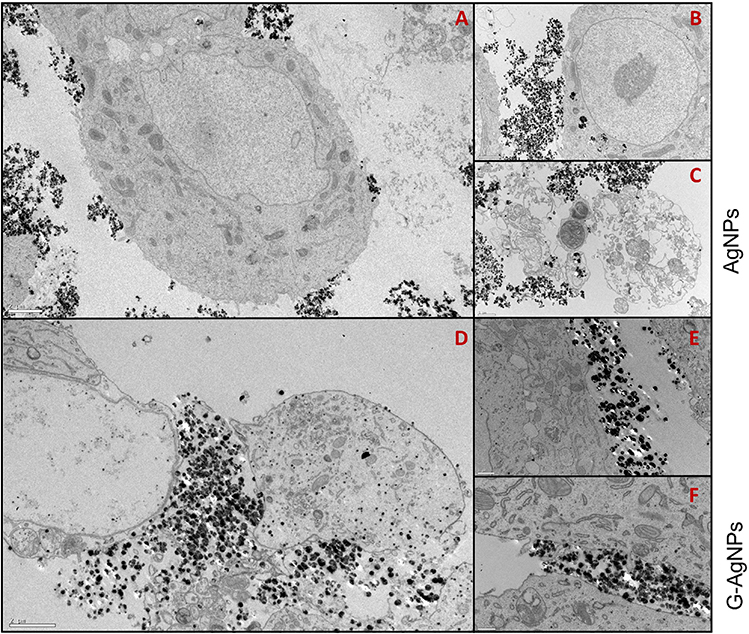 |
Figure 1 TEM images of LNCaP cells treated with 2000μg/mL of AgNPs (A–C) or G-AgNPs (D–F). From each sample, three pictures were taken with different ampliations. Thus, scale bars in A, B and D are 2μm, in C and E are 1μm, and in F are 0.5 μm. NPs are the black dots presented in the figures. |
LNCaP Cells Have a Different miRNA-Profile Compared with PC-3 and Du-145
To better understand the differences in toxicity of AgNPs and G-AgNPs, we compared the molecular profile of PC-3 and Du-145 with LNCaP cells, through a microRNA expression profile approach. After expression analysis of 799 hsa-miRNAs, using the Nanostring® technology, 37 downregulated miRNAs and 90 upregulated miRNAs were found (Figure 2A and Tables S1 and S2). To explore the biological impact of these deregulated miRNAs, the 699 target genes of the downregulated miRNAs were analyzed using the STRINGapp from Cytoscape software (v3.7.2). To assess their relevance in the uptake of the NPs, we focused on the following cellular compartments: lysosome, plasma membrane and endosome. We then filtered the target genes to a PPI network of 40 nodes and 183 edges that presented significant enrichment (p = 1.0×10⁻¹⁶) (Figure 2B). Similarly, we analyzed the 965 target genes of the upregulated miRNAs. Once again, their relevance in the uptake of the NPs was assessed, focusing on lysosome, plasma membrane and endosome. This filtered the target genes to a PPI network of 45 nodes and 252 edges that presented significant enrichment (p = 1.0×10⁻¹⁶) (Figure 2C). The functional enrichment analysis of the PPI network of 40 nodes and 183 edges was performed with an FDR threshold of 1%, and the redundant terms were eliminated using a redundancy cutoff of 0.5, resulting in a total of 239 enriched terms among the Reactome, KEGG, and GO categories (Tables S3–S8). The top 20 enriched terms for each category are represented in Figure 2D. Among the enriched terms, we highlight the terms “plasma membrane signaling complex”, “cytoplasm vesicle membrane”, “endocytic vesicle membrane”, “membrane trafficking”, “ABC transporters”, “endocytosis” and “caveolae”.
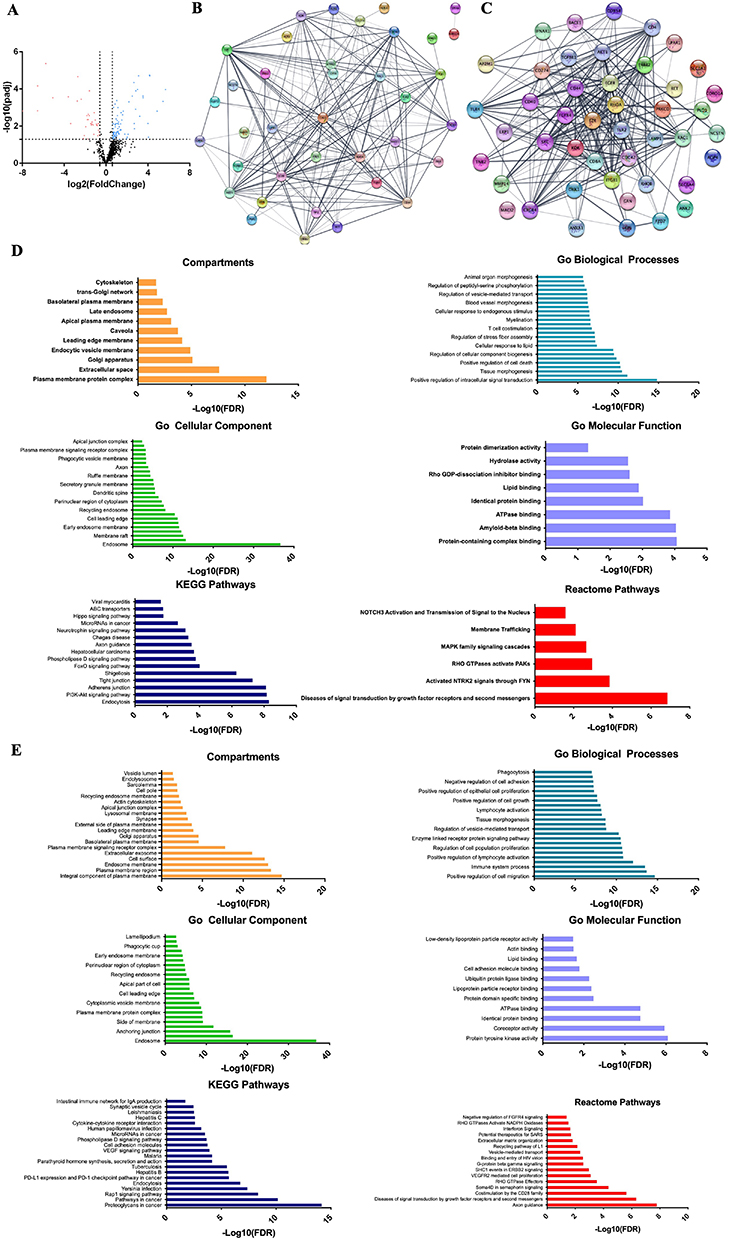 |
Figure 2 Molecular profile comparison of PC-3 and Du-145 with LNCaP cells. (A) Volcano plots of the differentially expressed miRNAs when comparing PC-3 and Du-145 cells with LNCaP cells. The y-axis indicates the Log10 of the p values and the x-axis is the Log2 transformed ratio of the expression between the experimental groups. (B) PPI network of the 40 proteins derived from the target genes of the upregulated miRNAs performed using Cytoscape. (C) PPI network of the 45 proteins derived from the target genes of the downregulated miRNAs performed using Cytoscape. (D) Compartments, GO, KEGG and Reactome analysis of the 40 selected genes derived from the upregulated miRNAs. The functional enrichment analysis was made with the STRINGapp from Cytoscape. (E) Compartments, GO, KEGG and Reactome analysis of the 45 selected genes derived from the downregulated miRNAs. The functional enrichment analysis was made with the STRINGapp from Cytoscape. |
On the other hand, the functional enrichment analysis of the PPI network of 45 nodes and 252 edges was performed with an FDR threshold of 1%, and the redundant terms were eliminated using a redundancy cutoff of 0.5, resulting in a total of 281 enriched terms among the Reactome, KEGG, and GO categories (Tables S9–S14). The top 20 enriched terms for each category are represented in Figure 2E. Among the enriched terms, we highlight the terms “endolysosome”, “phagocytosis”, “regulation of vesicle-mediated transport”, “clathrin-coated vesicle” and “lysosomal membrane”.
Considering these results, which relate the caveolae-dependent endocytosis with the downregulated miRNAs and upregulated proteins and, the clathrin-dependent endocytosis with the upregulated miRNAs and downregulated proteins, we further studied the caveolae-dependent endocytosis in the three cell lines and their role in the cytotoxic effect.
Caveolin 1 and Caveolin 2 are Expressed Differently Among LNCaP, PC-3 and Du-145 Cells
To study the caveolar-dependent endocytosis pathway in LNCaP, PC-3 and Du-145 cells, the mRNA expression levels and the protein levels of both Cav1 and Cav2 were assessed in the three cells lines. In fact, the mRNA levels of Cav1 are significantly higher in PC-3 and Du-145 cells when compared to LNCaP (fold-change=3104.2, p<0.001; fold-change=4871.0, p<0.001, respectively) (Figure 3A). Similarly, the mRNA levels of Cav2 are significantly higher in PC-3 and Du-145 cells when compared to LNCaP (fold-change=891.0, p<0.001; fold-change=3492.4, p<0.001, respectively) (Figure 3A). Regarding the protein levels of both Cav1 and Cav2, one can observe that there is no expression in the LNCaP cell line (Figure 3B–D).
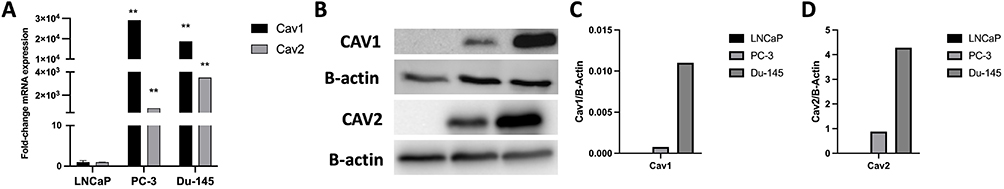 |
Figure 3 (A) Variation of the relative expression levels of Cav1 and Cav2 in LNCaP, PC-3 and Du-145 cells (mean ± SE); (B) Protein levels of Cav1 and Cav2 in LNCaP, PC-3 and Du-145 cells according to Western Blot analysis; (C) Relative quantification of Cav1 expression relative to B-Actin in LNCaP, PC-3 and Du-145; (D) Relative quantification of Cav2 expression relative to B-Actin in LNCaP, PC-3 and Du-145; **p<0.001 (t-student test). |
The modulation of the Caveolae-dependent endocytosis pathway inhibits AgNPs and G-AgNPs cytotoxic effect in PC-3 and in Du-145
To confirm that the caveolae-dependent endocytosis is a key player in the AgNPs and G-AgNPs cytotoxic effect in PC-3 and in Du-145 cell line, we inhibited this pathway either through genistein or inhibition of Cav1 and Cav2 using siRNA technology, confirming this transfection using both positive and negative control (Figure S1A–D). In fact, inhibition of this endocytic pathway with genistein 20μM in PC-3, led to a reduction of the inhibitory effect of both AgNPs and G-AgNPs (Figure 4A and B, respectively). After administration of 1500μg/mL of AgNPs and G-AgNPs, PC-3 cells showed a viability of 70.61% (p<0.001) and 70.35% (p<0.001), respectively, when genistein was previously administrated, compared with 29.78% and 29.08%, respectively, without genistein administration. Similarly, inhibition of Cav1 led to a reduction of the inhibitory effect of both AgNPs and G-AgNPs (Figure 4C and D, respectively). After administration of 1500μg/mL of AgNPs and G-AgNPs, PC-3 cells showed a viability of 61.25% (p<0.001) and 58.02% (p<0.001), respectively, when Cav1 was inhibited, compared with 29.78% and 29.08%, respectively, without inhibition. Inhibition of Cav2 led to a reduction of the inhibitory effect of both AgNPs and G-AgNPs (Figure 4E and F, respectively). After administration of 1500μg/mL of AgNPs and G-AgNPs, PC-3 cells showed a viability of 59.32% (p<0.001) and 59.06% (p<0.001), respectively, when Cav2 was inhibited, compared with 29.78% and 29.08%, respectively, without inhibition. Inhibition of Cav2, combined, led to a reduction of the inhibitory effect of both AgNPs and G-AgNPs (Figure 4G and H, respectively). After administration of 1500μg/mL of AgNPs and G-AgNPs, PC-3 cells showed a viability of 54.76% (p<0.001) and 59.84% (p<0.001), respectively, when Cav1 and Cav2 were inhibited, compared with 29.78% and 29.08%, respectively, without inhibition. In a similar way, inhibition of the endocytic pathway in Du-145 cells, using genistein 25μM, led to a reduction of the inhibitory effect of both AgNPs and G-AgNPs (Figure 5A and B, respectively). After administration of 2500μg/mL of AgNPs and G-AgNPs, Du-145 cells showed a viability of 83.78% (p<0.001) and 42.54% (p<0.001), respectively, when genistein was previously administrated, compared with 26.99% and 23.56%, respectively, without genistein administration. Inhibition of Cav1 led to a reduction of the inhibitory effect of both AgNPs and G-AgNPs (Figure 5C and D, respectively). After administration of 2500μg/mL of AgNPs and G-AgNPs, Du-145 cells showed a viability of 93.79% (p<0.001) and 64.32% (p<0.001), respectively, when Cav1 was inhibited, compared with 26.99% and 23.56%, respectively, without inhibition. Inhibition of Cav2 led to a reduction of the inhibitory effect of both AgNPs and G-AgNPs (Figure 5E and F, respectively). After administration of 2500μg/mL of AgNPs and G-AgNPs, Du-145 cells showed a viability of 100% (p<0.001) and 91.97% (p<0.001), respectively, when Cav2 was inhibited, compared with 26.99% and 23.56%, respectively, without inhibition. Finally, inhibition of Cav1 and Cav2, combined, led to a reduction of the inhibitory effect of both AgNPs and G-AgNPs (Figure 5G and H, respectively). After administration of 2500μg/mL of AgNPs and G-AgNPs, Du-145 cells showed a viability of 50.77% (p<0.001) and 53.15% (p<0.001), respectively, when Cav1 and Cav2 were inhibited, compared with 26.99% and 23.56%, respectively, without inhibition.
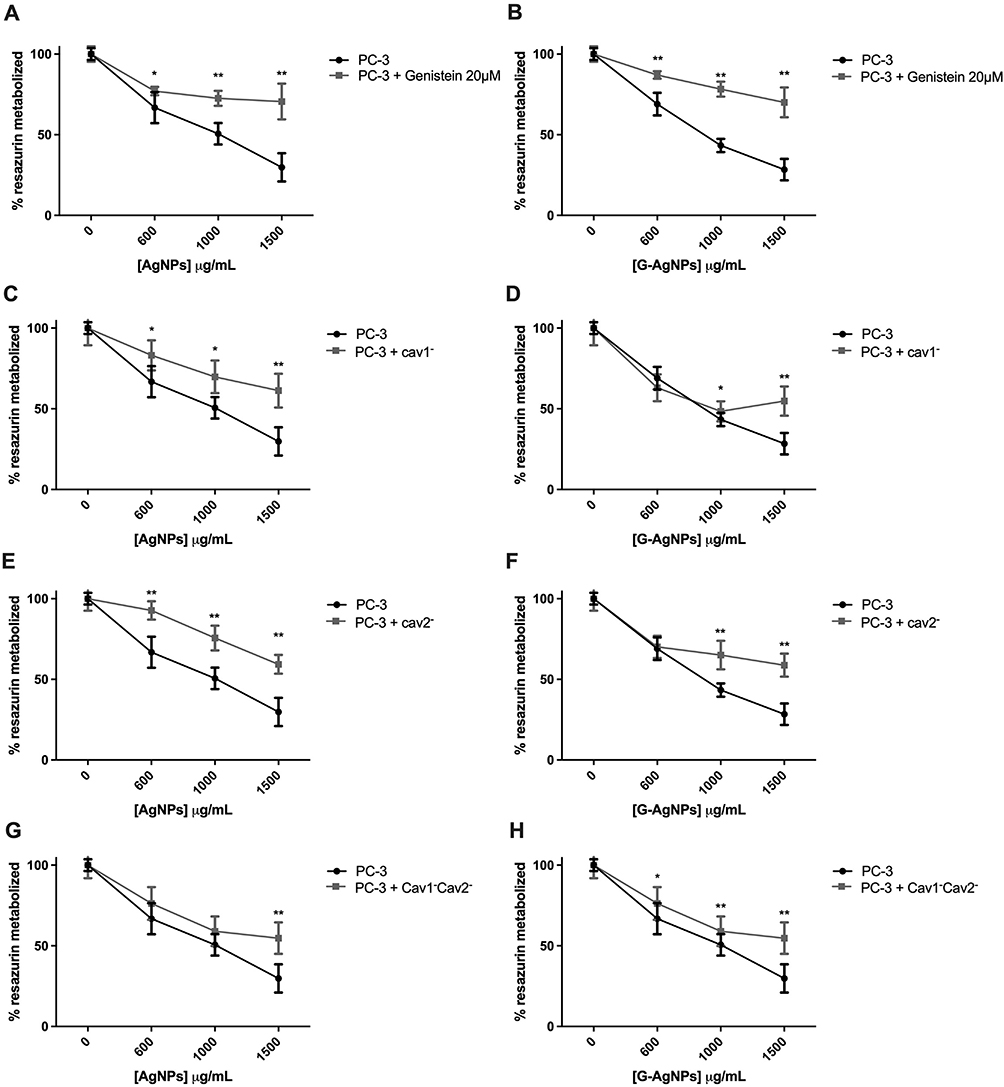 |
Figure 4 Comparison of cell viability, by Resazurin Assay, upon treatment with AgNPs and G-AgNPs for 24 h in PC-3 cell line with or without previous inhibition using Genistein 20μM (A and B), using siCav1 (Cav1−) (C and D), using siCav2 (Cav2−) (E and F), and both siCav1 and siCav2 (Cav1−Cav2−) (G and H). Genistein was added for 1 h at concentration of 20μM; siCav1 and siCav2 was added for 24h at concentration of 40nM in combination with 1μL of lipofectamine or 1.5μL, when added simultaneously. Both were washed off after incubation and nanoparticles were added. Results are expressed as percentage of control (-●-: -genistein/-AgNPs; -■-: +genistein/-AgNPs cells), as mean ± SEM. *p<0.05, ** p<0.001 (5 replicates, sample T test, Kruskal Wallis tests depending on whether the results followed or not a normal distribution). |
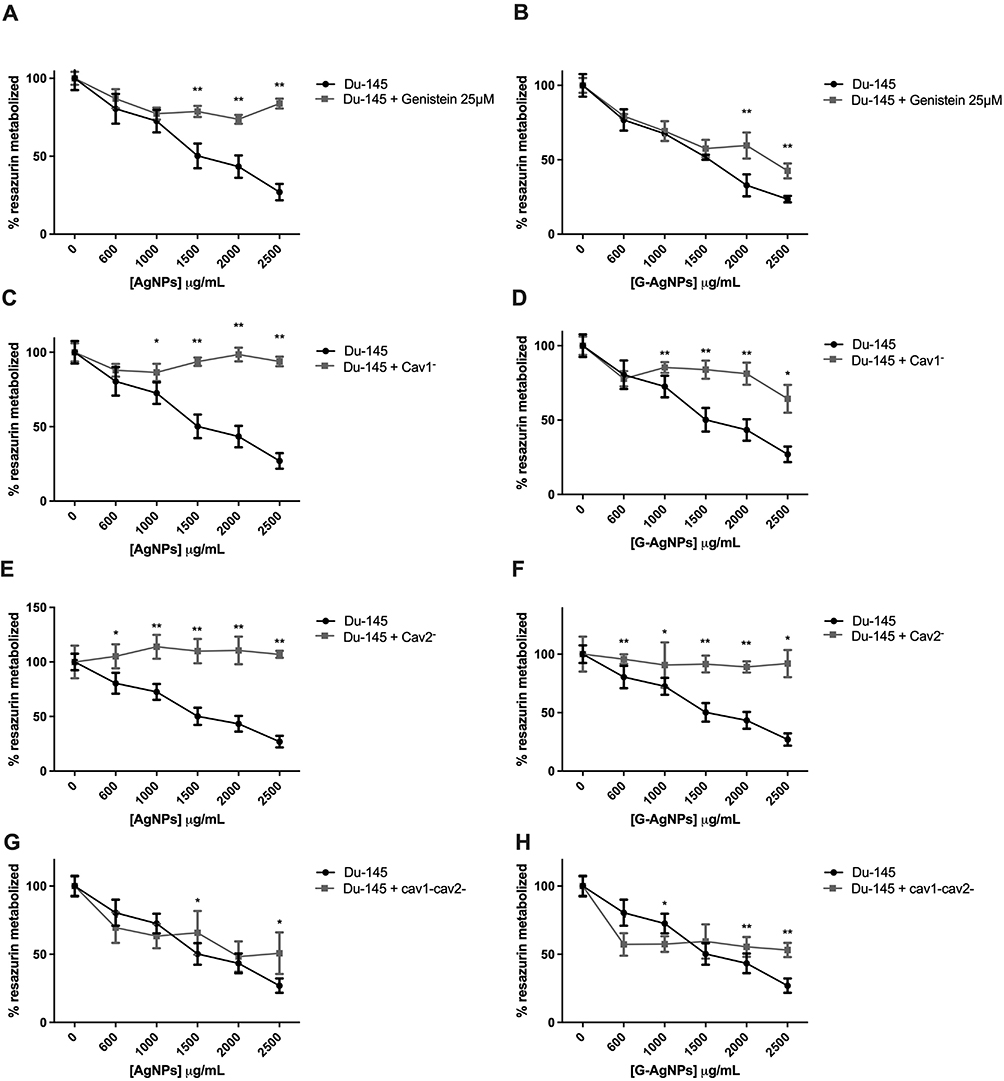 |
Figure 5 Comparison of cell viability, by Resazurin Assay, upon treatment with AgNPs and G-AgNPs for 24 h in Du-145 cell line with or without previous inhibition using Genistein (A and B), using siCav1 (Cav1−) (C and D), using siCav2 (Cav2−) (E and F), and both siCav1 and siCav2 (Cav1−Cav2−) (G and H). Genistein was added for 2 h at concentration of 25μM; siCav1 and siCav2 was added for 24h at concentration of 40nM in combination with 1μL of lipofectamine or 1.5μL, when added simultaneously. Both were washed off after incubation and nanoparticles were added. Results are expressed as percentage of control (-●-: -genistein/-AgNPs; -■-: +genistein/-AgNPs cells), as mean ± SEM. *p<0.05, **p<0.001 (5 replicates, sample T test, Kruskal Wallis tests depending on whether the results followed or not a normal distribution). |
The modulation of the Caveolae-dependent endocytosis pathway induces AgNPs and G-AgNPs cytotoxic effect in LNCaP
To further confirm caveolae-dependent endocytosis pathway as the key factor in AgNPs and G-AgNPs entrance in cells, Cav1 and Cav2’s expression was induced in LNCaP cell line, and the NPs cytotoxic effect was evaluated. Cav1 and Cav2 mRNA expression were further confirmed (Figure S1E). Induction of Cav1 led to an increased inhibitory effect of both AgNPs and G-AgNPs (Figure 6A and B, respectively). After administration of 2500μg/mL of AgNPs and G-AgNPs, LNCaP cells showed a viability of 42.27% (p<0.001) and 53.39% (p=0.002), respectively, when Cav1 was induced, compared with 108.18% and 95.82%, respectively, without induction. Similarly, induction of Cav2 led to an augmented inhibitory effect of both AgNPs and G-AgNPs (Figure 6C and D, respectively). After administration of 2500μg/mL of AgNPs and G-AgNPs, LNCaP cells showed a viability of 40.29% (p<0.001) and 88.75% (p=0.507), respectively, when Cav2 was induced, compared with 108.18% and 95.82%, respectively, without induction. Finally, induction of Cav1 and Cav2, combined, led to an inhibitory effect of both AgNPs and G-AgNPs (Figure 6E and F, respectively). After administration of 2500μg/mL of AgNPs and G-AgNPs, LNCaP cells showed a viability of 45.80% (p<0.001) and 57.02% (p<0.001), respectively, when Cav1 and Cav2 were inducted, compared with 108.18% and 95.82%, respectively, without inhibition.
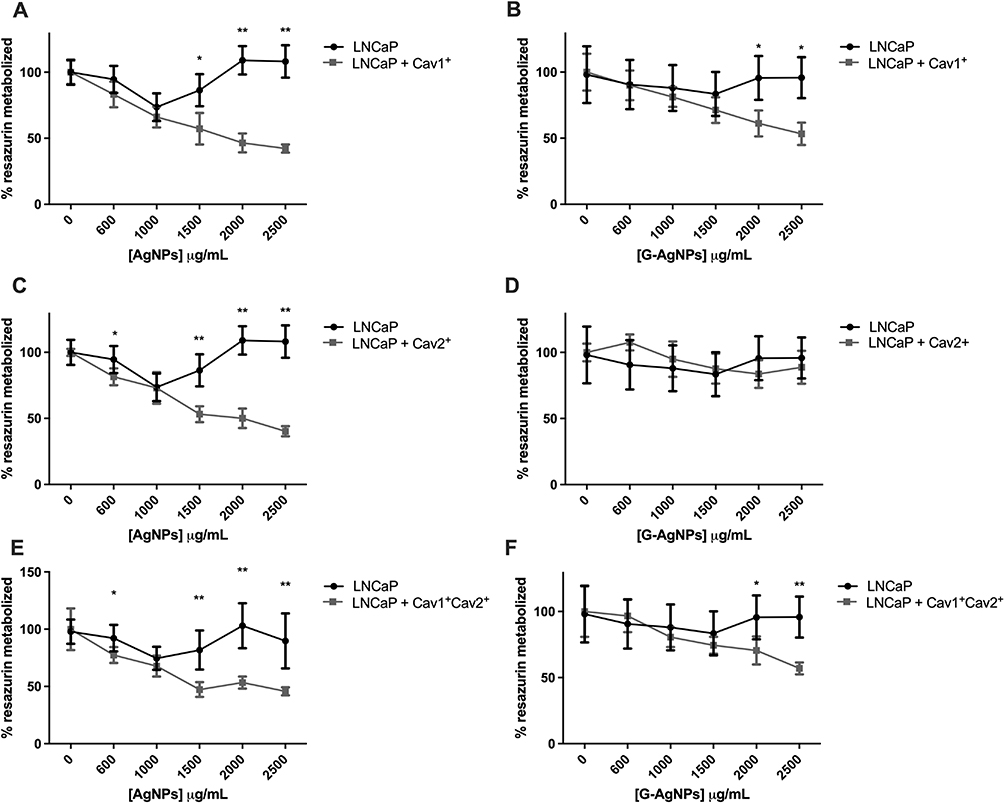 |
Figure 6 Comparison of cell viability, by Resazurin Assay, upon treatment with AgNPs and G-AgNPs for 24 h in LNCaP cell line with or without previous induction of Cav1 (Cav1+) (A and B), Cav2 (Cav2+) (C and D), and both Cav1 and Cav2 (Cav1+Cav2+) (E and F). Results are expressed as percentage of control (-●-: -plasmid/-AgNPs; -■-: +plasmid/-AgNPs cells), as mean ± SEM. *p<0.05, **p<0.001 (5 replicates, sample T test, Kruskal Wallis tests depending on whether the results followed or not a normal distribution). |
AgNPs and G-AgNPs are Uptaked by LNCaP Cells After Induction of Cav1 and Cav2’s Expression
To prove that the differences in the cytotoxic effect of AgNPs and G-AgNPs after induction of Cav1 and Cav2 expression was due to the uptake of the NPs by the cells, we conducted a TEM analysis (Figure 7). One can see that, in the different conditions (Cav1+, Cav2+, and Cav1+Cav2+), for both AgNPs (Figure 7A–I, respectively) and G-AgNPs (Figure 7J–R, respectively), the NPs are located inside the cells, in different organelles, such as nucleus (Figure 7A), mitochondria (Figure 7D) and cytoplasm (Figure 7G). They seem to be trapped inside lysosomes or caveosomes (Figure 7I) after being uptaked by endocytosis (Figure 7R). Moreover, the cells display apoptotic features such as membrane blebbing (Figure 7R) which are in accordance with the viability studies performed.
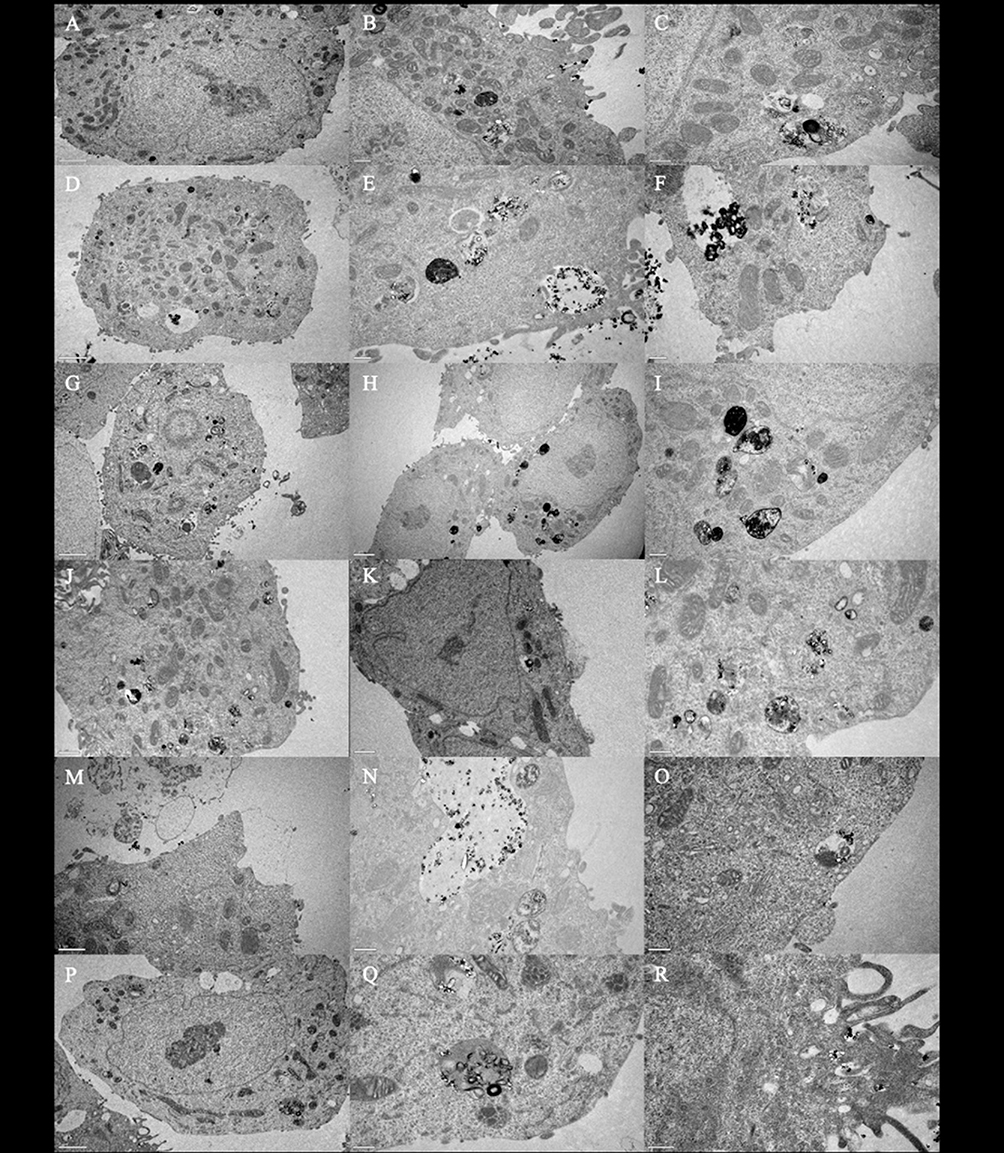 |
Figure 7 TEM images of LNCaP cells transfected with Cav1+ (A–C and J–L), Cav2+ (D–F and M–O), Cav1+Cav2+ (G–I and P–R) and treated with 2000μg/mL of AgNPs (A–I) or G-AgNPs (J–%). From each sample, three pictures were taken with different ampliations. Thus, scale bars in (A, D, G and H) are 2μm, in (J, K and M) are 1μm, and in (B–F), (L, N, O, Q and R) are 0.5 μm. |
Discussion
Despite the development and introduction of new drugs such as enzalutamide and abiraterone acetate in the management of the most lethal form of PCa – CRPC, this form of the disease remains non curative, and there is an urgent need for new therapies in the clinical management of these patients.2 With the burst of nanomedicine research, the opportunity to use AgNPs as anticancer agents has been widely studied.11 Indeed, we have previously designed AgNPs functionalized with glucose that were able to target PCa cells, more specifically Androgen Receptor (AR)− cells (PC-3 and Du-145). Those G-AgNPs were significantly more toxic than AgNPs without functionalization, however, they were shown not cytotoxic to the AR+ ones (LNCaP).21 In this study, we focused on understanding what was the mechanism responsible for the selective cytotoxic effect of these NPs in PC cell lines.
After a TEM analysis of LNCaP cells previously incubated with either AgNPs or G-AgNPs, we could observe that there was no uptake by the cells. In fact, previous studies have reported that the entry pathway and intracellular localization of NPs are determinant for the induction of cytotoxicity.26 Yusuf and collaborators, for example, showed that by encapsulating AgNPs in a dipalmitoyl-phosphatidyl choline (DPPC) liposome, there was an increase in the uptake of the AgNPs by macrophages and that directly correlated with an increased cytotoxic capacity.27
Due to the observed lack of uptake by LNCaP cells in the present study, we sought any molecular differences, through a definition of a deregulated-miRNA profile. In the present study we determined 37 downregulated and 90 upregulated miRNAs when comparing PC-3 and Du-145 with LNCaP cells. We further performed a functional annotation analysis on the validated target genes of the downregulated and upregulated miRNAs, focusing on the cellular compartments lysosome, plasma membrane and endosome and we observed that most enriched terms were related to endocytosis, cytoplasm vesicle, endocytic vesicle and lysosomal membrane, membrane trafficking and regulation of vesicle mediated transport. These results seem to indicate that the deregulated miRNAs may play a role in the expression of genes related to the endocytic pathways. In the past, Johnson and colleagues had already shown that endosome biogenesis and function was altered in PCa, with a significant increase in gene and protein expression for early endosomal proteins and an altered endosomal traffic and signaling of the transferrin receptors in PC cells.28 Moreover, in another study, Xu and colleagues have reported that dynamin 2 (Dyn2), essential for intracellular vesicle formation and trafficking, cytokinesis, and receptor endocytosis, was significantly increased across advanced stages of PCa and was associated with poor prognosis.29
In the present study, the potentially upregulated protein network related with the downregulated miRNAs revealed the term caveolae and the downregulated protein network related with the upregulated miRNAs revealed the term clathrin-coated vesicle. The different expression of caveolae related proteins in the different phases of PCa has been already described.30–33 On one hand, Xie and collaborators reported an overexpression of clathrin and downregulation of Cav1 in PCa samples compared with normal prostatic tissue.30 However, Cav1 and Cav2, two key proteins in caveolae-dependent endocytosis, have been consistently described as overexpressed in CRPC tissues, plasma, and serum samples by different authors, being related with cell motility and migration promotion in CRPC.31–34 Moreover, Cav1 downregulation has been shown to increase sensitivity to AR targeting in PCa cells.33 Our study showed similar results, since we found that LNCaP cells did not express Cav1 and Cav2, contrarily to PC-3 and Du-145. Considering these results, we hypothesized that the lack of caveolins and consequent blockage of the caveolae-dependent endocytosis could be responsible for the failure of uptake of the NPs by the LNCaP cells.
To further confirm this hypothesis, we blocked the caveolae-dependent endocytosis in both PC-3 and Du-145 cells using two different approaches. Genistein is a tyrosine inhibitor that inhibits caveolae-dependent endocytosis both by depolymerizing the local cortical cytoskeleton (which precedes the internalization of caveolar vesicles) and by recruiting dynamin 2 which is needed to split the endocytic vesicle from the cellular membrane.35 In the present study, we incubated cells with genistein previously to the administration of the NPs and we consistently observed a loss of cytotoxic effect, even at higher doses. These results seem to suggest that by blocking endocytosis, we are able to reduce NPs cellular uptake, which translates in loss of cytotoxic effect. Moreover, we inhibited Cav1 and Cav2, alone and in combination, through a siRNA technology, and confirmed the previous results. Interestingly, when Cav1 and Cav2 were concomitantly inhibited, the magnitude of loss of cytotoxic effect is lower than when Cav1 and Cav2 are inhibited alone. We hypothesize this can be due to a limitation of transfection success which can also be observed in the higher RNA levels of Cav1 and Cav2 after combined transfection (Figure S1).
It is important to notice that, genistein is considered not to be a specific inhibitor of the caveolae-dependent endocytosis pathway, since some researchers defend it also inhibits exosome secretion from cells and other endocytic pathways such as macropinocytosis and clathrin-dependent endocytosis.25,36 Moreover, genistein has been proved cytotoxic against PCa, both in vitro and in vivo.37,38 On the other hand, the usage of genetic approaches that change the expression of specific proteins, such as the siRNAs used in this study, have been employed to overcome the non-specificity of chemical inhibitors such as genistein. Some limitations such as the upcoming of compensatory mechanisms in the cell when inhibiting protein expression or the fact that, depending on the required time to silence a gene, the cell may adapt and change gene expression have been reported using this technology.39 Nevertheless, Guggenheim et al have shown the importance of the caveolae-dependent endocytosis in the uptake of Superparamagnetic Iron Oxide Nanoparticles through cav1 inhibition.40 Similarly, Sago et al used an in vivo Cav1 knockout mouse model to show that lipid NPs bio-distribution was affected by Cav1 in a cell type specific manner.41 It has been shown that both cav1 and cav2 are needed for formation of deep plasma membrane-attached caveolae, since the current model of caveolae biogenesis reports caveolae formation at the Golgi complex through binding of previously formed hetero-oligomeric complex formed by cav1 and cav2 to cholesterol.42 Indeed, in the results of the present study, we can see that inhibition of only cav1 or cav2 are sufficient to inhibit the cytotoxic effect of NPs. All in all, in the present study, we observed a loss of cytotoxic effect of both AgNPs and G-AgNPs by the two methods, strengthening the hypothesis of caveolae-dependent endocytosis as the mechanism of uptake of these NPs.
Besides, we induced Cav1 and Cav2 expression in LNCaP cells which previously had no expression of both proteins. After induction, the NPs were shown cytotoxic to these cells. Moreover, TEM analysis of LNCaP expressing Cav1 and Cav2 shows NPs both entering the cell and located inside the cell, namely in the nucleus, mitochondria and cytoplasm. All in all, this data confirmed the hypothesis that the uptake of the NPs in PCa cells was performed through caveolae-dependent endocytosis.
AgNPs and G-AgNPs were proven, in the present study, to enter PCa cells through caveolae-dependent endocytosis, which is a crucial factor for their cytotoxic power. In fact, the pathway by which NPs enter cells depends on different factors such as particle size, shape and surface coating.43 Although the caveolae-dependent endocytosis’ mechanism is not yet completely understood, studies report that the size of the vesicle involved is about 60–80 nm and that anionic NPs are more likely to use this pathway.44 Indeed, the NPs of the present study have an average size of circa 60 nm and a negative surface charge, which reinforces these data.21
Nevertheless, it is important to notice that the differences in the cytotoxic effect of G-AgNPs were of a smaller magnitude compared with AgNPs. G-AgNPs result of a functionalization of glucosamine with AgNPs, so we hypothesize that GLUT1 facilitates the uptake of these NPs in the cells. Since we were not able to completely shut down the caveolae-dependent pathway, the high levels of GLUT1 in Du-145 and PC-3 cells were able to ease the uptake of G-AgNPs. Interestingly, Komuro and collaborators have previously demonstrated something similar regarding the uptake of hydroxyapatite NPs modified with glucose. Through genistein inhibition, they showed that the uptake of these NPs was significantly inhibited and, when inhibiting GLUT1, there was also a significant inhibition of the NPs uptake. This suggested that the NPs were taken up through the caveolae-mediated endocytosis process with an involvement of GLUT1 in the internalization process.45 Nonetheless, these results may also point to an advantage of glucose functionalization in these NPs design. Since their uptake seems to depend on both caveolae-dependent endocytosis and on GLUT1, modulation of these pathways in the context of tumor evolution may be more easily surpassed by G-AgNPs.
Conclusion
In this study, we successfully proved that AgNPs enter PCa cells through caveolae-dependent endocytosis. Moreover, we uncovered the reason behind the selective effect of the AgNPs towards CRPC cells since the lack of expression of Cav1 and Cav2 in LNCaP cells was shown to be the main responsible for the absence of cytotoxic effect of the NPs in this cell line. In the future, transfection of Cav1 and Cav2 plasmids in PC-3 and Du-145 as well as higher NPs concentrations could also be tested, to see if the cytotoxic effect is augmented. Additionally, different transfection efficiencies could be tested to obtain a range of cav1 and cav2 inhibition. Differences in viability of cells after NPs administration can provide information regarding the possibility of a quantitative relationship between inhibition and NPs dose needed to elicit meaningful killing. These assays can reinforce the present results. Moreover, the role of GLUT-1 in the G-AgNPs entry in cells should be further clarified, through inhibition of this molecule in concomitance with both caveolins or with fluorescent marking of G-AgNPs to better explore its uptake pathway. Moreover, in vivo studies can help confirm the role of caveolae-dependent endocytosis in the uptake of these NPs preferable by CRPC tissues. Given the current landscape in PCa treatment, this study reinforces, not only, the potential of these AGNPs as a new therapeutic approach directed to CRPC patients, but it is also an opportunity to better understand key features, such as the deregulation of Cav1 and Cav2 expression, that distinguish hormone sensitive and resistant PCa cells and may be responsible for drug resistance, opening the doors for the definition of new therapeutic agents.
Abbreviations
ADT, Androgen Deprivation Therapy; AgNPs, Silver Nanoparticles; AR, Androgen Receptor; ATCC, American Type Culture Collection; BSA, Bovine Serum Albumin; Cav, Caveolin; cDNA, complementary DNA; CRPC, Castration Resistant Prostate Cancer; Ct, threshold cycle; DC, Detergent compatible; DNA, Deoxyribonucleic acid; DPPC, Dipalmitoyl-phosphatidyl choline; Dyn2, Dynamin 2; EDTA, Ethylenediamine tetra acetic acid; EPR, Enhanced Permeability and Retention; FBS, Fetal bovine serum FDR, False Discovery Rate; G-AgNPs, glucose functionalized silver nanoparticles; GLUT1, Glucose transporter 1; KEGG, Kyoto Encyclopedia of Genes and Genomes; miRNA, microRNA; mRNA, messenger RNA; NPs, nanoparticles; PCa, Prostate Cancer; PPI, Protein-protein interaction; RIPA, Radioimmunoprecipitation Assay; RNA, Ribonucleic acid; rpm, rotations per minute; RPMI, Roswell Pearl Memorial Institute; siRNA, small interfering RNA; STRINGapp, Search Tool for the Retrieval of Interacting Genes; TBS-T, Tris-buffered saline with Tween; TEM, Transmission Electron Microscopy; TGX, Tris-Glycine extended; TRITC, Tetramethylrhodamine; 3´UTR - 3’ Untranslated Region.
Funding
This work is part of the project “P.CCC: Centro Compreensivo de Cancro do Porto” - NORTE-01-0145-FEDER-072678, supported by Norte Portugal Regional Operational Programme (NORTE 2020), under the PORTUGAL 2020 Partnership Agreement, through the European Regional Development Fund (ERDF). MM is funded by FCT through the grant 2020.08193.BD and FD is funded by UIDP/00776/2020-4B.
Disclosure
The authors report no conflicts of interest in this work.
References
1. Rezayatmand H, Razmkhah M, Razeghian-Jahromi I. Drug resistance in cancer therapy: the Pandora’s Box of cancer stem cells. Stem Cell Res Ther. 2022;13(1):181. doi:10.1186/s13287-022-02856-6
2. Parker C, Castro E, Fizazi K, et al. Prostate cancer: ESMO Clinical Practice Guidelines for diagnosis, treatment and follow-up. Ann Oncol. 2020;31(9):1119–1134. doi:10.1016/j.annonc.2020.06.011
3. Gandhi J, Afridi A, Vatsia S, et al. The molecular biology of prostate cancer: current understanding and clinical implications. Prostate Cancer Prostatic Dis. 2018;21(1):22–36. doi:10.1038/s41391-017-0023-8
4. Crowley F, Sterpi M, Buckley C, Margetich L, Handa S, Dovey Z. A review of the pathophysiological mechanisms underlying castration-resistant prostate cancer. Res Rep Urol. 2021;13:457–472. doi:10.2147/rru.S264722
5. Dong L, Zieren RC, Xue W, de Reijke TM, Pienta KJ. Metastatic prostate cancer remains incurable, why? Asian J Urol. 2019;6(1):26–41. doi:10.1016/j.ajur.2018.11.005
6. Zhou SF, Zhong WZ. Drug design and discovery: principles and applications. Molecules. 2017;22(2):279. doi:10.3390/molecules22020279
7. Lei ZN, Tian Q, Teng QX, et al. Understanding and targeting resistance mechanisms in cancer. MedComm. 2023;4(3):e265. doi:10.1002/mco2.265
8. Zalba S, Ten Hagen TL. Cell membrane modulation as adjuvant in cancer therapy. Cancer Treat Rev. 2017;52:48–57. doi:10.1016/j.ctrv.2016.10.008
9. Alsinnawi M, Zhang A, Bianchi-Frias D, et al. Association of prostate cancer SLCO gene expression with Gleason grade and alterations following androgen deprivation therapy. Prostate Cancer Prostatic Dis. 2019;22(4):560–568. doi:10.1038/s41391-019-0141-6
10. Shi J, Kantoff PW, Wooster R, Farokhzad OC. Cancer nanomedicine: progress, challenges and opportunities. Nat Rev Cancer. 2017;17(1):20–37. doi:10.1038/nrc.2016.108
11. Morais M, Teixeira AL, Dias F, Machado V, Medeiros R, Prior JAV. Cytotoxic effect of silver nanoparticles synthesized by green methods in cancer. J Med Chem. 2020;63(23):14308–14335. doi:10.1021/acs.jmedchem.0c01055
12. Wang X, Qiu Y, Wang M, et al. Endocytosis and organelle targeting of nanomedicines in cancer therapy. Int J Nanomed. 2020;15:9447–9467. doi:10.2147/ijn.S274289
13. Fang J, Islam W, Maeda H. Exploiting the dynamics of the EPR effect and strategies to improve the therapeutic effects of nanomedicines by using EPR effect enhancers. Adv Drug Deliv Rev. 2020;157:142–160. doi:10.1016/j.addr.2020.06.005
14. Ju Y, Guo H, Edman M, Hamm-Alvarez SF. Application of advances in endocytosis and membrane trafficking to drug delivery. Adv. Drug Delivery Rev. 2020;157:118–141. doi:10.1016/j.addr.2020.07.026
15. Manzanares D, Ceña V. Endocytosis: the nanoparticle and submicron nanocompounds gateway into the cell. Pharmaceutics. 2020;12(4):371. doi:10.3390/pharmaceutics12040371
16. Bonaccorsi L, Nosi D, Muratori M, Formigli L, Forti G, Baldi E. Altered endocytosis of epidermal growth factor receptor in androgen receptor positive prostate cancer cell lines. J Mol Endocrinol. 2007;38(1–2):51–66. doi:10.1677/jme.1.02155
17. Prescott JL, Tindall DJ. Clathrin gene expression is androgen regulated in the prostate. Endocrinology. 1998;139(4):2111–2119. doi:10.1210/endo.139.4.5926
18. Chen P, Zhang YL, Xue B, Xu GY. Association of caveolin-1 expression with prostate cancer: a systematic review and meta-analysis. Front Oncol. 2020;10:562774. doi:10.3389/fonc.2020.562774
19. Freeman MR, Yang W, Di Vizio D. Caveolin-1 and prostate cancer progression. Adv Exp Med Biol. 2012;729:95–110. doi:10.1007/978-1-4614-1222-9_7
20. Nassar ZD, Parat MO. Caveola-forming proteins and prostate cancer. Cancer Metastasis Rev. 2020;39(2):415–433. doi:10.1007/s10555-020-09874-x
21. Morais M, Machado V, Dias F, et al. Glucose-functionalized silver nanoparticles as a potential new therapy agent targeting hormone-resistant prostate cancer cells. Int J Nanomed. 2022;17:4321–4337. doi:10.2147/ijn.S364862
22. Macfarlane LA, Murphy PR. MicroRNA: biogenesis, function and role in cancer. Curr Genomics. 2010;11(7):537–561. doi:10.2174/138920210793175895
23. Lu J, Clark AG. Impact of microRNA regulation on variation in human gene expression. Genome Res. 2012;22(7):1243–1254. doi:10.1101/gr.132514.111
24. Huang HY, Lin YC, Cui S, et al. miRTarBase update 2022: an informative resource for experimentally validated miRNA-target interactions. Nucleic Acids Res. 2022;50(D1):D222–d230. doi:10.1093/nar/gkab1079
25. Hayatudin R, Fong Z, Ming LC, Goh B-H, Lee W-L, Kifli N. Overcoming chemoresistance via extracellular vesicle inhibition. Review. Front Mol Biosci. 2021;8. doi:10.3389/fmolb.2021.629874
26. Foroozandeh P, Aziz AA. Insight into cellular uptake and intracellular trafficking of nanoparticles. Nanoscale Res Lett. 2018;13(1):339. doi:10.1186/s11671-018-2728-6
27. Yusuf A, Casey A. Liposomal encapsulation of silver nanoparticles (AgNP) improved nanoparticle uptake and induced redox imbalance to activate caspase-dependent apoptosis. Apoptosis. 2020;25(1–2):120–134. doi:10.1007/s10495-019-01584-2
28. Johnson IR, Parkinson-Lawrence EJ, Shandala T, Weigert R, Butler LM, Brooks DA. Altered endosome biogenesis in prostate cancer has biomarker potential. Mol Cancer Res. 2014;12(12):1851–1862. doi:10.1158/1541-7786.Mcr-14-0074
29. Xu B, Teng LH, Silva SD, et al. The significance of dynamin 2 expression for prostate cancer progression, prognostication, and therapeutic targeting. Cancer Med. 2014;3(1):14–24. doi:10.1002/cam4.168
30. Xie B, Zuhair H, Henrique R, et al. Opposite changes in the expression of clathrin and caveolin-1 in normal and cancerous human prostate tissue: putative clathrin-mediated recycling of EGFR. Histochem Cell Biol. 2023;159(6):489–500. doi:10.1007/s00418-023-02183-8
31. Sugie S, Mukai S, Tsukino H, et al. Increased plasma caveolin-1 levels are associated with progression of prostate cancer among Japanese men. Anticancer Res. 2013;33(5):1893–1897.
32. Kamibeppu T, Yamasaki K, Nakahara K, et al. Caveolin-1 and −2 regulate cell motility in castration-resistant prostate cancer. Res Rep Urol. 2018;10:135–144. doi:10.2147/rru.S173377
33. Gao Y, Li L, Li T, et al. Simvastatin delays castration‑resistant prostate cancer metastasis and androgen receptor antagonist resistance by regulating the expression of caveolin-1. Int J Oncol. 2019;54(6):2054–2068. doi:10.3892/ijo.2019.4774
34. Sugie S, Mukai S, Yamasaki K, Kamibeppu T, Tsukino H, Kamoto T. Significant association of caveolin-1 and caveolin-2 with prostate cancer progression. Cancer Genomics Proteomics. 2015;12(6):391–396.
35. Chang -C-C, Wu M, Yuan F. Role of specific endocytic pathways in electrotransfection of cells. Mol Ther Methods Clin Dev. 2014;1. doi:10.1038/mtm.2014.58
36. Sandvig K, Kavaliauskiene S, Skotland T. Clathrin-independent endocytosis: an increasing degree of complexity. Histochem Cell Biol. 2018;150(2):107–118. doi:10.1007/s00418-018-1678-5
37. Yu X, Yan J, Li Y, et al. Inhibition of castration-resistant prostate cancer growth by genistein through suppression of AKR1C3. Food and Nutrition Research. 2023;67. doi:10.29219/fnr.v67.9024.
38. Khamesi SM, Salehi Barough M, Zargan J, et al. Evaluation of anticancer and cytotoxic effects of genistein on PC3 Prostate Cell line under three-dimensional culture medium. Iran Biomed J. 2022;26(5):380–388. doi:10.52547/ibj.3711
39. Sousa de Almeida M, Susnik E, Drasler B, Taladriz-Blanco P, Petri-Fink A, Rothen-Rutishauser B. Understanding nanoparticle endocytosis to improve targeting strategies in nanomedicine. 10.1039/D0CS01127D. Chem. Soc. Rev. 2021;50(9):5397–5434. doi:10.1039/D0CS01127D
40. Guggenheim EJ, Rappoport JZ, Lynch I. Mechanisms for cellular uptake of nanosized clinical MRI contrast agents. Nanotoxicology. 2020;14(4):504–532. doi:10.1080/17435390.2019.1698779
41. Sago CD, Lokugamage MP, Lando GN, et al. modifying a commonly expressed endocytic receptor retargets nanoparticles in vivo. Nano Lett. 2018;18(12):7590–7600. doi:10.1021/acs.nanolett.8b03149
42. Kiss AL, Botos E. Endocytosis via caveolae: alternative pathway with distinct cellular compartments to avoid lysosomal degradation? J Cell Mol Med. 2009;13(7):1228–1237. doi:10.1111/j.1582-4934.2009.00754.x
43. Liu N, Tang M. Toxic effects and involved molecular pathways of nanoparticles on cells and subcellular organelles. J Appl Toxicol. 2020;40(1):16–36. doi:10.1002/jat.3817
44. Kou L, Sun J, Zhai Y, He Z. The endocytosis and intracellular fate of nanomedicines: implication for rational design. Asian J. Pharm. Sci. 2013;8(1):1–10. doi:10.1016/j.ajps.2013.07.001
45. Komuro H, Sasano T, Horiuchi N, Yamashita K, Nagai A. The effect of glucose modification of hydroxyapatite nanoparticles on gene delivery. J Biomed Mater Res Part A. 2019;107(1):61–66. doi:10.1002/jbm.a.36523
 © 2024 The Author(s). This work is published and licensed by Dove Medical Press Limited. The
full terms of this license are available at https://www.dovepress.com/terms.php
and incorporate the Creative Commons Attribution
- Non Commercial (unported, 3.0) License.
By accessing the work you hereby accept the Terms. Non-commercial uses of the work are permitted
without any further permission from Dove Medical Press Limited, provided the work is properly
attributed. For permission for commercial use of this work, please see paragraphs 4.2 and 5 of our Terms.
© 2024 The Author(s). This work is published and licensed by Dove Medical Press Limited. The
full terms of this license are available at https://www.dovepress.com/terms.php
and incorporate the Creative Commons Attribution
- Non Commercial (unported, 3.0) License.
By accessing the work you hereby accept the Terms. Non-commercial uses of the work are permitted
without any further permission from Dove Medical Press Limited, provided the work is properly
attributed. For permission for commercial use of this work, please see paragraphs 4.2 and 5 of our Terms.