")
Back to Journals » Drug Design, Development and Therapy » Volume 19
Simultaneous Determination of Unbound Plasma Concentration of Methotrexate and 7-Hydroxymethotrexate in Children Patients Receiving High-Dose Methotrexate Therapy
Authors Dong WC , Gao SS, Shi B , Li HR, Jiang Y , Guo JL , Zhang ZQ, Zhang YZ
Received 20 January 2025
Accepted for publication 15 May 2025
Published 26 May 2025 Volume 2025:19 Pages 4383—4396
DOI https://doi.org/10.2147/DDDT.S516431
Checked for plagiarism Yes
Review by Single anonymous peer review
Peer reviewer comments 3
Editor who approved publication: Professor Manfred Ogris
Wei-Chong Dong,1,2 Shuai-Shuai Gao,1 Bo Shi,3 Hao-Ran Li,1 Ye Jiang,4,5 Jia-Liang Guo,3 Zhi-Qing Zhang,1 Ying-Ze Zhang2,3
1Department of Pharmacy, The Second Hospital of Hebei Medical University, Shijiazhuang, Hebei Province, 050051, People’s Republic of China; 2The School of Medicine, Nankai University, Tianjin, 300071, People’s Republic of China; 3Department of Orthopaedics, Hebei Medical University Third Hospital, Shijiazhuang, Hebei Province, 050000, People’s Republic of China; 4School of Pharmacy, Hebei Medical University, Shijiazhuang, Hebei Province, 050017, People’s Republic of China; 5Hebei Key Laboratory of Forensic Medicine, Shijiazhuang, Hebei Province, 050017, People’s Republic of China
Correspondence: Ying-Ze Zhang, Hebei Medical University Third Hospital, 139# Ziqiang Road, Shijiazhuang, Hebei Province, 050000, People’s Republic of China, Email [email protected] Zhi-Qing Zhang, The Second Hospital of Hebei Medical University, 215# Heping West Road, Shijiazhuang, Hebei Province, 050051, People’s Republic of China, Email [email protected]
Background: High-dose methotrexate (HD-MTX) is seen as an effective therapy for acute lymphoblastic leukemia (ALL); however, it is extremely toxic. Monitoring the plasma concentrations of methotrexate (MTX) and its important metabolite, 7-hydroxy-methotrexate (7-OH-MTX), on a routine basis aids in dose modification of rescue medications and in avoiding toxicity. The pharmacologically active and toxic effects of drugs are due to the unbound portion, as most drugs are bound to plasma proteins to some degree. However, the simultaneous measurement of unbound plasma concentrations of MTX and 7-OH-MTX has not been reported.
Methods: We developed and validated a hollow fiber centrifugal ultrafiltration (HFCF-UF) technology to simultaneously analyze unbound MTX and 7-OH-MTX concentrations in human plasma. In total, 234 plasma samples from 58 children diagnosed with ALL who were administered HD-MTX were used in our study. We investigated the connection between unbound and total plasma concentrations of MTX and 7-OH-MTX, as well as how these concentrations relate to liver and renal function.
Results: The method that was developed is both simple and accurate. A weak linear relationship was observed between the concentrations of unbound and total 7-OH-MTX (r2 = 0.732). The concentration of total MTX and unbound 7-OH-MTX were both positively correlated with creatinine (Cr) levels and negatively correlated with Creatinine clearance (CCr). There was a wide variation in the concentration ratios of 7-OH-MTX to MTX, both total and unbound, and these ratios were significantly lower in individuals with impaired liver function.
Conclusion: The total concentration of 7-OH-MTX is an unreliable predictor of unbound concentration, necessitating the monitoring of unbound levels. The concentration ratios of 7-OH-MTX to MTX (both total and unbound) could be more accurate and sensitive biomarkers for predicting hepatotoxicity.
Keywords: methotrexate, 7-hydroxy-methotrexate, unbound concentration, HFCF-UF, hepatotoxicity, nephrotoxicity
Graphical Abstract:

Introduction
Acute lymphoblastic leukemia (ALL) is a typical neoplasm found in children, with an incidence rate of 0.004% in those under 15, comprising about 35% of pediatric cancer cases.1 Methotrexate (MTX) acts as an antimetabolite, impacting folic acid metabolism.2 MTX plays a crucial role in treating ALL and is effective against various cancers.3 High-dose methotrexate (HD-MTX) is characterized by intravenous doses of 500 mg/m2 or higher.4 HD-MTX is advised as a standard chemotherapy strategy for ALL in clinical practice because it can substantially raise blood drug levels and penetrate the blood-brain and blood-testes barriers. Although HD-MTX is seen as an effective therapy for ALL, extended exposure can lead to toxic effects on the liver, kidneys, and nervous system.5,6
The crucial MTX metabolite, 7-hydroxy-methotrexate (7-OH-MTX), has been demonstrated in vivo to lower MTX concentrations within cells.7 The pharmacokinetics of MTX may be affected by the accumulated concentration of 7-OH-MTX due to competitive transport across cell membranes,8,9 and its association with nephrotoxicity and hepatotoxicity has been documented.10 Plasma concentrations of MTX and 7-OH-MTX are strongly linked to toxicities in patients undergoing HD-MTX therapy. Monitoring the plasma concentrations of MTX and 7-OH-MTX routinely aids in adjusting rescue drug doses and preventing toxicity in therapeutic drug monitoring (TDM).11
Numerous assays have been developed for MTX monitoring,12,13 with some specifically targeting 7-OH-MTX,14,15 while others facilitate the simultaneous measurement of plasma MTX and 7-OH-MTX in patients undergoing HD-MTX therapy to optimize rescue drug dosages and minimize adverse reactions.7,11,13,16 Nonetheless, these approaches predominantly rely on total plasma concentration assessments. It is well-established that drug molecules bind to plasma proteins to varying extents in vivo, with only the unbound drug capable of reaching the site of action, exerting pharmacological effects, and being linked to toxicity.17 Therefore, measuring unbound plasma drug concentration is often preferred over the total concentration in TDM.18 Unfortunately, according to our best knowledge, the simultaneous determination of unbound plasma concentration of MTX and 7-OH-MTX has not been reported.
In our previous work,19 we devised a method to measure unbound MTX and examined its relationship with total MTX plasma concentrations, alongside the correlation between MTX concentrations (both unbound and total) and nephrotoxicity in children. The previous study was unable to measure unbound 7-OH-MTX plasma concentration, preventing the analysis of its relationship with total 7-OH-MTX plasma concentration. 7-OH-MTX may affect the pharmacokinetics and pharmacodynamics of MTX20 and contribute to renal toxicity due to its low water solubility.12,16 Elevated plasma levels of 7-OH-MTX have been observed in patients with impaired liver function undergoing HD-MTX therapy;11 however, the underlying mechanism remains unclear and requires further investigation. The absence of reports on the correlation between MTX toxicity and unbound 7-OH-MTX plasma concentrations may stem from the lack of a suitable determination method.
This study introduces a hollow fiber centrifugal ultrafiltration (HFCF-UF) technology combined with high-performance liquid chromatography tandem mass spectrometry (HPLC-MS/MS) to measure unbound MTX and 7-OH-MTX levels in human plasma simultaneously. The method was effectively applied to 234 plasma samples from 58 children with ALL undergoing HD-MTX therapy. The study also analyzed the correlation between unbound and total plasma concentrations of MTX and 7-OH-MTX, as well as their association with liver and renal function.
Experimental
Chemicals and Materials
The MTX standard (No.100138–201606) was obtained from the National Institutes for Food and Drug Control in Beijing, China. The 7-OH-MTX standard (No. JS258662) and internal standard (IS) Methotrexate-D3 (MTX-D3, No. N25IB233480) were obtained from YuanYe Biotechnology Co., Ltd. (Shanghai, China). Human plasma samples were sourced from the Second Hospital of Hebei Medical University. The acetonitrile used, which was of HPLC-grade, was sourced from Fisher Chemicals (Lake Forest, CA, USA). Isopropyl alcohol of HPLC grade was sourced from Yongda Chemical Co., Ltd. in Tianjin, China. HPLC grade formic acid was obtained from Aladdin Biochemical Technology Co. Ltd. in Shanghai, China.
The HFCF-UF device was sourced from the Hebei Heping Medical Equipment Factory in Shijiazhuang, China. The molecular cut-off was 10 kDa. The fiber had a wall thickness of 150 μm and an inner diameter of 1000 μm. Glass tubes with a height of 7 cm and an inner diameter of 4.5 mm. Amicon® ultra-0.5 filter ultrafiltration devices (0.5 mL, 10 kDa, UFC 501096) were obtained from Merck Millipore Corp (Darmstadt, Germany).
Apparatus and Instruments
Chromatographic analysis was conducted using a Shimadzu LC-20AD high-performance liquid chromatography system paired with an API 4000+ triple quadrupole mass spectrometer (AB SCIEX, Los Angeles, CA, USA). Data collection and analysis were performed using Analyst® software version 1.6.
HPLC-MS/MS Conditions
The Chromatographic separation was achieved using a System C18 column (Waters, 4.6 × 150 mm, 3.5 μm), thermostated at 40°C. The mobile phase used a gradient elution with solvent A as 0.1% formic acid in water and solvent B as acetonitrile with 10% isopropyl alcohol. Phase B started at 5% for 0.5 minutes, then increased linearly to 20% over 1 minute, followed by a rise to 100% over 2.5 minutes, and maintained at 100% for 1.5 minutes. Phase B was reduced to initial conditions within 1 minute and held at 5% for 1.5 minutes prior to the subsequent injection. The experiment lasted 8 minutes with a flow rate of 0.8 mL·min−1. A 10 μL injection volume was utilized.
An electrospray ionization source in positive ion mode (ESI+) was used to identify the compounds. The mass spectrometer was configured with an ion spray voltage of 5500 V, a temperature of 600°C, source gases 1 at 55 psi and source gases 2 at 60 psi, a curtain gas at 30 psi, and a collision gas at 8 psi. Multiple reaction monitoring (MRM) was used to conduct mass spectrometry. Mass spectrometry identified the MTX precursor ion at 455.3 m/z and the product ion at 308.2 m/z for quantitation. The precursor ion of 7-OH-MTX was identified for quantitation at 471.1 m/z, with the corresponding product ion detected at 324.3 m/z. The MTX-D3 (IS) exhibited a precursor ion at 458.4 m/z and a product ion at 311.3 m/z for quantitation. The qualitative ion pair was m/z 455.3→175.1 for MTX, m/z 471.1→191.3 for 7-OH-MTX, and m/z 458.4→175.4 for MTX-D3 (IS). The capillary voltage was all set at 110 V, with collision energies of 27 V for MTX, 15 V for 7-OH-MTX, and 27 V for MTX-D3.
Standard Solution and Quality Control Sample
Stock solutions of MTX and MTX-D3 were individually prepared in methanol (containing 10 mm NaOH solution) at concentration of 0.5 mmol·L–1 and 1 mmol·L–1 respectively, and stored at −40°C. 7-OH-MTX stock solution at a concentration of 1 mmol·L−1 was prepared in deionized water containing 10 mm NaOH and stored at –40°C. A mixed solution was prepared by combining the appropriate volumes of individual stock solutions to achieve concentrations of 50 μmol·L−1 MTX and 500 μmol·L−1 7-OH-MTX in deionized water, and stored at 4°C. The mixed working solutions were diluted with deionized water to achieve final concentrations of 20, 10, 5, 2, 1, 0.5, 0.2, 0.1, 0.05, and 0.02 μmol·L–1 for MTX, and 200, 100, 50, 20, 10, 5, 2, 1, 0.5, and 0.2 μmol·L–1 for 7-OH-MTX. Deionized water was used to dilute the internal standard stock solution, resulting in internal working solutions of 2 μmol·L−1 and 0.02 μmol·L−1 MTX-D3.
Calibration standards for unbound concentration analysis were prepared by spiking 475 μL of blank human plasma ultrafiltrate with 25 μL of mixed working solutions. The concentrations for MTX were 0.5, 0.25, 0.1, 0.05, 0.025, 0.01, 0.005, 0.0025, and 0.001 μmol·L–1, and for 7-OH-MTX, they were 5, 2.5, 1, 0.5, 0.25, 0.1, 0.05, 0.025, and 0.01 μmol·L−1. Quality control (QC) samples for unbound concentration analysis were prepared at 0.002, 0.04, and 0.4 μmol·L–1 for MTX, and at 0.02, 0.4, and 4 μmol·L–1 for 7-OH-MTX.
Calibration standards for total concentration analysis were prepared by spiking 90 μL of blank human plasma with 10 μL of mixed working solutions at concentrations of 2, 1, 0.5, 0.2, 0.1, 0.05, 0.02, 0.01, and 0.005 μmol·L–1 for MTX, and 20, 10, 5, 2, 1, 0.5, 0.2, 0.1, and 0.05 μmol·L–1 for 7-OH-MTX.
Preparation of Samples for Unbound Concentration Analysis Using HFCF-UF
The principle of HFCF-UF technology is to achieve a physical interception through the molecular weight cut-off of the filtration membrane under the centrifugation. The aqueous component of plasma containing the small unbound drug molecules could pass through the ultrafiltration membrane freely with the advantage of the direction of centrifugal force parallel to the membrane. The concentration of drug in ultrafiltrate is the unbound drug concentration in plasma.19
The plasma sample, measuring roughly 500 μL, was put into a narrow glass tube. To form a U-shape, the 15 cm hollow fiber was bent and then inserted into a narrow glass tube. Following 5 minutes of ultrafiltration at 2.4 × 10³ g, the ultrafiltrate within the hollow fiber’s lumen was expelled from the opposite end using a syringe. A 30 μL ultrafiltrate was combined with 30 μL of an internal working solution (0.02 μmol·L–1 MTX-D3), and for analysis, an injection of 10 μL from this mixture was made into the HPLC-MS/MS system. (see Figure 1).
 |
Figure 1 Hollow fiber centrifugal ultrafiltration (HFCF-UF) process. |
Preparation of Samples for Total Concentration Analysis
A 1.5-mL centrifuge tube was prepared with 100 μL of plasma sample and 10 μL of internal standard (2 μmol·L–1 MTX-D3). Next, 300 μL of acetonitrile was added. The mixture was vortexed for 2 minutes and then centrifuged at 1.0 × 10⁴ g for 5 minutes. A 40 μL aliquot of the supernatant was placed into a clean centrifuge tube, followed by the addition of 160 μL of deionized water. A 10 μL aliquot of the mixture, following 1 minute of vortexing, was used for HPLC-MS/MS analysis.
Sample Preparation with Traditional Ultrafiltration
The sample (500 μL) underwent ultrafiltration with an Amicon® ultra-0.5 filter device. Following the centrifugation at 8,000 g for 10 minutes, 30 μL of ultrafiltrate was combined with an equal volume of internal standard solution (0.02 μmol·L−1 MTX-D3). The mixture was analyzed by injecting a 10 μL aliquot into the HPLC-MS/MS system.
Results
Non-Specific Binding
When applying ultrafiltration, it is crucial to first quantify the nonspecific binding (NSB) of drugs to filter membranes or devices made of glass and plastic, as this is a major drawback of the procedure.21 The study examined the adsorption properties of three types of hollow fiber materials: polyacrylonitrile (PAN), polyvinyl chloride (PVC) and polysulfone (PSF).
Traditional ultrafiltration using Centrifree® YM-30 and Amicon® ultra-0.5 filter devices, both utilizing regenerated cellulose (RC) membranes, is a common method for assessing plasma unbound concentration.22 This study also examines the NSB of RC with the commercially available Amicon® ultra-0.5 filter device. Ultrafiltration was performed as described in Section 2.7.
Figure 2 illustrates the ratios of obtained concentrations via ultrafiltration to their respective standard ultrafiltrate concentrations across low, medium, and high QC sample concentrations both for MTX and 7-OH-MTX (n = 5). The findings revealed a notable NSB of MTX and 7-OH-MTX to PSF and PVC materials, with the PSF ratios ranging from 26% to 73% and PVC ratios below 30%. Although the ratio of RC can reach 94% for low-concentration MTX, it is only 87.5% for medium-concentration MTX, and less than 80% for 7-OH-MTX. Traditional RC ultrafiltration devices failed to control the ultrafiltrate volume accurately, leading to significant deviations as noted in previous studies.23,24 Fortunately, the concentrations ratios of the obtained concentrations from PAN material fiber to standard ultrafiltrate were consistently around 100% for MTX and 7-OH-MTX, allowing for direct use in further experiments.
 |
Figure 2 The recovery ratios of different ultrafiltration membrane materials, polysulfone (PSF), polyvinyl chloride (PVC), polyacrylonitrile (PAN), and regenerated cellulose (RC) at low, medium, and high concentration of QC samples (n = 5), (A) MTX; (B) 7-OH-MTX. |
Method Validation
Selectivity
We examined the blank plasma ultrafiltrate, QC samples (0.04 μmol·L−1 MTX, 0.4 μmol·L−1 7-OH-MTX, and 0.02 μmol·L−1 MTX-D3 in the ultrafiltrate of blank plasma), and the ultrafiltrate of clinical plasma sample. Figure 3 presents the blank plasma ultrafiltrate along with representative chromatograms of HPLC-MS/MS from the clinical samples. This demonstrates that the proposed method possesses sufficient specificity. The retention times were 4.53 minutes for MTX, 4.83 minutes for 7-OH-MTX, and 4.52 minutes for the internal standard MTX-D3.
 |
Figure 3 Representative HPLC-MS/MS chromatograms of the blank plasma ultrafiltrate (A) and clinical plasma sample ((B)MTX, (C) 7-OH-MTX, (D) MTX-D3). |
Linearity, LLOD, and LLOQ
Linearity was assessed by evaluating the correlation between the concentration of the analyte and the response of the instrument. The lower limit of detection (LLOD) and lower limit of quantification (LLOQ) were determined to establish the smallest concentration of the analyte that can be reliably detected and quantified, respectively.
Calibration curves were constructed by plotting the peak area ratios of the analyte to the internal standard across various concentrations (0.001~0.5 μmol·L–1 for unbound MTX and 0.01~5 μmol·L–1 for unbound 7-OH-MTX) using linear regression with a weighted factor 1/C2. The linear regression equations were YMTX = 67.5C + 0.000381 (r2 = 0.9997) and Y7-OH-MTX = 1.84C – 0.00205 (r2 = 0.9987). The LLOD and LLOQ were evaluated by identifying the minimum analyte concentrations that produced signal-to-noise ratios of at least 3 and 10, respectively. Calibrator back-calculated concentrations must be within ±15% of the nominal value or ±20% of the LLOQ. The LLOD for MTX and 7-OH-MTX were 0.25 nmol·L−1 and 2.5 nmol·L−1, respectively, while the LLOQ values were 0.001 μmol·L−1 for MTX and 0.01 μmol·L−1 for 7-OH-MTX.
Evaluation of Trueness, Precision, and Matrix Effects
Within-run precision and trueness were assessed using five replicates of three QC sample concentrations and the LLOQ in a single run. Precision across three consecutive runs was assessed to evaluate between-run consistency. The within- and between-run RSD values were not surpass 9.6%, and for the LLOQ, the RSD values were below 11%. Back-calculated concentration biases were −7.3% to 8.4% for QC levels and the LLOQ. (as shown in Table 1)
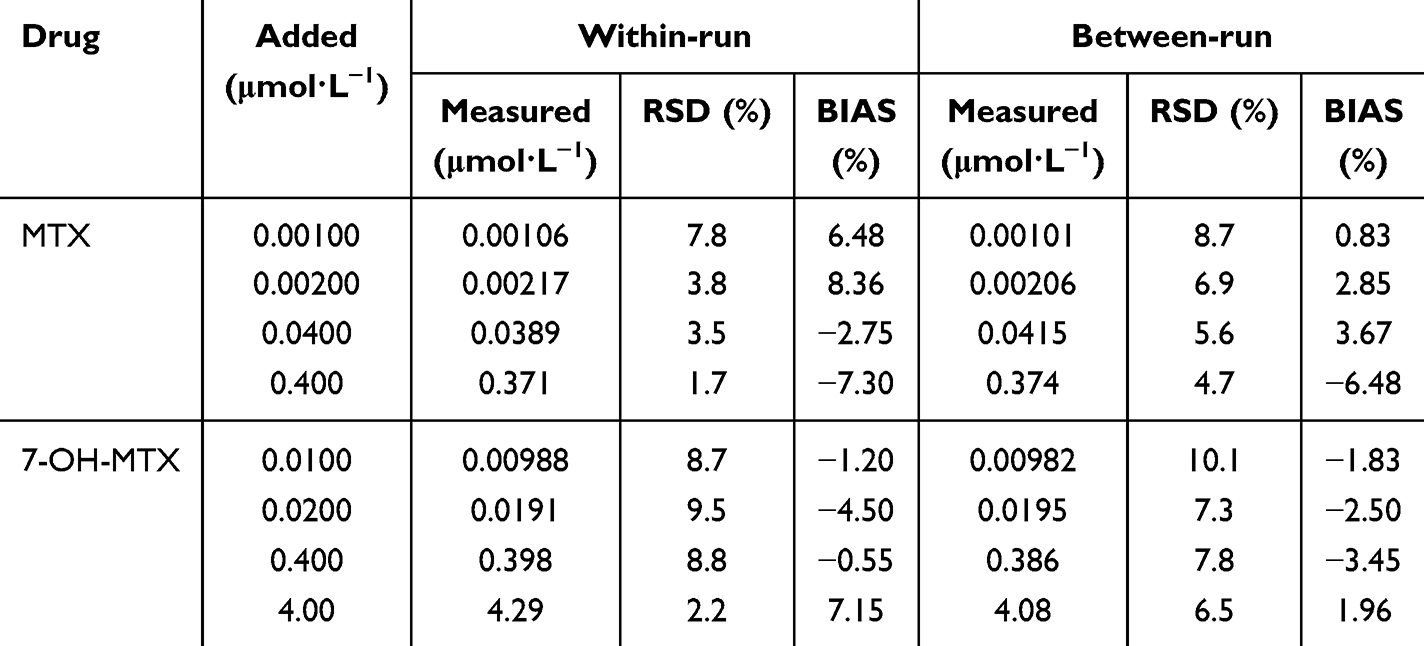 |
Table 1 Results of Trueness and Precision for the Analysis of Unbound MTX and 7-OH-MTX in QC Samples |
The percentage ratio of measured concentrations in three QC samples (n = 5) relative to the spiked concentrations in blank plasma ultrafiltrate was used to calculate extraction recovery. Matrix effects were assessed by comparing the IS-normalized matrix factor, which involved measuring analyte concentrations in plasma ultrafiltrate from six different individuals and standard solution, both normalized with IS, across three QC concentrations. The RSD values obtained for IS-normalized matrix factor were below 11% (see Table 2).
 |
Table 2 Results of Extraction Recovery (n = 5) and Matrix Effects (n = 6) for the Analysis of Unbound MTX and 7-OH-MTX in QC Samples |
Stability
We assessed the stability of MTX and 7-OH-MTX under various conditions, including room temperature, freezing, freeze-thaw cycles, and post processing. QC samples at three concentrations remained stable with bias ranged from −13% to 10.1% under various conditions: at room temperature (26°C) for 12 hours, at –40°C for 30 days, following three freeze-thaw cycles, and in the auto sampler at 15°C for up to 24 hours after processing, as detailed in Supplementary Table 1.
Carry-Over
To assess carryover, a blank water sample was injected following the upper limit of quantification (ULOQ) across six separate runs. In this study, after the analysis of plasma ultrafiltrate at the ULOQ level, there was no peak detected for MTX, 7-OH-MTX and MTX-D3 in a blank water sample. There was no carry-over effect for both analytes and IS.
Dilution Integrity
Dilution integrity was assessed by spiking MTX and 7-OH-MTX in an 8-fold and 32-fold higher concentration than that of the ULOQ in blank plasma ultrafiltrate. Next, samples were diluted 10-fold and 40-fold with blank plasma ultrafiltrate and tested for accuracy and precision (n = 5). The inaccuracy was −4.3% to 9.6% and imprecision RSD less than 9.7%.
Application to Clinical Plasma Samples
The study complies with the Declaration of Helsinki. The Ethics Committee of the Second Hospital of Hebei Medical University approved the study protocol (No. 2024-R095). All the participants’ guardians provided written informed consent before the study began, and if the participants were over 10 years old, the participants themselves also signed the written informed consent. From January 2023 to June 2024, 234 plasma samples were collected from 58 children (23 boys and 27 girls) diagnosed with ALL. All patients were administered HD-MTX at 1–5 g/m2. At our center, the total concentration of MTX is at a high risk of toxic effects and has been conventionally monitored 42 hours post-infusion. Leucovorin (LV) should be used for rescue until the total MTX concentration reaches <0.25 μmol·L–1 at 42 hours. Otherwise, it is necessary to continue LV rescue and determine the MTX plasma concentration at 72 hours, 96 hours, or later. The rescue dosage and frequency depend on the MTX concentration until the total MTX plasma concentration is less than 0.1 μmol·L–1.16,25
In this study, at 42 hours, 72 hours, or later after MTX infusion, about 3 mL blood was collected in a centrifuge tube and a 5 minute centrifugation was conducted at 6.0 × 10³ g and the obtained plasma samples were immediately analyzed or stored at –40°C for testing. Plasma samples were prepared using HFCF-UF to measure unbound MTX and 7-OH-MTX concentrations with 500μL of plasma, while 200 μL was utilized for total concentration analysis . Table 3 presents the characteristics and corresponding concentrations of total 234 clinical plasma samples with all sampling times. Creatinine clearance (CCr) was calculated with Schwartz formula, a calculation of 36.5*(height/serum creatinine), with height measured in cm and serum creatinine (Cr) in μmol·L−1.
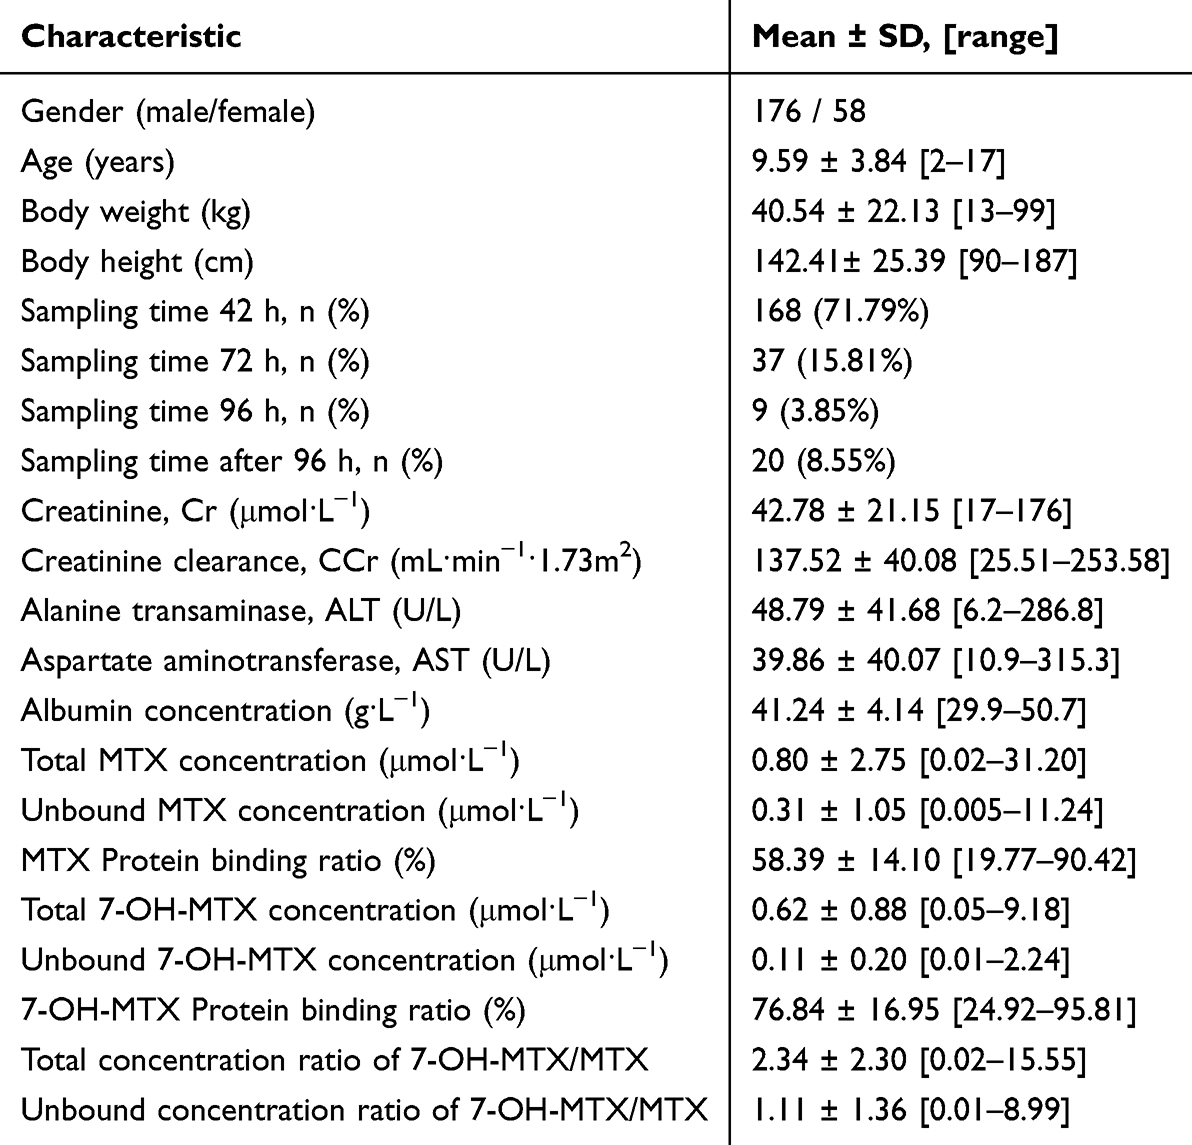 |
Table 3 The Characteristics and Corresponding Concentrations of Total 234 Clinical Plasma Samples with All Sampling Times |
Analysis was conducted using SPSS 26.0 software. We employed a multiple linear regression to find which factors may affect the protein binding rate of MTX and 7-OH-MTX (Supplementary Table 2). The concentration ratios of 7-OH-MTX to MTX for both total and unbound concentrations in 234 clinical plasma samples were shown in Figure 4. We also conducted a regression analysis correlating total and unbound plasma concentrations of MTX and 7-OH-MTX 42 hours post-infusion, as depicted in Figure 5. In order to evaluate the correlation between the plasma concentrations of MTX and 7-OH-MTX with liver and renal function, the Spearman correlation analysis was employed, with data assessments being two-tailed, as presented in Supplementary Table 3. We also compared the plasma levels of MTX and 7-OH-MTX, as well as the concentration ratio of 7-OH-MTX to MTX at 42h in patients with either normal (ALT and AST ≤ 40 U/L) or impaired (ALT and/or AST > 40 U/L) liver function (see result in Figure 6).
 |
Figure 4 The total and unbound concentration ratios of 7-OH-MTX to MTX in 234 clinical plasma samples. |
 |
Figure 5 Relationship between unbound and total concentrations at 42 hours for MTX (A) and 7-OH-MTX (B) in clinical plasma samples; dotted lines show 95% confidence interval. |
 |
Figure 6 The drug plasma level and concentration ratio of 7-OH-MTX to MTX at 42 hours after dosing in patients with normal (alanine transaminase ≤ 40 U/L) or impaired (alanine transaminase > 40 U/L) liver function; (A) MTX, (B) 7-OH-MTX, (C) concentration ratio of 7-OH-MTX to MTX. |
Discussions
Plasma Protein Binding Rates of MTX and 7-OH-MTX
The method was effectively validated in 234 pediatric plasma samples for simultaneous measurement of unbound plasma concentrations of MTX and 7-OH-MTX (see Table 3). The mean protein-binding ratio for MTX was 58.39%, with a range of 19.77% to 90.42%, aligning with existing literature.16,18 While 7-OH-MTX is the primary metabolite of MTX in the liver, its protein-binding ratios remain unreported. The study determined that the mean protein-binding ratio of 7-OH-MTX was 76.84%, with a range spanning from 24.92% to 95.81%. Our findings indicate significant variability in the plasma protein binding rates of MTX and 7-OH-MTX, potentially due to individual differences, concurrent diseases, gene polymorphisms of metabolic enzymes, and drug–drug and drug-diet interactions.
Furthermore, we have performed a multiple linear regression to find which factors may affect the protein binding rate of MTX and 7-OH-MTX, as show in Supplementary Table 2. The factors including gender, age, height, weight, albumin level, CCr, ALT, AST, total and unbound MTX level, total and unbound 7-OH-MTX level. The total and unbound 7-OH-MTX, and albumin level were linear correlation with plasma protein binding rate of MTX with P < 0.05. The plasma protein binding rate of 7-OH-MTX was linear correlation with albumin level (P = 0.043) and CCr (P = 0.011). There maybe also other factors that affect the protein binding rate MTX and 7-OH-MTX including complications, infection, genotype, drug interaction and so on. But, the relevant data is less at present. The present work was only a preliminary study, which needs in-depth study in further.
Concentration Ratios of 7-OH-MTX to MTX
In Figure 4, the total 7-OH-MTX to MTX concentration ratios were changed largely from 0.02 to 15.55 (mean 2.34) in our results. The total MTX to 7-OH-MTX concentration ratios have been reported to vary from 0.01 to 2.4 in children receiving HD-MTX treatment.26 But that study did not discuss the unbound concentration ratios. In the present study, we found a large range (0.01–8.99, mean = 1.11) of unbound 7-OH-MTX to MTX concentration ratios at the first time. The accumulation of 7-OH-MTX may affect MTX pharmacokinetics through competitive membrane transport.7 MTX and 7-OH-MTX concentrations also be affected by other factors, such as liver function, renal function, gene polymorphism, individual differences, drug–drug interaction and so on. Therefore, a wide variation in the concentration ratios of 7-OH-MTX to MTX, both total and unbound was found in our present work. These findings underscore the importance of routinely monitoring MTX and its primary metabolite, 7-OH-MTX, to understand individual variations in drug response.7,11,13,16
Correlation Between Total and Unbound Plasma Concentration
Figure 5 illustrates the regression analysis correlating total and unbound plasma concentrations of MTX and 7-OH-MTX 42 hours post-infusion. A linear relationship (r2 = 0.979) was found between unbound and total plasma MTX concentrations in clinical samples, consistent with our earlier findings.19 Additionally, prior research indicated a weak correlation between these concentrations in 16 clinical samples with total MTX levels exceeding 2 μmol·L−1 at 42 hours, highlighting the importance of monitoring unbound drug concentration for accurate assessment of efficacy and toxicity. However, the correlation between total and unbound plasma 7-OH-MTX concentration remains unreported.
The study found a weak linear correlation (r2 = 0.732) between unbound and total 7-OH-MTX concentrations, suggesting that total concentration is an unreliable predictor of unbound concentration. Because unbound concentration is pharmacologically active and causes toxicity,17 unbound 7-OH-MTX concentration should be monitored.
Relationship Between MTX, 7-OH-MTX Levels and Renal Function
The relationship between plasma MTX concentration and renal function in children is debated.26 Some studies found no correlation between MTX concentration and Cr levels at 24 and 48 hours in children with HD-MTX,27,28 while others observed a positive correlation between serum Cr and MTX levels at these times.29 Additionally, a study reported that 48-hour plasma MTX concentration was positively correlated with serum Cr and negatively with CCr.30 These conflicting findings are based on total MTX plasma concentration. In Supplementary Table 3, our findings indicated a positive correlation between total MTX with Cr levels (P = 0.043), and a negative correlation with CCr (P = 0.045), which in line with literature reported.29,30 Our result also showed a positive correlation between unbound MTX concentration with Cr levels (P = 0.029), but no significant negative correlation with CCr (P = 0.080). Meanwhile, in our previous work,19 we reported that both the free and total MTX concentrations at 42 h were negatively correlated with CCr level (P = 0.023, r = −0.236 for total MTX and P = 0.020, r = −0.241 for free MTX, respectively). These results may be explained by the large individual differences among children, and the renal function of most patients in the study was normal. A deeper and more comprehensive exploration is still needed in our further study.
The association of 7-OH-MTX with nephrotoxicity and hepatotoxicity has been documented,10 yet it shows no correlation with Cr levels.31 7-OH-MTX, the major metabolite of MTX, contributes toward the MTX activity and can precipitate in the renal tubules, causing acute renal insufficiency.32 Recent findings indicate a correlation between 7-OH-MTX and Cr levels in pediatric patients undergoing HD-MTX treatment for ALL, suggesting its potential as a predictive biomarker for delayed MTX elimination.26,32 These conflicting results are based on total concentration, as unbound 7-OH-MTX plasma concentration measurements have not been reported. In our results (see Supplementary Table 3), no significant correlation was observed between total 7-OH-MTX and either Cr or CCr levels, which was consistent with the literature report.31 Meanwhile, we found a positive correlation between unbound 7-OH-MTX and Cr (P = 0.002) and a negative correlation between unbound 7-OH-MTX and CCr (P = 0.010). Since only the unbound drug can reach the site of action exerting pharmacological effects and being linked to toxicity.17 We also found a weak linear correlation between unbound and total 7-OH-MTX concentrations (Figure 5). Therefore, unbound 7-OH-MTX maybe more accurate to predict nephrotoxicity than total concentration. The necessity of monitoring the unbound 7-OH-MTX concentration is proved again.
It has reported MTX, 7-OHMTX, Cr levels, and MTX/7-OHMTX ratio were all significantly higher among patients with MTX delayed elimination at 48 hours.26 But, there was no discussion about the correlation between Cr or CCr level and MTX/7-OHMTX ratio. In our present work, we found that the concentration ratios of 7-OH-MTX to MTX, in both total and unbound forms, were not significantly correlated with the Cr and CCr levels (Supplementary Table 3). It maybe explained that MTX metabolism is mainly in the liver and converted into 7-OHMTX by aldehyde oxidase.11 The concentration ratios of 7-OH-MTX to MTX may also or mainly affected by liver function. Therefore, the influence of renal function on 7-OH-MTX to MTX was limited.
Relationship Between MTX, 7-OH-MTX Concentration and Liver Function
MTX is primarily metabolized in the liver, with 30% of the initial dose converted to 7-OH-MTX by aldehyde oxidase.26 A significant correlation exists between alanine aminotransferase (ALT) levels and 7-OH-MTX concentrations (P < 0.001) in osteosarcoma patients undergoing high-dose MTX therapy.31 While 7-OH-MTX predominantly forms and accumulates in the liver, MTX is administered intravenously, and only 10% of the dose is excreted through the biliary tract. Consequently, liver function may substantially impact the plasma concentration of 7-OH-MTX, whereas its effect on MTX plasma levels is minimal.11
As shown in Supplementary Table 3, our results showed a positive correlation between unbound MTX concentration and ALT levels (P = 0.023). There was no significant correlation between total MTX concentration and levels of ALT or aspartate aminotransferase (AST). Total and unbound 7-OH-MTX concentrations were both negatively correlated with AST, and total 7-OH-MTX concentration was also negatively correlated with ALT. The concentration ratios of 7-OH-MTX to MTX, in both total and unbound forms, were significantly negatively correlated with the ALT and AST levels (P < 0.001). This indicated that the concentration ratio of 7-OH-MTX to MTX, in both total and unbound forms, may serve as a more precise and sensitive biomarker for predicting hepatotoxicity.
Furthermore, Figure 6 examines the plasma levels of MTX and 7-OH-MTX, as well as the concentration ratio of 7-OH-MTX to MTX, 42 hours post-dosing in patients with either normal or impaired liver function. It has been reported that patients with impaired liver function exhibit significantly elevated 7-OH-MTX plasma levels compared to those with normal liver function.11 However, data on the unbound concentration and the concentration ratio of 7-OH-MTX to MTX in these patients remain unreported. Our findings indicated elevated plasma levels of MTX and 7-OH-MTX (both total and unbound) in patients with impaired liver function, though the differences were not statistically significant (P > 0.05). Both MTX and 7-OH-MTX could be further metabolized to their polyglutamates.11 In patients with liver impairment, the polyglutamates of MTX and 7-OH-MTX were released into the blood, and then transformed back to MTX and 7-OH-MTX via γ-glutamyl hydrolase in the blood.33 This leads to MTX and 7-OH-MTX levels in liver impairment were elevated as literature reported.11
In Figure 6, in patients with impaired liver function, the concentration ratios of 7-OH-MTX to MTX in both total and unbound forms were significantly lower than in those with normal liver function (P = 0.0023 for total and P = 0.0021 for unbound). MTX metabolite to 7-OH-MTX and diamino-2,4-N-10-methylpteroic acid in liver.34 With the liver impaired, the activity of MTX liver metabolizing enzymes decreases, which leads to the accumulation of MTX concentration, and the increase (or formation) of 7-OH-MTX reduced. So, the ratios of 7-OH-MTX to MTX were significantly lower in individuals with impaired liver function. Again, it was proven that the concentration ratio of 7-OH-MTX to MTX (both total and unbound) had a better correlation with liver function.
Limitations
The primary limitations of our current study included the following:
The association between MTX plasma levels and nephrotoxicity in children is debated.26–30 In this study, among 234 children clinical samples, renal function was normal in most cases, with only 12 samples indicating kidney injury, assessed via Cr and CCr measurements. Our findings indicated a positive correlation between MTX (total and unbound), unbound 7-OH-MTX concentrations with Cr. It also indicated a negative correlation between total MTX, unbound 7-OH-MTX with CCr. Consequently, this study could not comprehensively examine or discuss the correlation between MTX and 7-OH-MTX plasma concentrations and renal function. We need to continue collecting more clinical samples for an in-depth analysis in future studies.
In our study of 234 plasma samples, plasma albumin levels were generally normal, with only 22 samples showing low levels (<35 g/L). This study did not investigate whether hypoalbuminemia could lead to unusually high unbound concentrations of MTX or 7-OH-MTX, despite their known albumin-binding properties.18 Future studies should explore more clinical samples from hypoalbuminemia patients or conduct in vitro tests.
In addition, some cases are complicated by infection, epilepsy, and other central nervous system diseases. Whether these complications affect the changes in unbound concentrations has not been discussed in the present study. Collecting extensive samples is essential for ongoing research.
Fortunately, the analytical method developed in this study is simple and accurate, suitable for simultaneous determination of unbound MTX and 7-OH MTX plasma concentrations in the future research involving numerous samples.
Conclusions
This study presents the development and validation of an HFCF-UF method combined with HPLC-MS/MS for the simultaneous quantification of unbound MTX and 7-OH-MTX in human plasma, ensuring simplicity, accuracy, and precision. The weak linear relationship between unbound and total 7-OH-MTX concentrations indicates that total concentration is an unreliable predictor of unbound concentration, necessitating the monitoring of unbound levels. The concentration ratios of 7-OH-MTX to MTX, in both total and unbound forms, varied widely and could be more accurate and sensitive biomarkers for predicting hepatotoxicity.
Funding
The authors acknowledge the financial assistance from the Natural Science Foundation of Hebei Province (H2024206081, H2024206027) and the Tracking Project of Medical Applicable Technology in Hebei Province in 2024 (GZ2024040). The research was also supported by Major science and technology support plan of Hebei Province (242W7710Z) and 14th Five-Year Clinical Medicine Innovation Research Team of Hebei Medical University (2022LCTD-B27).
Disclosure
The authors report there are no financial interests or personal relationships that might impact the work described in this study.
References
1. Chen SQ JC, Wang ZC, Wang Z, et al. Predicting delayed methotrexate elimination in pediatric acute lymphoblastic leukemia patients: an innovative web-based machine learning tool developed through a multicenter, retrospective analysis. BMC Med Inform Decis Mak. 2023;23(1):148. doi:10.1186/s12911-023-02248-7
2. Bluett J, Riba-Garcia I, Verstappen SMM, et al. Development and validation of a methotrexate adherence assay. Ann Rheum Dis. 2019;78(9):1192–1197. doi:10.1136/annrheumdis-2019-215446
3. Karami F, Ranjbar S, Ghasemi Y, et al. Analytical methodologies for determination of methotrexate and its metabolites in pharmaceutical, biological and environmental samples. J Pharm Anal. 2019;9(6):373–391. doi:10.1016/j
4. De Abreu CC, Pires Rosa PC, Da Costa B, et al. Development and validation of HPLC method to determination of Methotrexate in children oncologic patients. Eur Rev Med Pharmacol Sci. 2015;19(8):1373–1380.
5. Howard SC, McCormick J, Pui CH, et al. Preventing and managing toxicities of high-dose methotrexate. Oncologist. 2016;21(12):1471–1482. doi:10.1634/theoncologist.2015-0164
6. Ramsey LB, Balis FM, O’Brien MM, et al. Consensus guideline for use of glucarpidase in patients with high-dose methotrexate induced acute kidney injury and delayed methotrexate clearance. Oncologist. 2018;23(1):52–61. doi:10.1634/theoncologist.2017-0243
7. Ren X, Wang Z, Yun Y, et al. Simultaneous quantification of methotrexate and its metabolite 7-hydroxy-methotrexate in human plasma for therapeutic drug monitoring. Int J Anal Chem. 2019;2019:1536532. doi:10.1155/2019/1536532
8. Zhang Q. Molecular biology study on the pathogenesis of osteosarcoma. Modern Innov China. 2009;6(29):179–181.
9. Zhang WB. Basic research of biotherapy for osteosarcoma. Chin J Cancer Biotherap. 2008;15(2):101–104.
10. Wang W. Status quo in treatment of osteosarcoma and its prospect. Acad Chin PLA Med Sch. 2013;34(2):198–200.
11. Mei SH, Shi DYM XX, Du Y, et al. Simultaneous determination of plasma methotrexate and 7-hydroxy methotrexate by UHPLC-MS/MS in patients receiving high-dose methotrexate therapy. J Pharm Biomed Anal. 2018;158:300–306. doi:10.1016/j.jpba.2018.06.011
12. Schofield RC, Ramanathan LV, Murata K, et al. Development and validation of a turbulent flow chromatography and tandem mass spectrometry method for the quantitation of methotrexate and its metabolites 7-hydroxy methotrexate and DAMPA in serum. J Chromatogr B Anal Technol Biomed Life Sci. 2015;1002:169–175. doi:10.1016/j.jchromb.2015.08.025
13. Wu D, Wang Y, Sun Y, et al. A simple, rapid and reliable liquid chromatography-mass spectrometry method for determination of methotrexate in human plasma and its application to therapeutic drug monitoring. Biomed Chromatogr. 2015;29(8):1197–1202. doi:10.1002/bmc.3408
14. Schofield RC, Ramanathan LV, Murata K, et al. Development of an assay for methotrexate and its metabolites 7-hydroxy methotrexate and DAMPA in serum by LC-MS/MS. Methods Mol Biol. 2016;1383:213–222. doi:10.1007/978-1-4939-3252-8_23
15. Roberts MS, Selvo NS, Roberts JK, et al. Determination of methotrexate, 7-hydroxymethotrexate, and 2,4-diamino-N10-methylpteroic acid by LC-MS/MS in plasma and cerebrospinal fluid and application in a pharmacokinetic analysis of high-dose methotrexate. J Liq Chromatogr Relat Technol. 2016;39(16):745–751. doi:10.1080/10826076.2016.1243558
16. Huo JP, Zhang B, Zhang DJ, et al. An ultrahigh-performance liquid chromatography-tandem mass spectrometry method for quantification of methotrexate and 7-hydroxy-methotrexate and application for therapeutic drug monitoring in patients with central nervous system lymphoma. Biomed Chromatogr. 2024;38(2):e5789. doi:10.1002/bmc.5789
17. Dasgupta A. Usefulness of monitoring free (unbound) concentrations of therapeutic drugs in patient management. Clinica Chimica Acta. 2007;377(1–2):1–13. doi:10.1016/j.cca.2006.08.026
18. Zhang FL, Xue JP, Shao JW, et al. Compilation of 222 drugs’ plasma protein binding data and guidance for study designs. Drug Discov Today. 2012;17(9–10):475–485. doi:10.1016/j.drudis.2011.12.018
19. Dong WC, Guo JL, Wu XK, et al. Relationship between the free and total methotrexate plasma concentration in children and application to predict the toxicity of HD-MTX. Front Pharmacol. 2021;12:636975. doi:10.3389/fphar.2021.636975
20. Klapkova E, Kukacka J, Kotaska K, et al. The influence of 7-OH methotrexate metabolite on clinical relevance of methotrexate determination. Clinical Laboratory. 2011;57(7–8):599–606.
21. Rakhila H, Rozek T, Hopkinsn A, et al. Quantitation of total and free teriflunomide (A77 1726) in human plasma by LC-MS/MS. J Pharm Biomed Anal. 2011;55(2):325–331. doi:10.1016/j.jpba.2011.01.034
22. Tanoue R, Imari K, Yamamoto Y, et al. Determination of free thyroid hormones in animal serum/plasma using ultrafiltration in combination with ultra-fast liquid chromatography-tandem mass spectrometry. J Chromatogr A. 2018;1539(1539):30–40. doi:10.1016/j.chroma.2018.01.044
23. Zhang J, Musson DG. Investigation of high-throughput ultrafiltration for the determination of an unbound compound in human plasma using liquid chromatography and tandem mass spectrometry with electrospray ionization. J Chromatogr B Analyt Technol Biomed Life Sci. 2006;843(1):47–56. doi:10.1016/j.jchromb.2006.05.042
24. Dong WC, Zhang ZQ, Jiang XH, et al. Effect of volume ratio of ultrafiltrate to sample solution on the analysis of free drug and measurement of free carbamazepine in clinical drug monitoring. Eur J Pharm Sci. 2013;48(1–2):332–338. doi:10.1016/j.ejps.2012.11.006
25. Feng ZY, Gao JL, Gao XN, et al. A validated HPLC-MS/MS method for quantification of methotrexate and application for therapeutic drug monitoring in children and adults with non-Hodgkin lymphoma. Drug Des Devel Ther. 2021;15:4575–4583. doi:10.2147/DDDT.S335122
26. Fabresse N, Devictor B, Pissier C, et al. Plasma 7-hydroxymethotrexate levels versus methotrexate to predict delayed elimination in children receiving high-dose methotrexate. Ther Drug Monit. 2018;40(1):76–83. doi:10.1097/FTD.0000000000000445
27. Joannon P, Oviedo I, Campbell M, et al. High-dose methotrexate therapy of childhood acute lymphoblastic leukemia: lack of relation between serum methotrexate concentration and creatinine clearance. Pediatr Blood Cancer. 2004;43(1):17–22. doi:10.1002/pbc.20032
28. Skärby T, Jönsson P, Hjorth L, et al. High-dose methotrexate: on the relationship of methotrexate elimination time vs renal function and serum methotrexate levels in 1164 courses in 264 Swedish children with acute lymphoblastic leukaemia (ALL). Cancer Chemother Pharmacol. 2003;51(4):311–320. doi:10.1007/s00280-002-0552-1
29. Mao J, Zhang L, Shen H, et al. Creatinine clearance rate and serum creatinine concentration are related to delayed methotrexate elimination in children with lymphoblastic malignancies. Neoplasma. 2014;61(1):77–82. doi:10.4149/neo_2014_011
30. Xu WQ, Zhang LY, Chen XY, et al. Serum creatinine and creatinine clearance for predicting plasma methotrexate concentrations after high dose methotrexate chemotherapy for the treatment for childhood lymphoblastic malignancies. Cancer Chemother Pharmacol. 2014;73(1):79–86. doi:10.1007/s00280-013-2319-2
31. Csordas K, Hegyi M, Eipel OT, et al. Comparison of pharmacokinetics and toxicity after high-dose methotrexate treatments in children with acute lymphoblastic leukemia. Anticancer Drugs. 2013;24(2):189–197. doi:10.1097/CAD.0b013e32835b8662
32. Holmboe L, Andersen AM, Morkrid L, et al. High dose methotrexate chemotherapy: pharmacokinetics, folate and toxicity in osteosarcoma patients. Br J Clin Pharmacol. 2012;73(1):106–114. doi:10.1111/j.1365-2125.2011.04054.x
33. Fotoohi AK, Albertioni F. Mechanisms of antifolate resistance and methotrexate efficacy in leukemia cells. Leuk Lymphoma. 2008;49(3):410–426. doi:10.1080/10428190701824569
34. Choughule KV, Joswig-Jones CA, Jones JP, et al. Interspecies differences in the metabolism of methotrexate: an insight into the active site differences between human and rabbit aldehyde oxidase. Biochem Pharmacol. 2015;96(3):288–295. doi:10.1016/j.bcp.2015.05.010
 © 2025 The Author(s). This work is published and licensed by Dove Medical Press Limited. The
full terms of this license are available at https://www.dovepress.com/terms.php
and incorporate the Creative Commons Attribution
- Non Commercial (unported, 4.0) License.
By accessing the work you hereby accept the Terms. Non-commercial uses of the work are permitted
without any further permission from Dove Medical Press Limited, provided the work is properly
attributed. For permission for commercial use of this work, please see paragraphs 4.2 and 5 of our Terms.
© 2025 The Author(s). This work is published and licensed by Dove Medical Press Limited. The
full terms of this license are available at https://www.dovepress.com/terms.php
and incorporate the Creative Commons Attribution
- Non Commercial (unported, 4.0) License.
By accessing the work you hereby accept the Terms. Non-commercial uses of the work are permitted
without any further permission from Dove Medical Press Limited, provided the work is properly
attributed. For permission for commercial use of this work, please see paragraphs 4.2 and 5 of our Terms.