")
Back to Journals » Journal of Inflammation Research » Volume 18
Single-Cell Sequencing and Transcriptome Analysis Explored Changes in Midnolin-Related Immune Microenvironment and Constructed Combined Prognostic Model for Pancreatic Cancer
Authors Guan X, Xu L, Liu J, Fei H, Wang C
Received 23 November 2024
Accepted for publication 22 February 2025
Published 26 February 2025 Volume 2025:18 Pages 2975—2990
DOI https://doi.org/10.2147/JIR.S503326
Checked for plagiarism Yes
Review by Single anonymous peer review
Peer reviewer comments 3
Editor who approved publication: Professor Ning Quan
Xiao Guan,1,* Lei Xu,2,* Jinsong Liu,3,* He Fei,1,* Chengfeng Wang1
1Department of Pancreatic and Gastric Surgery, Cancer Hospital Chinese Academy of Medical Sciences, Beijing, People’s Republic of China; 2Department of General Surgery, The First Affiliated Hospital of Nanjing Medical University, Nanjing, Jiangsu, People’s Republic of China; 3Department of VIP Medical, Cancer Hospital Chinese Academy of Medical Sciences, Beijing, People’s Republic of China
*These authors contributed equally to this work
Correspondence: Chengfeng Wang, Department of Pancreatic and Gastric Surgery, Cancer Hospital Chinese Academy of Medical Sciences, Beijing, People’s Republic of China, Email [email protected]
Background: Pancreatic cancer has one of the worst prognoses of any malignant tumor. The value of MIDN, midnolin-related genes and midnolin-related immune infiltrating cells (MICs) in the prognosis of pancreatic cancer remains unknown.
Methods: Single-cell analysis were used to identify midnolin-related genes. Immune cell infiltration was obtained using CIBERSORT. The prognostic midnolin-related genes were identified through the utilization of Cox regression and the least absolute selection operator (LASSO) approach. The combined prognostic model was created using multifactorial Cox regression analysis. Survival analyses, immune microenvironment assessments, drug sensitivity checks were performed to evaluate the combined model performance. Finally, cellular experiments were carried out to confirm MIDN significance in pancreatic cancer.
Results: The combined model was constructed based on MIDN expression, prognostic model of 10 midnolin-related genes and M1 cell infiltration. Most immune checkpoint-related genes were expressed at greater levels in the low-risk group, suggesting a greater chance of immunotherapy’s benefits. The most significant model gene, MIDN, was shown to have a function by cellular tests. In pancreatic cancer, MIDN knockdown drastically decreased pancreatic cancer cell lines’ activity, proliferation, and invasive potential.
Conclusion: The combined model helped assess the prognosis of pancreatic cancer and offered fresh perspectives on immunotherapy in particular.
Keywords: pancreatic cancer, midnolin, prognosis, immune landscape, bioinformatics
Introduction
Pancreatic cancer develops quickly and has a high death rate and is one of the most lethal malignant tumors.1 Studies showed that by 2030, pancreatic cancer will become the second most common malignant tumor in the world.2 Most pancreatic cancer patients have reached an advanced stage of the disease when they seek treatment, missing the best opportunity for radical surgical treatment, and radical surgical resection is very difficult.3 At the same time, pancreatic cancer also has common problems such as insensitivity to immunotherapy and resistance to radiotherapy, resulting in poor treatment effects and poor prognosis.4,5 Commonly used pancreatic cancer markers for clinical diagnosis are CEA and CA199.6 However, when it comes to identifying early-stage pancreatic cancer, these markers have low sensitivity and specificity, and are usually not elevated. When they are abnormally elevated, pancreatic cancer often progresses to moderate to advanced stages.7 Therefore, in an effort to enhance the general prognosis and standard of living for pancreatic cancer patients, it is crucial to thoroughly study the pathophysiology of this disease and find new therapeutic targets and biomarkers.
Immediate early genes (IEGs) are a group of genes that mediate transcriptional responses to extracellular factors.8 The transcription of late response genes (LRGs), which are cell-type specific and necessary for the reaction to an initial stimulus, is aided by IEG activation in nearly all mammalian cells.9 IEGs exhibit rapid and transient transcriptional induction in response to acute stress or proliferation-inducing signals, allowing their mRNAs to accumulate to high levels, which ensures the coordination of proliferative and damage responses.10,11 Once these mRNAs are translated, IEG proteins decay rapidly.12 Recent study has shown that midnolin is a key regulator of IEG protein degradation.13 The proteasome can selectively degrade IEG proteins by avoiding the traditional ubiquitination system through a broad process known as the midnolin-proteasome pathway.13 MIDN is the key gene in midnolin. Dysregulation of IEG leads to immunodeficiency and cancer and exacerbates chronic replication stress in cancer cells.9 It has been demonstrated that dysregulated expression of IEG targets is associated with tumorigenesis in breast cancer.14 Currently, there are no studies to understand the role of midnolin in prognostic prediction of pancreatic cancer.
The tumor immune microenvironment is thought to play a crucial role in tumor development.15 Tumor-infiltrating cells have been shown to correlate with tumor prognosis and with response to chemotherapy and immunotherapy.16 Only a tiny portion of the tumor component in pancreatic cancer tissues are tumor cells.17 Furthermore, a broad immunosuppressive milieu associated with pancreatic cancer either directly inhibits anti-tumor immunity or eludes immune monitoring, which encourages the growth of tumor cells.18 The prognosis of patients may be improved by upsetting this immunosuppressive network and encouraging immune effector cells to attack tumors. Patients with pancreatic cancer have been examined for a range of immunotherapies. Nevertheless, the majority of methods have not demonstrated the clinical efficacy observed in other cancers.19
Here, using single-cell sequencing analysis, we innovatively identified midnolin-related genes in pancreatic cancer. Based on the expression of MIDN, we also identified midnolin-related immune infiltrating cells (MICs) in pancreatic cancer patients. We created a combined prediction model for pancreatic cancer patients based on the findings of these investigations, which is capable of accurately predicting their prognosis. Research on pancreatic cancer treatment approaches is provided by this study.
Methods and Materials
Data Collection
We downloaded the TCGA datasets, which provided the clinical and transcriptome data. We employed a Counts workflow type. The GSE78229 dataset was downloaded as the external validation cohort. Data were all converted using log2. We also obtained the single-cell dataset GSE197177 for pancreatic cancer. We collected 4 midnolin genes from GeneCards database. 508 potential target genes were collected for midnolin from the study by Gu et al.13
Single Cell Sequencing Analysis
We started by checking the data for quality. Cells containing 500–4000 total genes were kept together with fewer than 1% of erythrocyte, ribosomal, and mitochondrial genes. Genes expressed in at least three cells were kept. Based on the level of variation in every sample, we determined the 4000 most variable genes. After selecting the desired cell cycles using the “CellCycleScoring” function, the impacts of the cell cycles were eliminated using the “ScaleData” function. The samples were normalized and integrated using the logarithmic normalization method. After data correction, the data were downscaled using principal component analysis and TSNE for cluster analysis. The “SingleR” was used to annotate the different cell types. The “PercentageFeatureSet” function was utilized to determine the percentage of genes present in each cell subsequent to the importation of the aforementioned midnolin genes. Our division of the cells into low and high midnolin cells was based on the median ratio of these genes. The genes that varied between these two groups were then found using the “FindMarkers” tool, and genes were filtered out (p<0.05). We defined these differential genes with midnolin target genes as midnolin-related genes. Finally, we performed differential analysis of pancreatic cancer tissue cells and neighboring normal tissue cells. The differential genes were taken intersection with midnolin-related genes.
Data Processing
The inclusion and exclusion criteria for the data were as follows: Inclusion criteria: Pancreatic cancer patients from the TCGA and GSE78229 datasets; Exclusion criteria: Patients with a survival time of 0; patients with missing age, gender, grade, and stage information in the TCGA dataset. The data were initially concatenated and preprocessed using the Perl programming language. Perl was used to alter the gene symbol. Patients without follow-up days and those with insufficient clinical data were removed. MIDN as a key gene of midnolin, we used its expression as model1.
To obtain the corresponding gene expression, midnolin-related genes were matched to the TCGA transcriptome and survival data. We then generated a random 7:3 training cohort and test cohort. The cohort utilized for external validation was the GSE78229 dataset. We screened for genes of prognostic significance by univariate Cox analysis (p<0.05). These midnolin-related genes were utilized in conjunction with the prognosis of pancreatic cancer.
Prognostic Model Construction and Evaluation
The LASSO regression approach was employed to reduce the list of midnolin-related genes having prognostic value. The prognostic model was built (model2). The risk score of each patient was calculated. Groups of patients with high and low risk were identified. Then we ran a survival analysis on both cohorts. Meanwhile, to assess the efficacy of distinguishing individuals based on risk scores, between the two groups, we showed the sample distribution and the expression of the model genes. The performance of the model2 was verified by the ROC curve. The GSE78229 dataset was used to further validate the model2 predictive performance.
Functional Enrichment Analysis
The Kyoto Encyclopedia of Genes and Genomes (KEGG) and Gene Ontology (GO) pathway studies were carried out using the “clusterProfiler” package. The results were represented by the bubble charts. Finally, the “GSVA” program was utilized to perform gene set variation analysis (GSVA).
Identification of MIC
The CIBERSORT analysis allowed us to determine the structure of 22 immune cells in pancreatic cancer.20 The percentage of each type of immune cell in each sample was displayed using rainbow plots. The differences in immune cell infiltration between the groups with high and low MDN expression were shown by box plots. MIC were classified as immune cells with p less than 0.05. The immune infiltration value of MIC was defined as model3.
Combined Model Construction and Validation
The combined prognostic model was created using multifactorial Cox regression analysis based on model1, model2, and model3. Plotting survival curves and ROC curves allowed us to assess the combined model’s clinical impact. Next, we used univariate and multivariate COX regressions to investigated if other clinical characteristics and the combined score functioned as separate risk factors for pancreatic cancer.
Immune and m6A Analysis
Heatmaps of immune infiltration and correlation maps were utilized to examine the connection between the degree of tumor infiltration and the combined model. Specifically, the CIBERSORT and QUANTISEQ methods were mainly referred. Then, The TIDE algorithm was utilized to forecast immunotherapy. Finally, immune checkpoint and m6a analysis were performed.
Drug Sensitivity Analysis
The Cancer Genome Project provided us with expression matrices and information on medication processing. Utilizing the “pRROpheticPredict” tool, drugs connected to the prognosis model were discovered (p<0.05).
Statistical Analysis
K–S test and S-W test were used to test the normality of the data (TCGA, n = 142; GSE78229, n =47). Univariate Cox analysis was used to selected the prognostic genes. Univariate and multivariate COX regression were used to investigate whether clinical characteristics and prognostic models served as separate risk factors for pancreatic cancer. The ROC curve was used to evaluate the performance of the model.
Patient Samples
Between May 2023 and October 2023, the Cancer Hospital of the Chinese Academy of Medical Sciences provided 36 pairs of pancreatic cancer samples and surrounding tissues. Patients with pancreatic cancer who had undergone major surgery without receiving any anticancer treatment prior to their pathological diagnosis were the source of these samples. Up to a subsequent examination, all samples were kept in liquid nitrogen storage. The Cancer Hospital Chinese Academy of Medical Sciences granted approval for the research, and all enrolled patients provided written informed consent (NCC2024C-011).
Cellular Experiment
Human normal pancreatic cell line (HPDE) and human pancreatic cancer cell lines (ASPC-1, BXPC-3 and SW1990) were used for cell experiments. Methods of cell transfection, qRT-PCR, WB, CCK-8 assay, EDU, colony formation assays, and transwell assay were detailed in the supplementary material.
Results
This study’s flowchart was displayed in Figure 1.
 |
Figure 1 The study’s flowchart. |
Identification of Midnolin-Related Genes
Gene expression levels were uniformly distributed, ranging from 100 to 5000 per cell across the four samples. Mitochondrial genes constituted less than 1%, while erythrocyte genes accounted for approximately 0.1% (Figure S1A). The tumor group (PC) was selected for further analysis. Each of the three samples contained an equal number of cells. A correlation of 0.89 indicated a positive relationship between gene expression levels and gene quantity (Figure S1B). From these genes, 6000 highly variable ones were selected, with the top five highlighted in red (Figure S1C). The three samples were then merged. After PCA dimensionality reduction, the TSNE clustering technique was applied to annotate each cell. Cells were classified into B cell (MS4A1, CD79A), Endothelial cells (VWF, CD93), Epithelial cells (EPCAM, CD24), Macrophage (CD68, C1QA), NK cell (GZMA, CXCR4), T cell (TRBC2, CD3D), Chondrocytes (MGP, LUM), Tissue stem cells (C11orf96) (Figure S1D). The “PercentageFeatureSet” function was used to calculate midnolin gene ratios in each cell. Cells were classified into low- and high-midnolin groups based on the median ratio of these genes (Figure 2). Differentially expressed genes between the two cell groups were identified. These differentially expressed genes were integrated with mid-target genes, yielding 1447 midnolin-related genes. Differential analysis was performed between Normal Group 2 and PC2 cell groups. The intersection of differentially expressed genes and midnolin-related genes resulted in 628 genes for further analysis.
 |
Figure 2 Distribution of high-midnolin and low-midnolin cells. |
Model2 Associated With the Prognosis of Pancreatic Cancer
First, midnolin-related genes were matched with TCGA data. Next, 38 prognostic genes were identified using univariate COX analysis (Figure 3A). The “glmnet” package was used to construct the prognostic model. The λ parameter regulates the complexity adjustment in LASSO regression. To determine the optimal λ parameter, cross-validation was performed using the built-in function of the “glmnet” package. Through LASSO regression analysis, 10 genes were further selected (λ = 0.07022325) to construct the model (Figure 3B and C). The prognostic model was calculated as follows: risk score = -FYN * 0.00583578 - CELF2 * 0.01239394 - RNF125 * 0.02666673 + C15orf48 * 0.09953565 - ARID5A * 1.06940420 + PPFIBP1 * 0.33860211 - KCTD12 * 0.05512060 – LYZ * 0.17089170 + STRAP * 0.06935298 + DDIT4 * 0.15205716. Pancreatic cancer patients were classified into high-risk and low-risk groups (Figure 4A and B). The mortality rate increased with higher risk scores (Figure 4C and D).
 |
Figure 3 Model2 construction. (A) Univariate COX analysis. 34 prognostic genes were chosen for analysis, with genes highlighted in red indicating a high-risk association, while genes highlighted in blue indicate a low-risk association. (B and C) LASSO regression analysis. (B) At λ = 0.07022325, the curve was converged. (C) Further prognostic gene selection. |
 |
Figure 4 Model2 evaluation. (A and B) The training (A) and test (B) cohorts’ risk scores. (C and D) The relationship between risk score and survival status. (E and F) A heatmap representing 10 model genes’ expression. |
Furthermore, C15orf48, PPFIBP1, STRAP, and DDIT4 were significantly upregulated in high-risk patients (Figure 4E and F). The high-risk group exhibited significantly worse outcomes (Figure 5A–C). In the training cohort, the AUC values at 1 to 5 years were 0.824, 0.814, 0.788, 0.772, and 0.792, respectively (Figure 5D). In the test cohort, the AUC values at 1 to 5 years were 0.755, 0.763, 0.782, 0.782, and 0.817, respectively (Figure 5E). In the external validation cohort, the AUC values at 1 to 5 years were 0.715, 0.810, 0.758, 0.716, and 0.817, respectively (Figure 5F).
 |
Figure 5 Model2 evaluation. (A-C) In training (A), test (B), and external validation (C) cohorts, Poor results were seen in high-risk patients. (D-F) The AUC for each of the three groups ranged from 0.7 to 0.8, basically. |
Enrichment Analysis to Identify model2 Genes Potential Pathways
The model genes were used for enrichment analysis. GO enrichment analysis identified associations with the collagen-containing extracellular matrix, extracellular matrix organization, and extracellular matrix structural constituents (Figure 6A). KEGG enrichment analysis indicated that these genes were involved in focal adhesion, tumor immunity, and the PI3K−Akt signaling pathway (Figure 6B). GSVA enrichment analysis revealed that these genes were associated with immune disease activation and the T cell receptor signaling pathway (Figure 6C).
 |
Figure 6 Functional analysis. (A) GO enrichment analysis showed these genes were collagen−containing extracellular matrix, extracellular matrix organization, and extracellular matrix structural constituent. (B) these genes were activation of focal adhesion, tumor immunity, and PI3K−Akt signaling pathway based on the KEGG enrichment analysis. (C) GSVA enrichment analysis showed these genes were T cell receptor signaling pathway and immune disease. |
M1 Macrophage Were Identified as MIC
CIBERSORT analysis identified 22 immune cell types. Figure 7A illustrated the abundance of various immune cell types in each sample. Patients were stratified into high- and low-expression groups based on the median MIDN expression. The results revealed a significant difference in M1 macrophages. M1 macrophages were identified as MIC (Figure 7B). The M1 macrophage value was used as Model 3.
 |
Figure 7 Immune cell infiltration analysis. (A) Proportion of different immune cells in the tumor. (B) Differences in immune cells between the high MIDN-expressing and low MIDN-expressing groups. We retained Macrophages M1. *: p<0.05. |
Combined Model Could Accurately Predict Pancreatic Cancer Prognosis
Multivariate COX regression was used to develop the combined prognostic model. The combined prognostic score (degrees of freedom: 3) was calculated using the following formula: Combined Score = Model1 × 0.0817 + Model2 × 5.4658 + Model3 × 3.9800. High-risk patients exhibited significantly worse prognoses (Figure 8A–C). In the training cohort, the AUC values at 1, 2, 3, 4, and 5 years were 0.839, 0.843, 0.865, 0.875, and 0.891, respectively (Figure 8D). In the test cohort, the AUC values at 1, 2, 3, 4, and 5 years were 0.800, 0.819, 0.934, 0.934, and 0.853, respectively (Figure 8E). In the validation cohort, the AUC values at 1, 2, 3, 4, and 5 years were 0.849, 0.860, 0.859, 0.866, and 0.914, respectively (Figure 8F). The F values of the combined model in the three cohorts were 0.785, 0.723, and 0.75, respectively. The results indicated that the combined model was efficient, robust, and superior to Model 2. Next, independent prognostic analysis was conducted. Univariate and multivariate COX regression analyses confirmed that the combined score was the sole independent predictor of pancreatic cancer outcomes in both cohorts (Figure 9A–D), and superior to any single model (Figure S2A-S2D).
 |
Figure 8 Combined model evaluation. (A-C) Survival analysis of the training (A), test (B), and external validation (C) cohorts. (D-F) The AUC for each of the three groups ranged from 0.8 to 0.95. |
 |
Figure 9 Independent prognostic analysis. Both univariate (A and B) and multivariate (C and D) COX regression analyses showed that only combined score was an independent prognostic factor for pancreatic cancer in training (A and C) and test (B and D) cohorts. |
Combined Score Was Closely Related to the Immune Microenvironment of Pancreatic Cancer
The immunological microenvironment plays a crucial role in tumor development. Immunocorrelation analysis revealed strong correlations between risk scores and B cells, T cells, endothelial cells, cancer-associated fibroblasts, and myeloid dendritic cells (Figure 10A). Pearson correlation coefficient also showed that macrophage M1 cells and model scores were positively correlated (Figure S3). Significant differences in immune checkpoint gene expression were observed between the two groups (Figure 10B). Furthermore, Figure 10C demonstrated that most immune responses were elevated in the low-risk group, suggesting distinct immunological environments between the two groups. To better guide immunotherapy, we examined m6A-related genes. The expression of m6A-related genes varied (Figure 10D). Finally, the results indicated significant differences in immunotherapy responses between the two groups (Figure 10E).
 |
Figure 10 Immunoassay and m6A analysis. (A) Risk ratings were substantially correlated with B cell, T cell, endothelial cell, cancer associated fibroblast and myeloid dendritic cells. (B) In low-risk groups, the majority of immunological checkpoint genes had higher expression levels. (C) The immune function is more active in low-risk groups. (D) M6A-related gene expression. (E) Immunotherapy varied significantly between the two groups. *: p<0.05. **: p<0.01. ***: p<0.001. |
Drug Sensitivity Analysis of Combined Score
To identify appropriate drugs for targeted therapy, we conducted medication susceptibility testing. Following analysis, Cisplatin, Epothilone B, Gemcitabine, Lapatinib, and Paclitaxel exhibited greater sensitivity in the high-risk group (Figure 11A–E). Cytarabine, Methotrexate, Mitomycin C, Sunitinib, and Veliparib exhibited greater sensitivity in the low-risk group (Figure 11F–J).
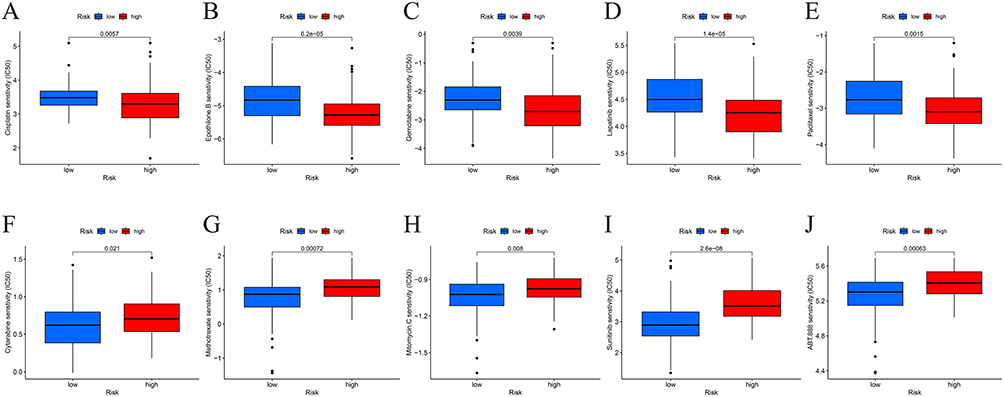 |
Figure 11 Drug sensitivity analysis. (A-E) Cisplatin, Epothilone.B, Gemcitabine, Lapatinib, and Paclitaxel were found to be more sensitive in the high-risk patients. (F and J) Cytarabine, Methotrexate, Mitomycin.C, Sunitinib, and Veliparib showed greater sensitivity in the low-risk group. |
MIDN Promoted Pancreatic Cancer Proliferation, Invasion, and Metastasis
MIDN was a key gene for midnolin and a core component of the combined model. Therefore, we selected MIDN for further investigation.
qRT-PCR and Western blot (WB) were used to assess MIDN expression in 36 pancreatic cancer tissue samples and their corresponding adjacent normal tissues to explore its role in pancreatic cancer development. The results indicated a statistically significant increase in MIDN expression in pancreatic cancer tissues compared to normal pancreatic tissues (Figure 12A). Additionally, pancreatic cancer cell lines exhibited higher MIDN expression than normal pancreatic cells (Figure 12B). Consequently, further experiments were conducted using two cell lines (ASPC-1 and SW1990) with relatively high MIDN copy numbers. The IC50 values of ASPC-1, BXPC-3 and SW1990 were 0.070, 0.037 and 0.028μg, respectively. To assess the functional role of MIDN, we knocked it down using three siRNAs and selected si-1, which exhibited the highest knockdown efficiency, for further investigation (Figure 12C). The CCK8 assay was performed to examine the impact of MIDN on cell proliferation. Compared to the vector control, MIDN knockdown significantly reduced the proliferation of ASPC-1 and SW1990 cells (Figure 12D). Furthermore, the EDU assay supported this finding (Figure 12E).
 |
Figure 12 Cell experiment. (A) Validation of MIDN expression clinically. Pancreatic cancer tissues have considerably higher levels of MIDN expression. (B) Normal colonic cells (HPDE) expressed less MIDN than pancreatic cancer cells (ASPC-1, BXPC-3 and SW1990). (C) Si-1 can cause a significant reduction in MIDN expression. (D and E) CCK8 (D) and EdU (E) assay. In comparison to the vector control, ASPC-1 and SW1990 cell proliferation was significantly reduced upon knockdown of MIDN. (F) Colony formation assays. MIDN can promote pancreatic cancer cell growth. (G and H) Tranwell assay. MIDN knockdown decreased the ability of pancreatic cancer cells to migrate and invade. *: p<0.05. **: p<0.01. ***: p<0.001. |
Colony formation assays confirmed that MIDN promotes pancreatic cancer cell growth (Figure 12F). Next, transwell assays were conducted to assess the effect of MIDN on the migration and invasion capacities of pancreatic cancer cells. MIDN knockdown decreased the migration and invasion capacities of ASPC-1 and SW1990 cells (Figure 12G and H).
Collectively, these findings demonstrate that MIDN promotes pancreatic cancer cell proliferation, invasion, and metastasis.
Discussion
In this work, the role of genes associated to midnolin in pancreatic cancer was examined by extensive bioinformatics research. In order to accurately stratify patients with pancreatic cancer and predict their prognosis, we created an midnolin-related gene-based prognostic model. The immunological microenvironment of pancreatic cancer differed significantly from those of other cancers, as demonstrated by our work. These distinctions may offer a novel therapeutic predictor for patients with pancreatic cancer. By discovering more sensitive drugs, drug sensitivity analysis assisted in stratifying pancreatic cancer therapy.
Multiple variables have a complicated role in the onset and development of cancer, which is primarily caused by random genetic alterations.21 Protein homeostasis is critical for a variety of cellular and organismal functions.22 Proteins to be degraded usually contain specific sequences called “degradation determinants”, which are combined with specific tagging affixes to be degraded by the protein hydrolysis system.23 Protein degradation processes are a more rapid and direct mechanism of cancer drug resistance than transcriptome-level regulation.24 Studies have shown that eliminating target proteins by targeting protein degradation holds great promise for the development of cancer therapies.25 Key regulators of protein degradation are dysregulated in many types of tumors, suggesting that studying the underlying molecular mechanisms may help in drug target identification and therapeutic regimen development.26 Midnolin is a new mode of protein degradation different from those mentioned in previous studies. The proteasome can selectively degrade proteins, particularly IEGs, by avoiding the traditional ubiquitination system through a broad process known as the midnolin-proteasome pathway.13 However, there are no studies on prognostic prediction of mid in pancreatic cancer. We provide the first prognostic characterization of midnolin, midnolin-related genes, and MIC in pancreatic cancer, which is important for the prognosis.
MIDN encodes a protein called midnolin, which regulates the expression of immediate early genes (IEG) to control cellular responses. Dysregulation of the signaling network that controls IEG expression may lead to cancer. Among them, IRF4 is a midnolin substrate that is essential for the function and homeostasis of mature B and T cells and is also an oncogenic driver of malignancy.27 Although Midnolin has been studied for more than two decades, its biological role remains largely unknown. Our study is the first to demonstrate the significance of Midnolin in pancreatic cancer: Midnolin is associated with poor prognosis in pancreatic cancer patients, and high expression of MIDN increases the activity, proliferation, and invasive potential of pancreatic cancer cell lines. Drug sensitivity tests also showed that cell lines with high MIDN expression are more resistant to gemcitabine. The study by Gu et al showed that the midnolin-proteasome pathway is a novel ubiquitin-independent proteasome degradation pathway, and targeting Midnolin and related metabolism may be useful for future pancreatic cancer treatment.13
The pathogenesis and development of the illness have first been explained by 11 genes in the combined model. MIDN is a protein located in the nucleus and is a key gene in the four-gene-based prognostic model of esophageal squamous cell carcinoma constructed by Li et al.28 FYN, a member of the Src family that regulates cell growth processes, is highly expressed in many cancers and promotes tumor growth, metastasis, and drug resistance.29 Downregulation of CELF2, an important splicing factor involved in selective splicing of mRNAs, has been shown to promote pancreatic cancer development and progression.30 Downregulation of the expression of RNF125, a ubiquitin ligase, is linked to a bad outcome in hepatocellular carcinoma.31 C15orf48 forms part of complex IV in the mitochondrial respiratory chain and is essential for thyroid cancer cell proliferation, migration, and apoptosis.32 ARID5A is a nucleic acid-binding protein affecting various aspects of cellular homeostasis.33 PPFIBP1 is one of the commonly expressed lipoproteins, and its overexpression promotes glioma cell infiltration.34 KCTD12 is a biomarker that can be used to predict the prognosis of breast cancer patients and can help predict the response of patients to PD-L1 or PD-1 inhibitor therapy.35 LYZ is a secreted protein with antimicrobial properties, and aberrant LYZ expression in tumor cells promotes tumor progression.36 STRAP is a transforming growth factor beta receptor-interacting protein that plays an important role in cancer development.37 DDIT4 is a DNA damage-inducible transcript, and DDIT4 upregulation is positively associated with head and neck squamous cell carcinoma lymph node metastasis.38 These genes were integrated into our work to create a combined prediction model that may aid in our understanding of tumor cells.
Pancreatic cancer risk may be elevated by both systemic and local chronic inflammation. Tumor development and metastasis are concurrently promoted by inflammatory infiltration in the tumor microenvironment (TME) linked to pancreatic cancer.39 Immune cells are the main source of cytokines. Studies had shown that tumor-associated macrophages (TAM) are predominantly present in pancreatic cancer tissues, suggesting that macrophages have a significant part in pancreatic carcinogenesis and the establishment of a suppressive TME.40 High macrophage infiltration is also connected to poor prognosis and lymph node metastases. In early-stage cancers, TAM exhibits a more pro-inflammatory macrophages M1, and one of the most important cytokines for pro-inflammatory expression in macrophages M1 is TNFα.41 The study of Ratnam et al showed that Early in the carcinogenesis process, a fine equilibrium between TAM and pancreatic cancer cells is regulated by NF-κB signaling and TNFα.42 Meanwhile, in advanced stages of cancer, TNFα plays an important role in cancer-related cachexia. Therefore, it is crucial to understand the macrophage M1 in pancreatic cancer. In our study, the differences were explored in macrophage M1 infiltration between the high and low MIDN-expressing groups, which affects how we choose to target pancreatic cancer going forward.
Tumor immune escape has been shown to be a significant indicator of tumor growth.43 Growth of the tumor is permitted by immune response evasion.44 Regulatory checkpoint receptors, tumor-infiltrating lymphocytes, and mutational load are considered to be important determinants of immunotherapy response. The remarkable features of the TME in pancreatic cancer are immunogenicity and hypoimmunoreactivity, underactivation of immunity, and oversuppression of immunity.45,46 Meanwhile, the most notable resistance of pancreatic cancer to tumor immunity is immune tolerance, which can occur at any stage of tumor development and then be maintained or even enhanced through a variety of mechanisms.47 Therefore, it is crucial to understand the TME of pancreatic cancer. In this study, by the combined model, we discovered substantial variations in immune checkpoint gene expression and immune cell infiltration that may inform immunotherapy for pancreatic cancer patients. To inform the clinical management of patients with pancreatic cancer, this study also chose medication options for each of the two groups.
However, this study had some limitations. First, retrospective data was used to build and evaluate the model. The sample size of this study was limited. This calls for prospective clinical validation. Besides, this study was validated only at the cellular level. Finally, this study did not investigate the mechanism by which MIDN affects the immune microenvironment. We want to validate our results through fundamental in vitro or in vivo investigations in the future, and we will continue to refine them.
As far as we are aware, this combined model represented the first to be built with MIDN, midnolin-related genes and MIC. Both the management of pancreatic cancer patients and the research of tumor metabolism in pancreatic cancer can benefit from it.
Conclusion
A combined pancreatic cancer model was developed using MIDN, midnolin-related genes, and MIC. This approach enabled an accurate evaluation of the immune microenvironment and prognosis of pancreatic cancer patients. Furthermore, our findings may contribute to novel therapeutic strategies for pancreatic cancer.
Data Sharing Statement
The datasets presented in this study can be found in online repositories. The names of the repository/repositories and accession number(s) can be found in the article.
Ethics Approval
We confirmed the study was reviewed and approved by the Cancer Hospital Chinese Academy of Medical Sciences Ethics Committee Review Board (NCC2024C-011) and all enrolled patients provided written informed consent. We confirmed that we followed to the guidelines outlined in the Declaration of Helsinki.
Acknowledgments
We were very grateful for the data provided by the TCGA, GEO and ICGC databases.
Author Contributions
All authors made a significant contribution to the work reported, whether that is in the conception, study design, execution, acquisition of data, analysis and interpretation, or in all these areas; took part in drafting, revising or critically reviewing the article; gave final approval of the version to be published; have agreed on the journal to which the article has been submitted; and agree to be accountable for all aspects of the work.
Funding
This work was supported by the National Natural Science Foundation of China (81972314 and 81802463), CAMS Innovation Fund for Medical Sciences (CIFMS, 2022-I2M-1- 010).
Disclosure
The authors declare that the research was conducted in the absence of any commercial or financial relationships that could be construed as a potential conflict of interest.
References
1. Ansari D, Tingstedt B, Andersson B, et al. Pancreatic cancer: yesterday, today and tomorrow. Future Oncol. 2016;12(16):1929–1946. doi:10.2217/fon-2016-0010
2. Pishvaian MJ, Blais EM, Brody JR, et al. Overall survival in patients with pancreatic cancer receiving matched therapies following molecular profiling: a retrospective analysis of the know your tumor registry trial. Lancet Oncol. 2020;21(4):508–518. doi:10.1016/S1470-2045(20)30074-7
3. Tempero MA, Malafa MP, Al-Hawary M, et al. Pancreatic adenocarcinoma, version 2.2017, NCCN clinical practice guidelines in oncology. J Natl Compr Canc Netw. 2017;15(8):1028–1061. doi:10.6004/jnccn.2017.0131
4. Siegel RL, Miller KD, Fuchs HE, Jemal A. Cancer statistics. CA Cancer J Clin. 2022;72(1):7–33. doi:10.3322/caac.21708
5. Hue JJ, Sugumar K, Markt SC, et al. Facility volume-survival relationship in patients with early-stage pancreatic adenocarcinoma treated with neoadjuvant chemotherapy followed by pancreatoduodenectomy. Surgery. 2021;170(1):207–214. doi:10.1016/j.surg.2020.12.003
6. Zhang L, Sanagapalli S, Stoita A. Challenges in diagnosis of pancreatic cancer. World J Gastroenterol. 2018;24(19):2047–2060. doi:10.3748/wjg.v24.i19.2047
7. Cai J, Chen H, Lu M, et al. Advances in the epidemiology of pancreatic cancer: trends, risk factors, screening, and prognosis. Cancer Lett. 2021;520:1–11. doi:10.1016/j.canlet.2021.06.027
8. Minatohara K, Akiyoshi M, Okuno H. Role of immediate-early genes in synaptic plasticity and neuronal ensembles underlying the memory trace. Front Mol Neurosci. 2015;8:78. doi:10.3389/fnmol.2015.00078
9. Yap E-L, Greenberg ME. Activity-regulated transcription: bridging the gap between neural activity and behavior. Neuron. 2018;100(2):330–348. doi:10.1016/j.neuron.2018.10.013
10. Benito E, Barco A. The neuronal activity-driven transcriptome. mol Neurobiol. 2015;51(3):1071–1088. doi:10.1007/s12035-014-8772-z
11. Galluzzi L, Yamazaki T, Kroemer G. Linking cellular stress responses to systemic homeostasis. Nat Rev mol Cell Biol. 2018;19(11):731–745. doi:10.1038/s41580-018-0068-0
12. Bahrami S, Drabløs F. gene regulation in the immediate-early response process. Adv Biol Regul. 2016;62:37–49. doi:10.1016/j.jbior.2016.05.001
13. Gu X, Nardone C, Kamitaki N, Mao A, Elledge SJ, Greenberg ME. The midnolin-proteasome pathway catches proteins for ubiquitination-independent degradation. Science. 2023;381(6660):eadh5021. doi:10.1126/science.adh5021
14. Guo H, Golczer G, Wittner BS, et al. NR4A1 regulates expression of immediate early genes, suppressing replication stress in cancer. Mol Cell. 2021;81(19):4041–4058.e15. doi:10.1016/j.molcel.2021.09.016
15. Pruneri G, Vingiani A, Denkert C. Tumor infiltrating lymphocytes in early breast cancer. Breast. 2018;37:207–214. doi:10.1016/j.breast.2017.03.010
16. Lee KH, Kim EY, Yun JS, et al. The prognostic and predictive value of tumor-infiltrating lymphocytes and hematologic parameters in patients with breast cancer. BMC Cancer. 2018;18(1):938. doi:10.1186/s12885-018-4832-5
17. Ware MB, El-Rayes BF, Lesinski GB. Mirage or long-awaited oasis: reinvigorating T-cell responses in pancreatic cancer. J Immunother Cancer. 2020;8(2):e001100. doi:10.1136/jitc-2020-001100
18. Zhang H, Li M, Kaboli PJ, et al. Identification of cluster of differentiation molecule-associated microRNAs as potential therapeutic targets for gastrointestinal cancer immunotherapy. Int J Biol Markers. 2021;36(2):22–32. doi:10.1177/17246008211005473
19. Leinwand J, Miller G. Regulation and modulation of antitumor immunity in pancreatic cancer. Nat Immunol. 2020;21(10):1152–1159. doi:10.1038/s41590-020-0761-y
20. Newman AM, Liu CL, Green MR, et al. Robust enumeration of cell subsets from tissue expression profiles. Nat Methods. 2015;12(5):453–457. doi:10.1038/nmeth.3337
21. Taniue K, Akimitsu N. Aberrant phase separation and cancer. FEBS J. 2022;289(1):17–39. doi:10.1111/febs.15765
22. Savitski MM, Zinn N, Faelth-Savitski M, et al. Multiplexed proteome dynamics profiling reveals mechanisms controlling protein homeostasis. Cell. 2018;173(1):260–274.e25. doi:10.1016/j.cell.2018.02.030
23. Varshavsky A. The ubiquitin system, autophagy, and regulated protein degradation. Annu Rev Biochem. 2017;86:123–128. doi:10.1146/annurev-biochem-061516-044859
24. Jan M, Sperling AS, Ebert BL. Cancer therapies based on targeted protein degradation - lessons learned with lenalidomide. Nat Rev Clin Oncol. 2021;18(7):401–417. doi:10.1038/s41571-021-00479-z
25. Lai AC, Crews CM. Induced protein degradation: an emerging drug discovery paradigm. Nat Rev Drug Discov. 2017;16(2):101–114. doi:10.1038/nrd.2016.211
26. Dale B, Cheng M, Park K-S, Kaniskan HÜ, Xiong Y, Jin J. Advancing targeted protein degradation for cancer therapy. Nat Rev Cancer. 2021;21(10):638–654. doi:10.1038/s41568-021-00365-x
27. Ma S, Shukla V, Fang L, Gould KA, Joshi SS, Lu R. Accelerated development of chronic lymphocytic leukemia in New Zealand black mice expressing a low level of interferon regulatory factor 4. J Biol Chem. 2013;288(37):26430–26440. doi:10.1074/jbc.M113.475913
28. Li J, Liu J, Li J, et al. A risk prognostic model for patients with esophageal squamous cell carcinoma basing on cuproptosis and ferroptosis. J Cancer Res Clin Oncol. 2023;149(13):11647–11659. doi:10.1007/s00432-023-05005-5
29. Peng S, Fu Y. FYN: emerging biological roles and potential therapeutic targets in cancer. J Transl Med. 2023;21(1):84. doi:10.1186/s12967-023-03930-0
30. Lai S, Wang Y, Li T, et al. N6-methyladenosine-mediated CELF2 regulates CD44 alternative splicing affecting tumorigenesis via ERAD pathway in pancreatic cancer. Cell Biosci. 2022;12(1):125. doi:10.1186/s13578-022-00844-0
31. Feng Z, Ke S, Wang C, et al. RNF125 attenuates hepatocellular carcinoma progression by downregulating SRSF1-ERK pathway. Oncogene. 2023;42(24):2017–2030. doi:10.1038/s41388-023-02710-w
32. Li C, Tang Y, Li Q, et al. The prognostic and immune significance of C15orf48 in pan-cancer and its relationship with proliferation and apoptosis of thyroid carcinoma. Front Immunol. 2023;14:1131870. doi:10.3389/fimmu.2023.1131870
33. Kk N, K T. The emerging role of Arid5a in cancer: a new target for tumors. Genes Dis. 2022;10:3. doi:10.1016/j.gendis.2021.12.012
34. Dong C, Li X, Yang J, et al. PPFIBP1 induces glioma cell migration and invasion through FAK/Src/JNK signaling pathway. Cell Death Dis. 2021;12(9):827. doi:10.1038/s41419-021-04107-7
35. Wang Z, Wu D, Dong M, Xia Y, Xu T. KCTD12 is a prognostic marker of breast cancer and correlates with tumor immune cell infiltration. Transl Cancer Res. 2021;10(1):261–272. doi:10.21037/tcr-20-2099
36. Gu Z, Wang L, Dong Q, et al. Aberrant LYZ expression in tumor cells serves as the potential biomarker and target for HCC and promotes tumor progression via csGRP78. Proc Natl Acad Sci U S A. 2023;120(29):e2215744120. doi:10.1073/pnas.2215744120
37. Je R, Pk D. TGF-beta-dependent and -independent roles of STRAP in cancer. Front Biosci. 2011;16:1. doi:10.2741/3678
38. Zhang Z, Zhu H, Zhao C, et al. DDIT4 promotes malignancy of head and neck squamous cell carcinoma. Mol Carcinog. 2023;62(3):332–347. doi:10.1002/mc.23489
39. Padoan A, Plebani M, Basso D. Inflammation and pancreatic cancer: focus on metabolism, cytokines, and immunity. Int J mol Sci. 2019;20(3):676. doi:10.3390/ijms20030676
40. Lee JJ, Bernard V, Semaan A, et al. Elucidation of tumor-stromal heterogeneity and the ligand-receptor interactome by single-cell transcriptomics in real-world pancreatic cancer biopsies. Clin Cancer Res. 2021;27(21):5912–5921. doi:10.1158/1078-0432.CCR-20-3925
41. Pergamo M, Miller G. Myeloid-derived suppressor cells and their role in pancreatic cancer. Cancer Gene Ther. 2017;24(3):100–105. doi:10.1038/cgt.2016.65
42. Ratnam NM, Peterson JM, Talbert EE, et al. NF-κB regulates GDF-15 to suppress macrophage surveillance during early tumor development. J Clin Invest. 2017;127(10):3796–3809. doi:10.1172/JCI91561
43. Batlle E, Massagué J. Transforming growth factor-β signaling in immunity and cancer. Immunity. 2019;50(4):924–940. doi:10.1016/j.immuni.2019.03.024
44. Gajewski TF, Schreiber H, Fu Y-X. Innate and adaptive immune cells in the tumor microenvironment. Nat Immunol. 2013;14(10):1014–1022. doi:10.1038/ni.2703
45. Ho WJ, Jaffee EM, Zheng L. The tumour microenvironment in pancreatic cancer - clinical challenges and opportunities. Nat Rev Clin Oncol. 2020;17(9):527–540. doi:10.1038/s41571-020-0363-5
46. Bear AS, Vonderheide RH, O’Hara MH. Challenges and opportunities for pancreatic cancer immunotherapy. Cancer Cell. 2020;38(6):788–802. doi:10.1016/j.ccell.2020.08.004
47. Jain T, Dudeja V. The war against pancreatic cancer in 2020 - advances on all fronts. Nat Rev Gastroenterol Hepatol. 2021;18(2):99–100. doi:10.1038/s41575-020-00410-4
 © 2025 The Author(s). This work is published and licensed by Dove Medical Press Limited. The
full terms of this license are available at https://www.dovepress.com/terms.php
and incorporate the Creative Commons Attribution
- Non Commercial (unported, 3.0) License.
By accessing the work you hereby accept the Terms. Non-commercial uses of the work are permitted
without any further permission from Dove Medical Press Limited, provided the work is properly
attributed. For permission for commercial use of this work, please see paragraphs 4.2 and 5 of our Terms.
© 2025 The Author(s). This work is published and licensed by Dove Medical Press Limited. The
full terms of this license are available at https://www.dovepress.com/terms.php
and incorporate the Creative Commons Attribution
- Non Commercial (unported, 3.0) License.
By accessing the work you hereby accept the Terms. Non-commercial uses of the work are permitted
without any further permission from Dove Medical Press Limited, provided the work is properly
attributed. For permission for commercial use of this work, please see paragraphs 4.2 and 5 of our Terms.