")
Back to Journals » Psychology Research and Behavior Management » Volume 17
Social Aspects of Problematic Smartphone Use: Development and Validation of the PSSNUS and Mental Health Implications for Spanish Youth
Authors Luque-Reca O, Marchena-Giráldez C, Carbonell-Colomer M, Bewernick C, Bernabéu-Brotóns E
Received 18 April 2024
Accepted for publication 22 July 2024
Published 14 November 2024 Volume 2024:17 Pages 3919—3942
DOI https://doi.org/10.2147/PRBM.S466070
Checked for plagiarism Yes
Review by Single anonymous peer review
Peer reviewer comments 3
Editor who approved publication: Dr Igor Elman
Octavio Luque-Reca,1 Carlos Marchena-Giráldez,2 Myriam Carbonell-Colomer,2 Christa Bewernick,3 Elena Bernabéu-Brotóns2
1Department of Psychology, Universidad Rey Juan Carlos, Madrid, Spain; 2Faculty of Education and Psychology, Universidad Francisco de Vitoria, Pozuelo de Alarcón, Spain; 3Master’s School of Psycho-Oncology and Palliative Care, Universidad Complutense de Madrid, Madrid, Spain
Correspondence: Elena Bernabéu-Brotóns, Facultad de Educación y Psicología, Universidad Francisco de Vitoria, Ctra. Pozuelo-Majadahonda, km 1.8, 28223, Pozuelo de Alarcón, Madrid, Spain, Email [email protected]
Purpose: Addressing the complex pattern of digital behaviors and interactions among youth, this research introduces a novel comprehensive scale, the Problematic Smartphone and Social Network Use Scale (PSSNUS), meticulously developed and validated across five studies.
Methods: Using a mixed-methods approach across five stages, including focus groups (Study 1; n = 31), cognitive interviews (Study 2; n = 16), exploratory factor analysis (Study 3; n = 316), and expert panel (Study 4; n = 4), this procedure reduced 58 initial items to an 18-item scale. Subsequently, a confirmatory factor analysis and further analyses (Study 5; n = 355) examined the factorial structure’s replicability, reliability, and validity of the scale.
Results: The PSSNUS manifested as a reliable (ω ranging 0.70– 0.89) instrument, comprising a structure with five key factors (x2 = 173.994, df = 125, p = 0.002, CFI = 0.994, CFI = 0.993, SRMR = 0.039, and RMSEA = 0.027) that capture both individual and social aspects of this construct: Psychological dependence (PD), Online interaction preference (OIP), Digital recognition desire (DRD), Social networks control seeking (SNCS), and Productivity loss (PL). Minor gender differences in both the DRD factor and in the overall score were found, with females scoring higher. The PSSNUS showed convergent and divergent validity through significant but modest correlations with daily smartphone usage hours, procrastination, emotional intelligence and mental health symptomatology (anxiety, depression and stress). This measure further exhibited incremental validity, controlling for other possible predictors, regarding anxiety, depression, and stress (6.5, 11.5 and 7.5% of additional variance explained), highlighting the DRD dimension’s unique predictive power.
Conclusion: Emerging as a solid instrument, the PSSNUS broadens the concept of problematic smartphone use among young Spaniards to include social functioning aspects, serving as an interesting tool for those aiming to explore further the adverse influence of digital media on youth.
Keywords: psychometric properties, assessment tool, mobile usage patterns, social media, multidimensional scale, mixed methods
Introduction
The use of smartphones in everyday life offers numerous advantages: not only does it allow one to connect with anyone, anywhere, and at any time, but it also helps organize schedules, ensures stress-free travel through GPS or navigation mobile apps, provides easy access to information, and is considerably useful as an educational tool.1 Given their contribution and the convenience of their use, mobile phones have become widely spread today, and the number of devices and users continues to increase exponentially. According to the Global System for Mobile Communications Association (GSMA), in 2022, there were 5.4 billion unique mobile users; by 2030, this number is expected to increase to 6.3 billion.2 University students seem to stand out as some of the most active users, considering social media essential in their lives.3
Despite the similarities found between behavioral addictions and substance-related addictions in terms of phenomenology, epidemiology, neurobiological processes, recovery, and treatment,4,5 official diagnostic classifications have not yet formally integrated these excessive or abusive behaviors. The current diagnostic classification of the American Psychological Association only considers “pathological gambling” as an addiction, although scientific literature describes many other substance-free addictive behaviors, such as sex addiction6 or internet addiction.7 Within internet addiction, the pathological use of web-connected mobile phones (smartphones) has been gaining greater importance in recent years. This phenomenon is especially observed among the younger population, primarily linked to access to social networks.8 The conceptualization of excessive mobile phone use and addiction varies considerably depending on the diagnostic criteria of different authors and the multitude of instruments available for evaluation.9–14
Problematic smartphone use has become a significant concern worldwide, with a constant growth in the number of users and the time dedicated to using the device. However, when exploring this issue, researchers have used a diverse range of terms such as excessive smartphone use, mobile phone dependence, and, most notably, smartphone addiction and problematic smartphone use. Another frequently used term is nomophobia (acronym of no-mobile-phobia, which refers to the irrational fear of not having the mobile phone), defined as the urge to be constantly in contact with our social networks through the Internet and personal, portable devices that allow us to connect to them.15 Smartphone addiction is described as the inability to properly manage and regulate the use of the mobile phone (uncontrollable and excessive),16,17 leading to a progressive deterioration individual performance, along with pronounced nervousness and aggressive behavior when deprived of its use.12,18 In contrast, problematic smartphone use is specifically defined as a compulsive pattern of smartphone usage associated with significant impairment across multiple domains of individual functioning that is characterized by certain addiction-like symptoms.13 Therefore, while some researchers have conceptualized this phenomenon from a strict behavioral addiction perspective and have focused primarily on indicators such as overuse, tolerance, or withdrawal,9–11 others have opted for a less pathologizing approach and have concentrated more on the degree to which smartphone use causes dysfunction in several spheres of the user’s life.12–14
Neurologically, this phenomenon can lead to significant changes in brain structure and function. While drug dependence alters brain structures through chemical pathways, conditions that can be considered behavioral addictions could influence brain function through operant learning with rewards and punishments.19,20 Meta-analyses have demonstrated that excessive smartphone use reduces brain volume in key areas such as the anterior cingulate cortex and superior frontal gyrus, particularly in adolescents. This reduction impacts inhibitory control mechanisms and is associated with higher impulsivity in users.21,22 At the psychological level, various studies indicate that addiction or excessive use of smartphones is associated in the general population with psychological disorders such as depression, anxiety, and poor sleep quality.14,23–31 This overuse is also correlated with suicidal ideation,29,32 low self-esteem, isolation, and poor family relationships.17,33 Therefore, the magnitude of the problem indicates the need for a current, valid, and reliable assessment tool that allows for evaluating the adverse effects of mobile phone use and its extent among the general population.
The study of mobile phone abuse began in 2004 with the development of the Mobile Phone Dependence Questionnaire (CPDQ), intended for application and validation among Japanese university students.34 The scale comprises 29 items that are divided into 6 dimensions: concern about mobile connection services, anxiety about not being able to use a mobile phone, excessive use of telephone services, mobile phone usage in public places, demand for other people to carry mobile phone, and the requirement to have a mobile phone. One year later, Bianchi and Phillips35 developed the Mobile Phone Problem Use Scale (MPPUS) for adult populations, which was adapted in 2012 for Spanish adolescents,36 evidencing its adaptability. Factorial analysis of both the original scale and its Spanish adaptation confirmed one-dimensionality. Since then, numerous self-report scales have been developed to assess smartphone use, although the most widely used so far has been the Smartphone Addiction Scale (SAS).9 Introduced over a decade ago, this comprehensive 46-item assessment tool has been the foundation for numerous versions and adaptations aimed at evaluating mobile phone addiction, aligning with DSM-IV criteria for substance abuse disorders. A shortened version of the SAS has been validated for the Spanish adult population,37 displaying evidence of its unidimensional structure, consistent with the original version.
Recognizing the complexities of translating and adapting psychological assessment tools across cultural boundaries and the potential for mistranslation, as highlighted by Mikulic and Muños,38 some researchers have opted to develop assessment instruments directly within their cultural context.9,14 This approach is illustrated by the creation of specific tools in Spanish, notably the Test of Mobile Phone Dependence (TMP)10 for adolescents and the ATeMo scale11 for young Spaniards. These instruments, which are based on the Diagnostic and Statistical Manual for Mental Disorders-Fourth Edition-Text Revision criteria for substance use disorders, offer a detailed exploration of mobile phone dependence. The TMP scale identifies a structure of abstinence, lack of control, and tolerance, while the ATeMo questionnaire encompasses four factors (ie, craving, loss of control, negative life implications, and withdrawal syndrome), thereby providing a nuanced framework for understanding mobile phone abuse within the Spanish context.
During the recent years, the progressively widespread use of smartphones across a multitude of activities, along with the growing significance and importance of social network sites, has fundamentally altered people’s mobile phone usage patterns. Younger individuals predominantly engage with smartphones for the purpose of accessing social networks, which serve as vehicles/platforms for communication, the building of communities, and the exchange of user-generated content like opinions, messages, photos, and videos over the internet.7 Young people spend an average of 5.5 hours a day on social media, according to a recent study that involved Spanish teenage users between the ages of 15 and 26.39 This scenario emphasizes the need to update and optimize those assessment tools specifically designed to evaluate problematic smartphone use to develop more applicable and comprehensive measures. Beyond assessing the mere presence of device dependency, multifaceted instruments must be developed to identify those patterns of smartphone and social media use that are maladaptive or problematic for the quality of life of the individual. Bearing this in mind, it is crucial for current measures aimed at disentangling problematic aspects of smartphone use to employ a broader perspective, not merely focusing on the individual’s experienced discomfort but also delving into the potentially harmful impacts on social interactions (ie, relationships with partners, friends, colleagues, etc).
The primary aim of the current study was to develop and validate, through the completion of five different studies, a concise, comprehensive, and psychometrically sound Spanish self-assessed scale designed to evaluate patterns of smartphone and social media use that adversely affect the user’s personal and social functioning.
The Present Research
This research was structured into two stages (see, Table 1). The qualitative stage was dedicated to the creation of items that accurately represented the construct for young individuals (Study 1), assessing the relevance and understandability of these items for this age group (Study 2), and the examination of item content suitability by experts (Study 4). The quantitative stage focused on initially exploring and refining the scale’s factorial structure (Study 3), followed by a replication of the factorial configuration using an alternative sample and a comprehensive and rigorous analysis of its reliability and validity (Study 5). The present research was conducted over a 9 month period.
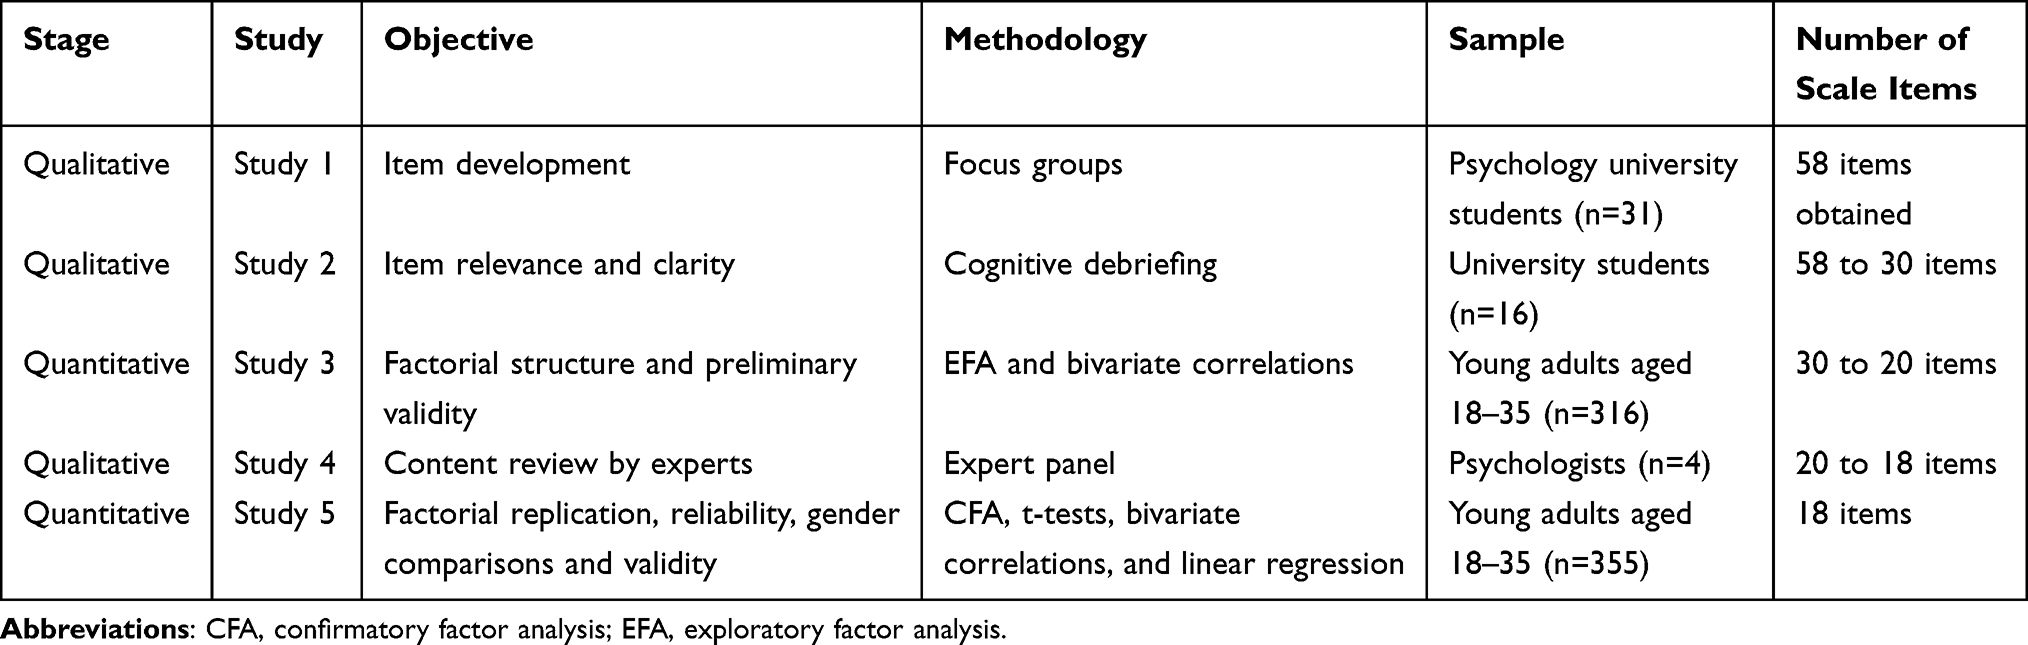 |
Table 1 Study Phases Comprising the PSSNUS Validation Process |
Study 1: Focus Groups (n = 31)
This initial study was concentrated on ensuring the content validity of the instrument. The specific objective was to create a broad and representative pool of items that encapsulate the principal negative aspects associated with the problematic use of smartphones and social networks among young Spaniards. To achieve this, qualitative focus group interviews were conducted to explore patterns of smartphone and social network usage that the youth identified and regarded as problematic, both on an individual and social level. The behaviors and situations described by the participants in the focus groups informed the subsequent development of items to be included in the initial item pool.
Methods for Study 1
Participants
Our research benefited from the contributions of 31 young Spanish adults (M age = 19.42; SD = 0.67; range = 19–21 years), all second-year psychology students at Francisco de Vitoria University in Madrid, Spain. The participants were recruited through announcements posted on university bulletin boards, targeting volunteer students from various undergraduate programs at the university. The composition of our focus groups was carefully considered: the first group included 12 women, the second was made up of 11 men, and the third group featured an equal mix of 4 men and 4 women. In all the studies of this investigation, participants were asked about their gender, offering three options: man, woman, and non-binary. Through convenience sampling, we aimed to gather a diverse array of perspectives and insights into this phenomenon.
Procedure
Adhering to Vogt et al recommendations,40 the focus group meetings were conducted for approximately 60 minutes each. These sessions were expertly guided by a moderator with a Ph.D. in psychology and extensive knowledge of qualitative research methods, while an observer recorded important details (especially when non-verbal cues or multiple conversations were being discussed). Each focus group unfolded in the following manner: i) The moderator and observer introduced themselves; ii) The session’s goals and procedural details were shared (this included information about the audio recording setup, the process for securing participants’ written informed consent, assurances of anonymity, etc)., along with expectations for how participants should engage (such as the importance of respecting each other’s turns to speak and opinions, the encouragement of using everyday language, the premise that all contributions are meaningful, and a keen interest in personal experiences with smartphone use and its emotional impacts); iii) A self-introduction round for participants, asking them to share their name, gender, age, and their self-assessed smartphone and social media usage frequency; iv) The moderator posed several open-ended questions to spark conversation (eg, What springs to mind with the mention of problematic use of smartphones and social networks? What behaviors are typical of such use?); v) A period for sharing and discussing experiences and views, with the moderator interjecting only when necessary (for example, to boost engagement, request elaboration on certain experiences, or to explore contrasting opinions); and vi) An opportunity for participants to highlight any overlooked topics or scenarios, followed by expressions of gratitude for their involvement and the conclusion of the session. Participants were prompted to discuss the topics as reflective of their demographic group, rather than their individual selves.
The audio from each focus group was accurately transcribed by the moderator, who also identified the speakers. The transcriptions were then meticulously analyzed by the research team to identify patterns and themes. This involved a thorough, line-by-line examination of the transcripts to capture nuances and recurrent ideas. This entire process was conducted manually to ensure a comprehensive understanding of the participants’ perspectives. The research team then distilled this data into instances indicative of problematic smartphone and social network use, grouping these into similar categories. Once these categories were established, they were used as a framework to generate specific items encapsulating the behaviors, thoughts, and emotions described by participants. Following Hinkin’s guidelines,41 we crafted concise, straightforward items for each category, avoiding leading or complex questions and minimizing reverse-scored items. Efforts were made to maintain precise language while reflecting the participants’ expressed terms and situations.
All five studies in this research were conducted in strict accordance with the ethical standards mentioned in the Ethical Statement section, with the local ethics committee’s approval as detailed therein.
Results for Study 1
Upon reviewing the transcriptions, and before conducting in-depth factorial analyses, it became clear that the discussions within the focus groups predominantly centered on: a) Emotional states, actions, and circumstances that signal dependence and overuse, which in turn cause other areas of the user’s life to be overlooked; b) A preference for dodging in-person interactions in favor of those online; c) Passive-aggressive communication styles via social media and messaging applications; and d) Emotions, thoughts, and actions focused on the envy and intense quest for social acclaim seen in others on social platforms. Additionally, albeit less commonly, experiences and scenarios relating to the next categories were noted: e) Smartphone and social media-based control actions directed at significant others; and f) “Social disconnectedness”, or feeling disconnected despite a wide network of social media contacts. Across the three focus groups, the shared and debated situations and behavioral trends remained consistent, except for discussions on envy and the pursuit of social recognition on social media, which were exclusively highlighted by the female-only focus group participants.
Finally, a pair of researchers skilled in psychometrics, social psychology, and the problematic use of smartphones was responsible for item development from the behaviors and situations discussed in the focus groups, which preliminarily appeared linked to one of the six outlined thematic categories. For each potentially interesting behavior or situation for this psychosocial issue, items were formulated with varying specificity levels, targeting behaviors (eg, “Even though I’m having a good time, I tend to check my smartphone every so often”), beliefs (eg, “ When I look at the posts (photos, status updates, etc.) of my SS.NN. contacts I often get the impression that they enjoy themselves and have more fun than I do “), or emotions (eg, “When I’m separated from my smartphone for some time, I feel nervous”). This process resulted in an initial pool of 58 statements. A Likert scale with 7 response options (1 = strongly disagree; 7 = strongly agree) was chosen for responses.
Study 2: Cognitive Debriefing (n = 16)
Methods for Study 2
The study focused on enhancing the content validity of the instrument. The specific aim was to ensure that the set of items had sufficient relevance (ie, the items are important to the construct of problematic smartphone use) and comprehensibility (ie, the items are correctly interpreted and understood by the respondents). With the participation of a small group of young adults, cognitive interviews were conducted with a focus on both improving the wording of the sentences and including in the initial version (composed of 58 items) of the scale those items that exhibited adequate properties.
Participants
Sixteen (n = 16) young Spanish individuals (M age = 19.94; SD = 1.29; range = 18–22 years), students at various university degrees at the Universidad Francisco de Vitoria (Madrid, Spain), were selected through convenience sampling and participated in the cognitive debriefing. For this study, a subsequent announcement was made on the same university bulletin boards to recruit volunteer students from various undergraduate programs at the institution.
Procedure
Participants independently rated each of the 58 items in the initial pool using a Likert scale of 1 to 7 (1 = strongly disagree; 7 = strongly agree). The ratings evaluated both the item’s importance to the construct of problematic smartphone use and the comprehensibility (ie, clarity) of the item’s wording. Participants were also given the chance to suggest alternative wordings for the items.
The researchers followed an ad hoc procedure to analyze the participants’ item evaluations: i) Items that seemed to cover related situations and aspects were grouped together; ii) Items within each category were sorted by comprehensibility, and those with average scores below 5 were identified; iii) Items in each category with an average relevance score below 5 were identified; iv) Suggestions for alternative item wordings were reviewed; and v) Items within each category that scored below 5 in either relevance or comprehensibility were eliminated. Items whose average comprehensibility value was slightly below 5 but recorded a relevance value of 5 or higher were retained, modifying their wording (if there was a proposal for clearer wording, it was incorporated).
Results for Study 2
The set of 58 items achieved an average comprehensibility score of 5.08 points (with a range of 3.50 to 6.69). In terms of relevance, the data reveals an average score of 5.43 points. This score falls within a range that spans from 3.88 to 6.88 points. Out of the 58 items, 28 were eliminated as they did not meet the minimum comprehensibility and relevance scores previously cited. The average comprehensibility and relevance scores for the 30 chosen items were 5.67 (ranging from 4.94 to 6.69) and 5.59 (ranging from 5.00 to 6.88), respectively. Upon reviewing the participants’ suggestions for wording modifications, the decision was made to slightly alter the phrasing of three selected items (these three items had an average comprehensibility score of 4.94 but were retained due to their average relevance score being over 5 in all instances).
Study 3: Exploratory Factor Analysis and Preliminary Validity Analyses (n = 316)
Starting from the 30 items with the highest levels of comprehensibility and relevance selected in Study 2, this study explored the dimensionality of problematic smartphone and network use in a broad sample of Spanish youth. Once an identifiable factorial structure was achieved, the ultimate goal was to refine the instrument to arrive at a brief version of it that included the most suitable items for evaluating the different aspects of this psychosocial phenomenon. Additionally, a preliminary analysis was conducted to explore its convergent and discriminant validity with respect to a measure of abusive Internet use and a question about the number of daily hours of smartphone usage.
Methods for Study 3
Participants
The following inclusion criteria were established to participate in the study: participants had to i) have their own smartphone with internet connection, and 2) be aged 18–35. Using convenience sampling, we gathered a diverse group of young Spanish adults (n = 316) from central and southern Spain (58.90% women; 1.27% non-binary; M age = 23.26; SD = 4.56; range = 18–35 years) who met these criteria. Their education varied: 42.40% had secondary education, and 57.60% had university degrees. According to the 10:1 participant-item ratio rule of thumb,42 the sample was sufficient for the statistical procedure.
Procedure
To reach participants, volunteers were solicited (through posters and social media postings) from both university students and their acquaintances. Participants were invited to the facilities of Francisco de Vitoria University (Madrid, Spain) and the University of Jaén (Jaén, Spain), where they completed the survey on paper under the supervision of the researchers. Prior to starting, it was verified that participants met the inclusion criteria, they were given an informed consent form to sign, and were reminded that their participation was completely anonymous.
Participants reported the degree to which they agreed or disagreed with each of the 30 items about smartphone usage initially included in the scale using a 7-point Likert scale (1 = totally disagree; 7 = totally agree). Additionally, the survey included a 12-item instrument to assess abusive internet usage43 and a question about the number of daily hours of smartphone use. Completing the survey took approximately 5 minutes per participant. To reach participants, volunteers were solicited (through posters and social media postings) from university students and their acquaintances. Participants were summoned in person at university facilities where they completed the paper forms under the supervision of researchers. Before starting, participants were checked to ensure that they met the inclusion criteria, received an informed consent form to sign, and reminded that their participation was completely anonymous. Completing the survey took about 5 minutes per participant. When handing out the survey, the researchers checked that there were no unanswered items and thanked the participants for their collaboration. The responses recorded on the paper forms were finally transferred to a digital database for further exploration of the factorial configuration and preliminary analysis of convergent/divergent validity.
Instruments
To evaluate problematic smartphone and social network use, the PSSNUS was developed. In the present study, the initial 30-item version was used as a starting point for subsequent reduction and refinement.
Participants’ daily smartphone usage was measured by the question, “indicate the number of hours you use your smartphone per day”.
The phenomenon of abusive internet usage was assessed using the Internet Abusive Use Questionnaire (IAUQ).43 This tool is unifactorial in nature, comprising 12 items on a 5-point Likert scale (0 = totally disagree; 4 = totally agree). The scale features items such as “in order to feel satisfied, you must now be connected to the Internet for a longer period of time than before” and “you feel that your life is boring and empty without the Internet”, and it boasts excellent psychometric properties within the Spanish population.43 In this study, the IAUQ demonstrated high internal consistency (α = 0.90).
Data Analysis
Statistical analyses were performed using R software version 4.3.0 (packages EFAtools, psych, e1071, GPArotation, REdaS and tidyverse).
Preliminarily, assumptions of normality, linearity, and homogeneity were verified by inspecting the skewness and kurtosis values (located in the range of +-2 for skewness and in the range of +-3 for kurtosis),44 Q-Q plots and scatter plots, respectively. Subsequently, we analyzed whether the sample and the correlation matrix were adequate to perform an EFA using the Kaiser-Meyer-Olkin index (KMO) and Bartlett’s sphericity test. Values above 0.80 in the KMO and a significant result in Bartlett’s test are indicative of the adequacy of the data for EFA.42,45
Following the recommendation of Lloret-Segura,45 a combination of criteria was used to determine the number of factors to extract. Recent research46 recommends combining parallel analysis (PA)47 and comparison data method (CD)48 with some additional criterion (eg, scree plot). Specifically, PA is a method based on selecting those factors that present empirical eigenvalues greater than those that would be obtained randomly, while CD is an extension of parallel analysis that, applying an iterative procedure with simulation data, reproduces the observed correlation matrix instead of using random data. The estimation method used in the PA was maximum likelihood. As suggested by Ruscio & Roche,48 the settings of the CD method were the following: the analysis was conducted until there was no significant improvement; to determine the improvement produced by the addition of a factor, an alpha of 0.30 was used; the population size was set at 10,000; and 500 samples from each population were taken. Additionally, considering its wide use, Cattell's scree plot,49 a graphical method that examines the inflection point of a plot that compares eigenvalues across different potential solutions with varying numbers of factors, was also used.
When performing the EFA, the maximum likelihood method and an oblique rotation (ie, oblimin) were employed for factor extraction due to the apparent normality of the data and the expected correlation among factors.45 To identify a stable factor structure, the factor loadings of the items in each factor and the percentage of variance explained by each factor were explored. Following the criterion of some authors, both those items with factor loadings below 0.4042 and those items that simultaneously loaded on more than one factor and in which the difference between the highest factor loading and the next was less than 0.1550 were deleted. In parallel, since the maximum likelihood method was used, the overall fit of the factor model was assessed using the fit indices called Comparative Fit Index (CFI), Root Mean Square Error of Approximation (RMSEA) with its 90% confidence interval (CI), and Tucker-Lewis Index (TLI). Hence, CFI ≥ 0.95, TLI ≥ 0.95, and RMSEA ≤ 0.06 indicate good model fit.51 Ultimately, a reiteration of the EFA was conducted after discarding those items that exhibited poorer performance, to ensure the consistency of the factor solution after the deletion of items.
As a final step, to conduct a preliminary exploration of the convergent and divergent validity of the PSSNUS, bivariate correlations were calculated between the refined version of the scale after the latest EFA and the variables of internet overuse and number of hours of smartphone usage.
Results for Study 3
Prior to the analysis and based on the 30 items resulting from Study 2, we thoroughly assessed and confirmed compliance with all relevant assumptions (ie, normality, linearity, and homogeneity). The KMO index reached an outstanding level of 0.90, whereas Bartlett’s test of sphericity was significant (χ2 = 3994.041; df = 435; p < 0.001), suggesting the data was appropriate for EFA. Upon examination, both the scree plot and the PA, along with the CD, consistently suggested four as the optimal number of factors to be extracted.
Therefore, the factor loadings, communalities after extraction and item complexity obtained in the EFA are displayed in Table 2 (left section). The four identified factors accounted for 44% of the overall accumulated variance. The overall fit of this structure of 30 items grouped into four factors was relatively poor (CFI = 0.924, TLI = 0.896, and RMSEA = 0.052 [90% CI: 0.045–0.058]). In addition, although the average item complexity was 1.5, some items demonstrated simultaneous loadings on two or even three factors, exceeding complexity values of 2 or 3, respectively. Specifically, 10 items of the scale had low factor loadings (below 0.40), of which 6 also exhibited cross-loadings. This led to the removal of these 10 items and the subsequent conduct of a new EFA.
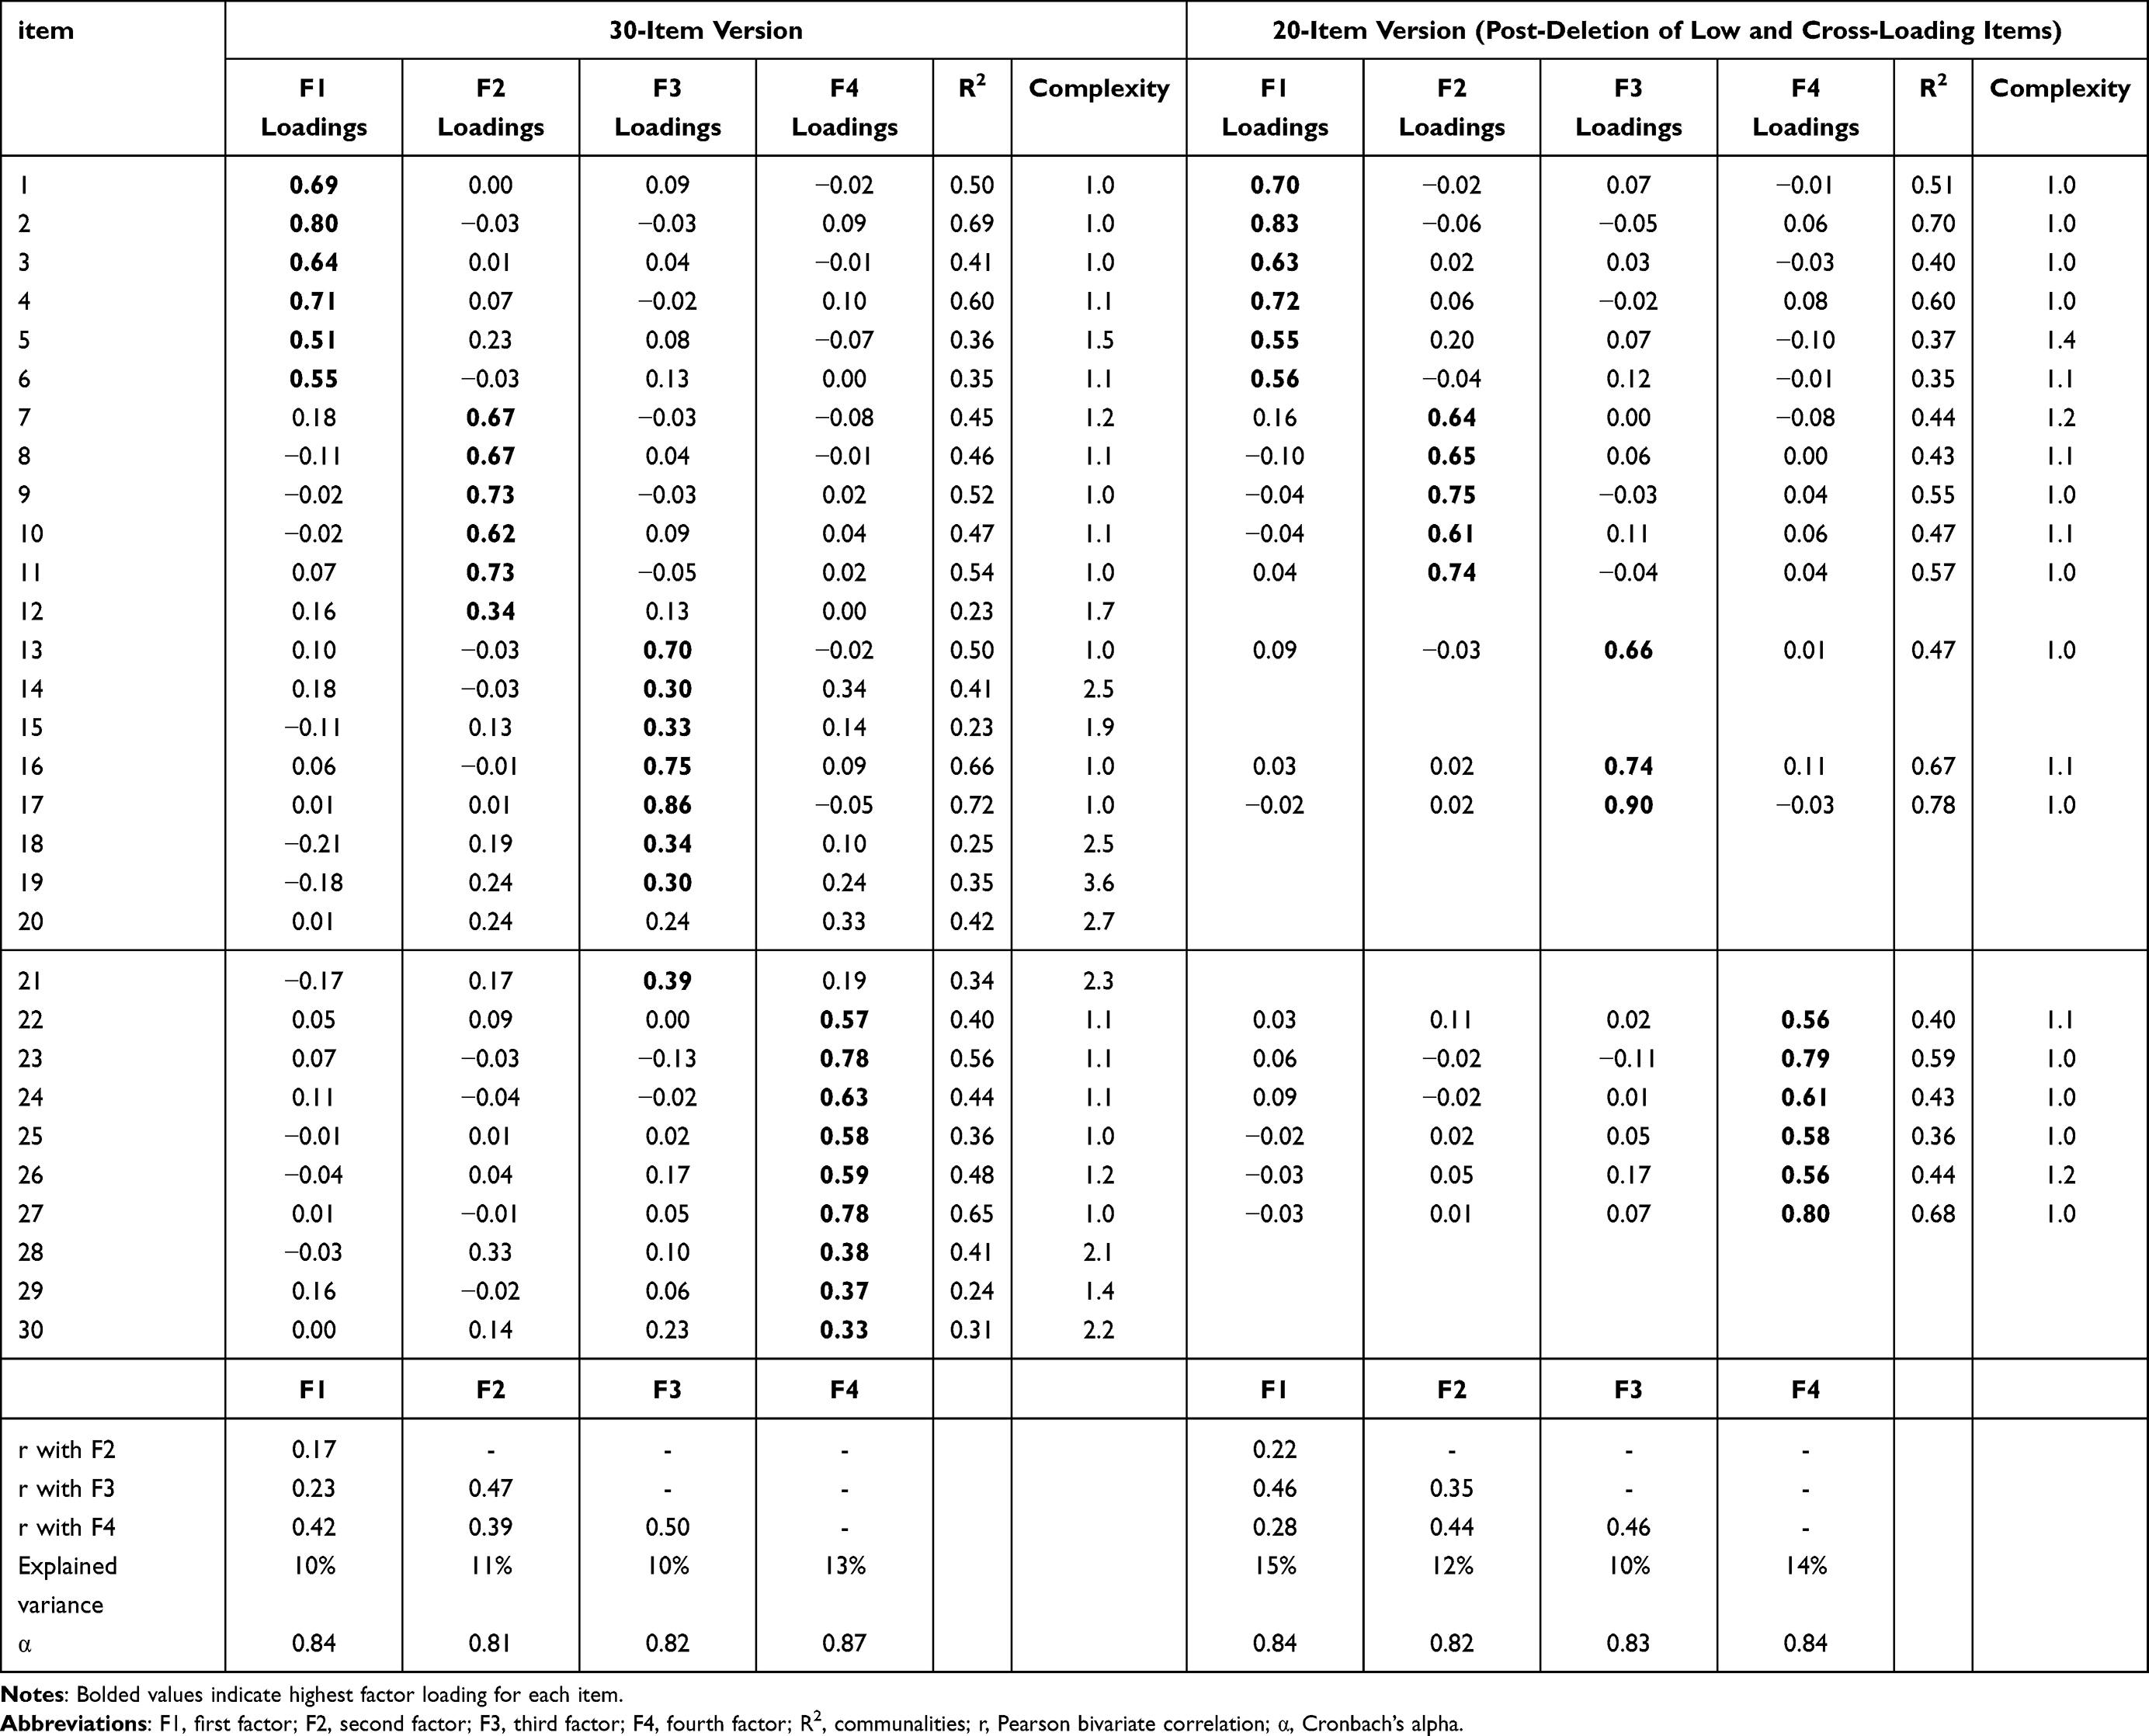 |
Table 2 EFA Rotated Factor Matrix: Summary for the 30-Item and 20-Item Versions (n = 316) |
In the new reduced version of 20 items, the scree plot, CD and PA also suggested four factors to be extracted. Table 2, on its right section, lists the factor loadings, the communalities, and the complexity associated with each item. The complexity of the items (with a mean value of 1.1), along with their factor loadings (ranging from 0.55 to 0.90), reveal a more defined structure that lacks cross-loadings. In this case, the factors explained 51% of the overall accumulated variance. This configuration, comprising 20 items across four factors, demonstrated good adjustment (CFI = 0.963, TLI = 0.978, and RMSEA = 0.038 [90% CI: 0.025–0.050]). The item’s content suggests that factor 1 is associated with signs of psychological dependence arising from not having immediate access to the smartphone and the urgent need to check it; factor 2 is related to the tendency to favor communication via smartphones or social networking sites for resolving conflicts, sharing feelings or providing comfort; factor 3 is linked to harboring feelings of envy and sadness in the desire for the life and social prestige exhibited by others on social networks; and factor 4 relates to seeking to govern digital interactions with us and valued individuals, experiencing discomfort when this control is not achieved.
In the correlation analysis, there were observed correlations ranging from low to moderate among the four factors of problematic smartphone use and the total daily device usage hours per day. The r values were as follows: 0.28 for dependence-related aspects (factor 1), 0.22 for the preference towards online interactions (factor 2), 0.31 regarding the need for social acknowledgment (factor 3), and 0.35 for smartphone control-seeking behaviors (factor 4). The analysis also revealed relatively high bivariate correlations between the four identified factors of problematic smartphone use and internet addiction. These correlations were recorded as 0.56 for factor 1, 0.53 for factor 2, 0.50 for factor 3, and 0.53 for factor 4.
Study 4: Expert Panel (n = 4)
A small team of four experts, each specializing in different areas of psychology, was tasked with evaluating the content of the 20 items ultimately selected in the EFA. The purpose of this panel was to assess the relevance of retaining these items as part of the scale, to consider any necessary modifications in their wording, or even to suggest the addition of new items that could capture aspects of the phenomenon not previously assessed by the instrument.
Methods for Study 4
Participants
Utilizing convenience sampling, this study involved the participation of four psychologists (n = 4) from Spain (M age = 43.25; SD = 8.04; range = 34–55 years). They were equally divided by gender and operated within the realms of university scholarship or personal psychological therapy. Psychologists from various centers and universities across the country were contacted via email, ensuring they had no direct relationship with the research team to avoid potential biases. These experts were informed about the study’s objective and invited to contribute their specialized knowledge. Their areas of specialization, carefully selected to ensure suitable experience, were as follows: a psychometrician experienced in the development and validation of psychological scales; a social psychologist with knowledge of group dynamics and social influence; a health psychologist with experience in managing behavioral addictions; and a social psychologist versed in the study of technological usage habits.
Procedure
The experts were asked to fill out a concise questionnaire encompassing the 20 items derived from the EFA. For each item, they assessed its suitability for measuring aspects of problematic smartphone use, suggesting modifications or removal if the content was deemed ambiguous, irrelevant, or redundant. Additionally, those recommending changes were requested to provide written justifications for their suggestions. As a final task, participants were invited to review the overall scale and identify any missing elements of problematic smartphone use, offering specific items for inclusion if necessary. The selection of four experts aimed to balance thoroughness and efficiency, ensuring a comprehensive review while keeping the process manageable. As a criterion for considering revisions to the scale’s items, it was stipulated that at least two of the four experts needed to suggest modification or removal of the same item. The appropriateness of incorporating new facets of problematic smartphone use was assessed more qualitatively, allowing for consideration, even if proposed by only one of the four experts.
Results for Study 4
Overall, six items were recommended for removal by two or more experts. Among these, item 3 was suggested for elimination by two experts, both of whom argued that it focused more on the physical need to hold the mobile phone rather than its actual usage. The deletion of items 6 (pertaining to the need to check device notifications) and 11 (concerning the preference for expressing feelings digitally rather than in person) was proposed by three and four experts, respectively. This was due to their belief that these items were not sufficiently specific and that other items on the scale more accurately assessed these aspects of problematic smartphone use. Items 24 and 27 were also advised for removal by three experts, as they deemed these statements to be more about individuals’ beliefs regarding social media as a tool for controlling others, rather than whether the individual uses social media for such control. Additionally, three experts recommended removing item 26 (“Sometimes, after getting angry with a contact in a Whatsapp group, I’ve created a new group without that person”), agreeing that it assessed a very specific passive-aggressive behavior rather than, like the rest of the items in the dimension, control behaviors over others.
Furthermore, the expert panel suggested modifying only two items. For item 5, which states, “Even though I’m having a really good time, I feel the need to check my smartphone every so often”, two out of four experts recommended the removal of the word “really”. In contrast, for item 23 (“I tend to check the comments that people make on SNS posts by my significant other”), three experts suggested the inclusion of friends in the statement.
Regarding the proposal to add aspects of problematic smartphone use not covered in the scale, two of the four panel experts deemed it appropriate to also assess the loss of productivity and concentration in performing daily tasks due to the use of smartphones and social networks. One of these experts, in the open-response section, proposed four potential items to evaluate this aspect of the phenomenon (eg, “Often I realize that checking my smartphone reduces my productivity” or “I frequently spend more time than needed to perform tasks due to being distracted by my smartphone”).
Consequently, having met the previously specified criteria, we proceeded to remove the six items (items 3, 6, 11, 24, 26, and 27) suggested by the panel, as well as to make slight modifications to two additional items (items 5 and 23). Furthermore, aiming to enrich the conceptualization of problematic smartphone use, specifically regarding its impact on productivity, we deemed it crucial to integrate this new aspect or facet, thereby broadening our understanding of this psycho-social phenomenon. This led to the addition of four new items to the overall scale, culminating in a total of 18 items in the final version.
Study 5: Confirmatory Factor Analysis, Gender Comparisons, Reliability and Validity Analyses (n = 355)
In this study, the final 18-item form of the PSSNUS was analyzed using a confirmatory factor analysis (CFA) to determine if its factorial structure was consistent with that identified in the EFA in Study 3. Following an exploration of the PSSNUS’s dimensionality (through the comparison of different theoretically feasible factorial configurations), the current research further focused on examining potential variations in the instrument’s dimensions based on gender, in addition to evaluating its validity and reliability.
Methods for Study 5
Participants
In this study, the same inclusion criteria were maintained as in study 3. Therefore, by means of convenience sampling, 355 young adults (56.10% women; M age = 23.61; SD age = 5.26; range = 18–35 years; 42% with university studies) from the Comunidad de Madrid (Spain) were recruited. Participants also reported a daily smartphone usage of 4.74 hours on average (SD = 2.74; range from 0 to 16 hours per day). We made sure our study had enough participants, comfortably going over Hair et al42 rule of thumb that suggests a 10:1 ratio of participants for each item.
Procedure
In Study 5, an online form was created to anonymously gather sociodemographic data (age, gender, educational level, daily smartphone usage) and self-assessed measures of problematic smartphone and social media use, procrastination, emotional intelligence, and symptoms of anxiety, depression, and stress. Participants were informed at the start of the form that their participation was anonymous and voluntary, and they could discontinue at any time. The form was disseminated through notices on university bulletin boards and an appeal to students at the Universidad Rey Juan Carlos and Universidad Francisco de Vitoria in Madrid (Spain), with researchers encouraging completion and sharing of the form’s link. Recruitment and distribution also occurred through personal contacts of researchers and students, targeting individuals aged 18–35 years. Responses outside this age range were subsequently excluded. Completion of the form took between 6 to 10 minutes. Data were then transferred to a digital database for preliminary inspection for anomalous response patterns before statistical analysis.
Instruments
The number of daily hours of smartphone usage was assessed using the question “indicate the number of hours you use your smartphone per day”.
The Problematic Smartphone and Social Networks Use Scale (PSSNUS), as indicated by findings from Study 3 and Study 4, is developed to evaluate five aspects of problematic smartphone and social networks use. It specifically addresses thoughts, feelings, and behaviors related to the way individuals interact with and relate to smartphones and social networks, which lead to detrimental consequences at both individual and social levels. The scale comprises 18 items, each rated on a 7-point Likert scale from 1 (“Strongly disagree”) to 7 (“Strongly agree”). Higher scores on this scale denote a greater level of impact on both individual and social aspects resulting from the problematic use of smartphones and social networks.
The Depression, Anxiety, and Stress Scale (DASS-21;52 Spanish version by Daza et al53) assesses anxiety, depression, and stress symptoms. It includes 21 items across three dimensions, using a 4-point Likert scale from 0 (“Did not apply to me at all”) to 3 (“Applied to me very much, or most of the time”). Higher scores indicate more severe symptoms. The scale’s internal consistency was good in this study (α = 0.84 for depression, 0.89 for anxiety, 0.89 for stress).
The Wong and Law Emotional Intelligence Scale (WLEIS;54 Spanish translation by Extremera et al55 evaluates perceived emotional ability. Although the instrument measures four dimensions (self-emotional appraisal, others’ emotional appraisal, use of emotion, and regulation of emotion), for the purposes of this study, we used the overall score. The 16-item scale is rated on a 7-point Likert scale from 1 (“Strongly disagree”) to 7 (“Strongly agree”). Higher scores suggest better emotional intelligence, with adequate internal consistency (α = 0.89).
The Irrational Procrastination Scale (IPS;56 Spanish version by Guilera et al57) measures the tendency to irrationally delay tasks. Comprising nine items, it uses a 5-point Likert scale from 1 (“Very seldom, or not true of me”) to 5 (“Very often true, or true of me”). Higher scores reflect greater procrastination, with high internal consistency in this study (α = 0.87).
Data Analysis
In this study, R version 4.3.0 (packages lavaan, semTools, semPlot, psych and QuantPsyc) was used for the purpose of performing descriptive statistical analysis, for the examination of the factor structure and reliability of the PSSNUS through the application of structural equation modeling (SEM), for the exploration of mean differences by gender in the PSSNUS, and for assessing both convergent/divergent and incremental validity.
Prior to the SEM analysis, the adoption of the WLSMV estimation method, particularly recommended for categorical items, made it unnecessary to validate the assumption of multivariate normality. This method is known for providing estimators that remain robust in the face of such assumption violations, which are rather typical in the social sciences.58 Additionally, the online survey format, mandating answers to all items, ensured there were no missing values, thereby bypassing the need for an investigation into missing data patterns.
A confirmatory factor analysis (CFA) was conducted to ascertain the factorial structure, following the EFA from Study 3 that suggested a five-factor correlated model. Alternative factorial configurations were also considered: a second-order structure where the five initial factors were integrated into one overarching general factor; and a bifactor model with five specific, non-correlated factors, plus a general factor where items from all five factors concurrently loaded. Furthermore, despite previous EFA results not indicating a unidimensional scale, we included a one-factor model in our analysis to exclude the possibility that all dimensions/aspects of problematic smartphone use measure a single construct. The fit of each model was determined using established criteria: the Chi-square (χ2) statistic, the CFI, the TLI, the Standardized Root Mean Square Residual (SRMR), and the RMSEA with its 90% CI. The cutoff points for good model fit were set as χ2 p-value ≥ 0.05, CFI ≥ 0.95, TLI ≥ 0.95, SRMR ≤ 0.08 and RMSEA ≤ 0.06, in line with the recommendations of Hu and Bentler.51 Concurrently, the local adjustment of the factor structure with the best fit was examined using the standardized factor loadings (λ) and the reliability of individual items (R2). According to Hair et al,42 λ values of ≥ 0.70 and ≥ 0.50, and R2 values of ≥ 0.50 and ≥ 0.25, signify good and acceptable levels of local fit, respectively.
The internal consistency of either the entire scale or its individual subscales were determined by employing both the alpha (α) coefficient and methods grounded in confirmatory factor analysis, such as the omega (ω) coefficient. The advantage of the latter, as Garson58 points out, lies in its resilience to the effects of item quantity and heterogeneity, making it especially suitable for studies utilizing SEM approaches. Scores above 0.70 in both ω and α are considered indicative of adequate reliability of the scale or its factors.59,60
Following this, differences in PSSNUS scores across gender were investigated through t-tests (as there were no non-binary participants in Study 5, comparisons were conducted solely between male and female). Independence of observations, guaranteed by the study design, was followed by verification of the normality assumption through skewness and kurtosis values, Q-Q plots, and scatter plots. The homogeneity of variances assumption was tested using Levene’s test (in the case that this assumption is not met, Welch’s correction will be applied). To assess the significance of these potential disparities, Cohen’s d was calculated, with values of 0.20, 0.50, and 0.80 representing small, medium, and large effect sizes, respectively.61
Bivariate correlations were performed between PSSNUS scores and those variables (ie, daily smartphone usage, procrastination, emotional intelligence and symptoms of anxiety, depression, and stress) that could potentially be theoretically linked with problematic smartphone and social networking sites use. Campbell and Fiske observe that correlations which significantly deviate from zero and are of considerable magnitude, even without defining precise cut-off points, suggest the presence of convergent validity.62 For discriminant validity, correlations exceeding 0.90 indicate challenges in distinguishing between variables or dimensions within a construct.63 Thus, Kline’s suggested cut-off point of 0.90 was employed in this study.60
As a concluding step, multiple linear regression analyses were carried out to assess incremental validity. This involved investigating the independent associations between the dimensions of problematic smartphone use and the psychological symptoms of anxiety, depression, and stress, taking into account additional factors known to have a substantial impact on such outcomes.64 In particular, we accounted for the potential impact of sociodemographic factors like gender and age, alongside the duration of daily device usage and the level of emotional intelligence of the individual.
Results for Study 5
Upon examining the results of the CFA (see, Table 3), it is evident that the one-factor model showed poor fit, suggesting that a single factor may not adequately represent the data structure. In contrast, the five-factor correlated model, including the factors we have labeled as Psychological dependence (PD), Online interaction preference (OIP), Digital recognition desire (DRD), Social networks control seeking (SNCS), and Productivity loss (PL), exhibited excellent fit, achieving an RMSEA and SRMR values close to zero and CFI and TLI values close to unity, which are indicative of a robust model. The five-factor second-order and bifactor models also demonstrate good fit, although they do not surpass the five-factor correlated model in fit quality. Despite the significant chi-square statistics across all models, which may be attributed to the large sample size,58 these results highlight the five-factor correlated model as the best representation of the underlying factor structure, which is further supported by its satisfactory local fit (see, Figure 1). The item wording and descriptive statistics for each factor in the scale’s final version are in Table 4. Detailed conceptualization of these factors, in the context of the broader problematic smartphone use literature, will follow in the next section.
The reliability analysis for our scale revealed notable consistency across its five factors. Factor 1 (PD), comprised of four items, displayed α = 0.86 and ω = 0.83, indicating strong reliability. Factor 2 (OIP), also four items, showed α = 0.78 and ω = 0.75, for satisfactory consistency. Factor 3 (DRD), consisting of three items, had α = 0.87 and ω = 0.83, demonstrating excellent internal consistency. Factor 4 (SNCS), with three items, displayed α = 0.76 and ω = 0.70, reflecting acceptable reliability. Factor 5 (PL), including four items, presented α = 0.91 and ω = 0.89, the highest reliability. The overall scale, encompassing all 18 items, exhibited α = 0.89 and ω = 0.93, confirming its robust reliability.
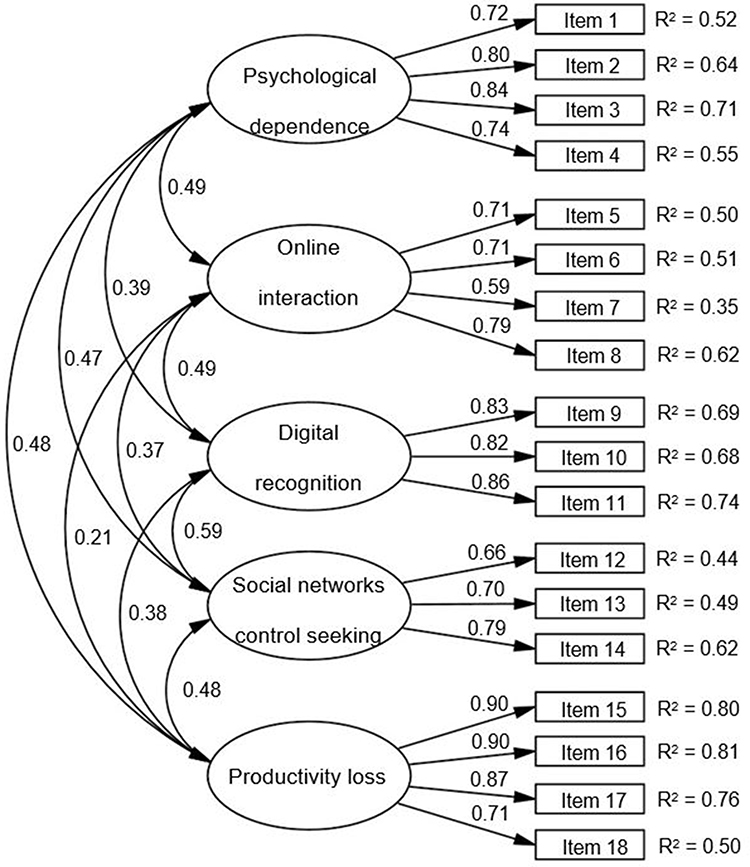 |
Figure 1 Factor loadings, R2 values, and correlations of the five-factor model. |
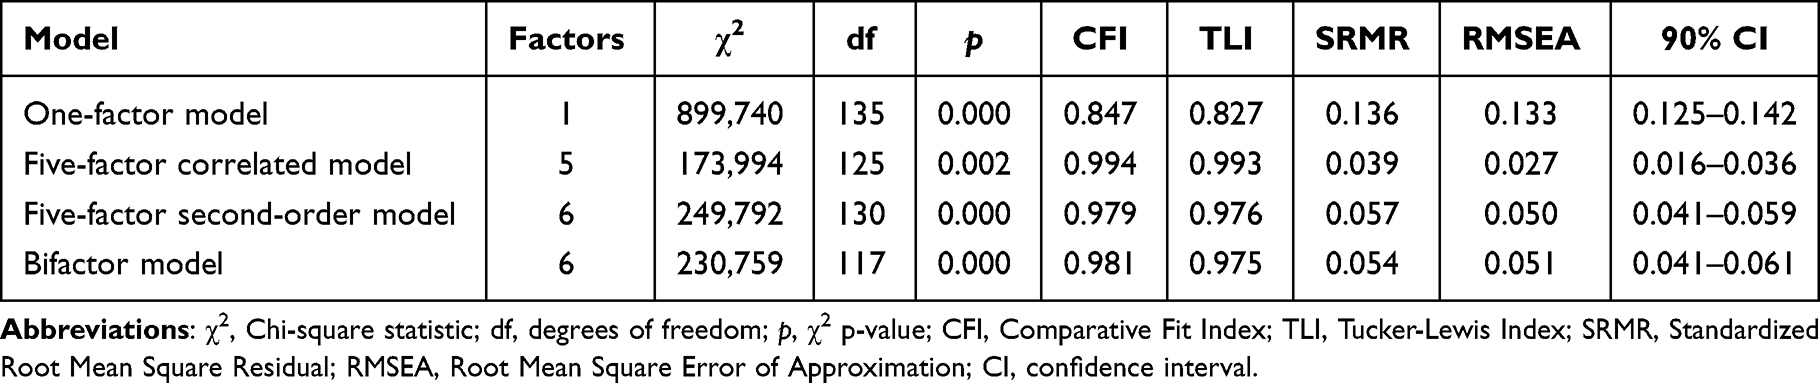 |
Table 3 Model Fit Comparison for Different PSSNUS Configurations (n = 355) |
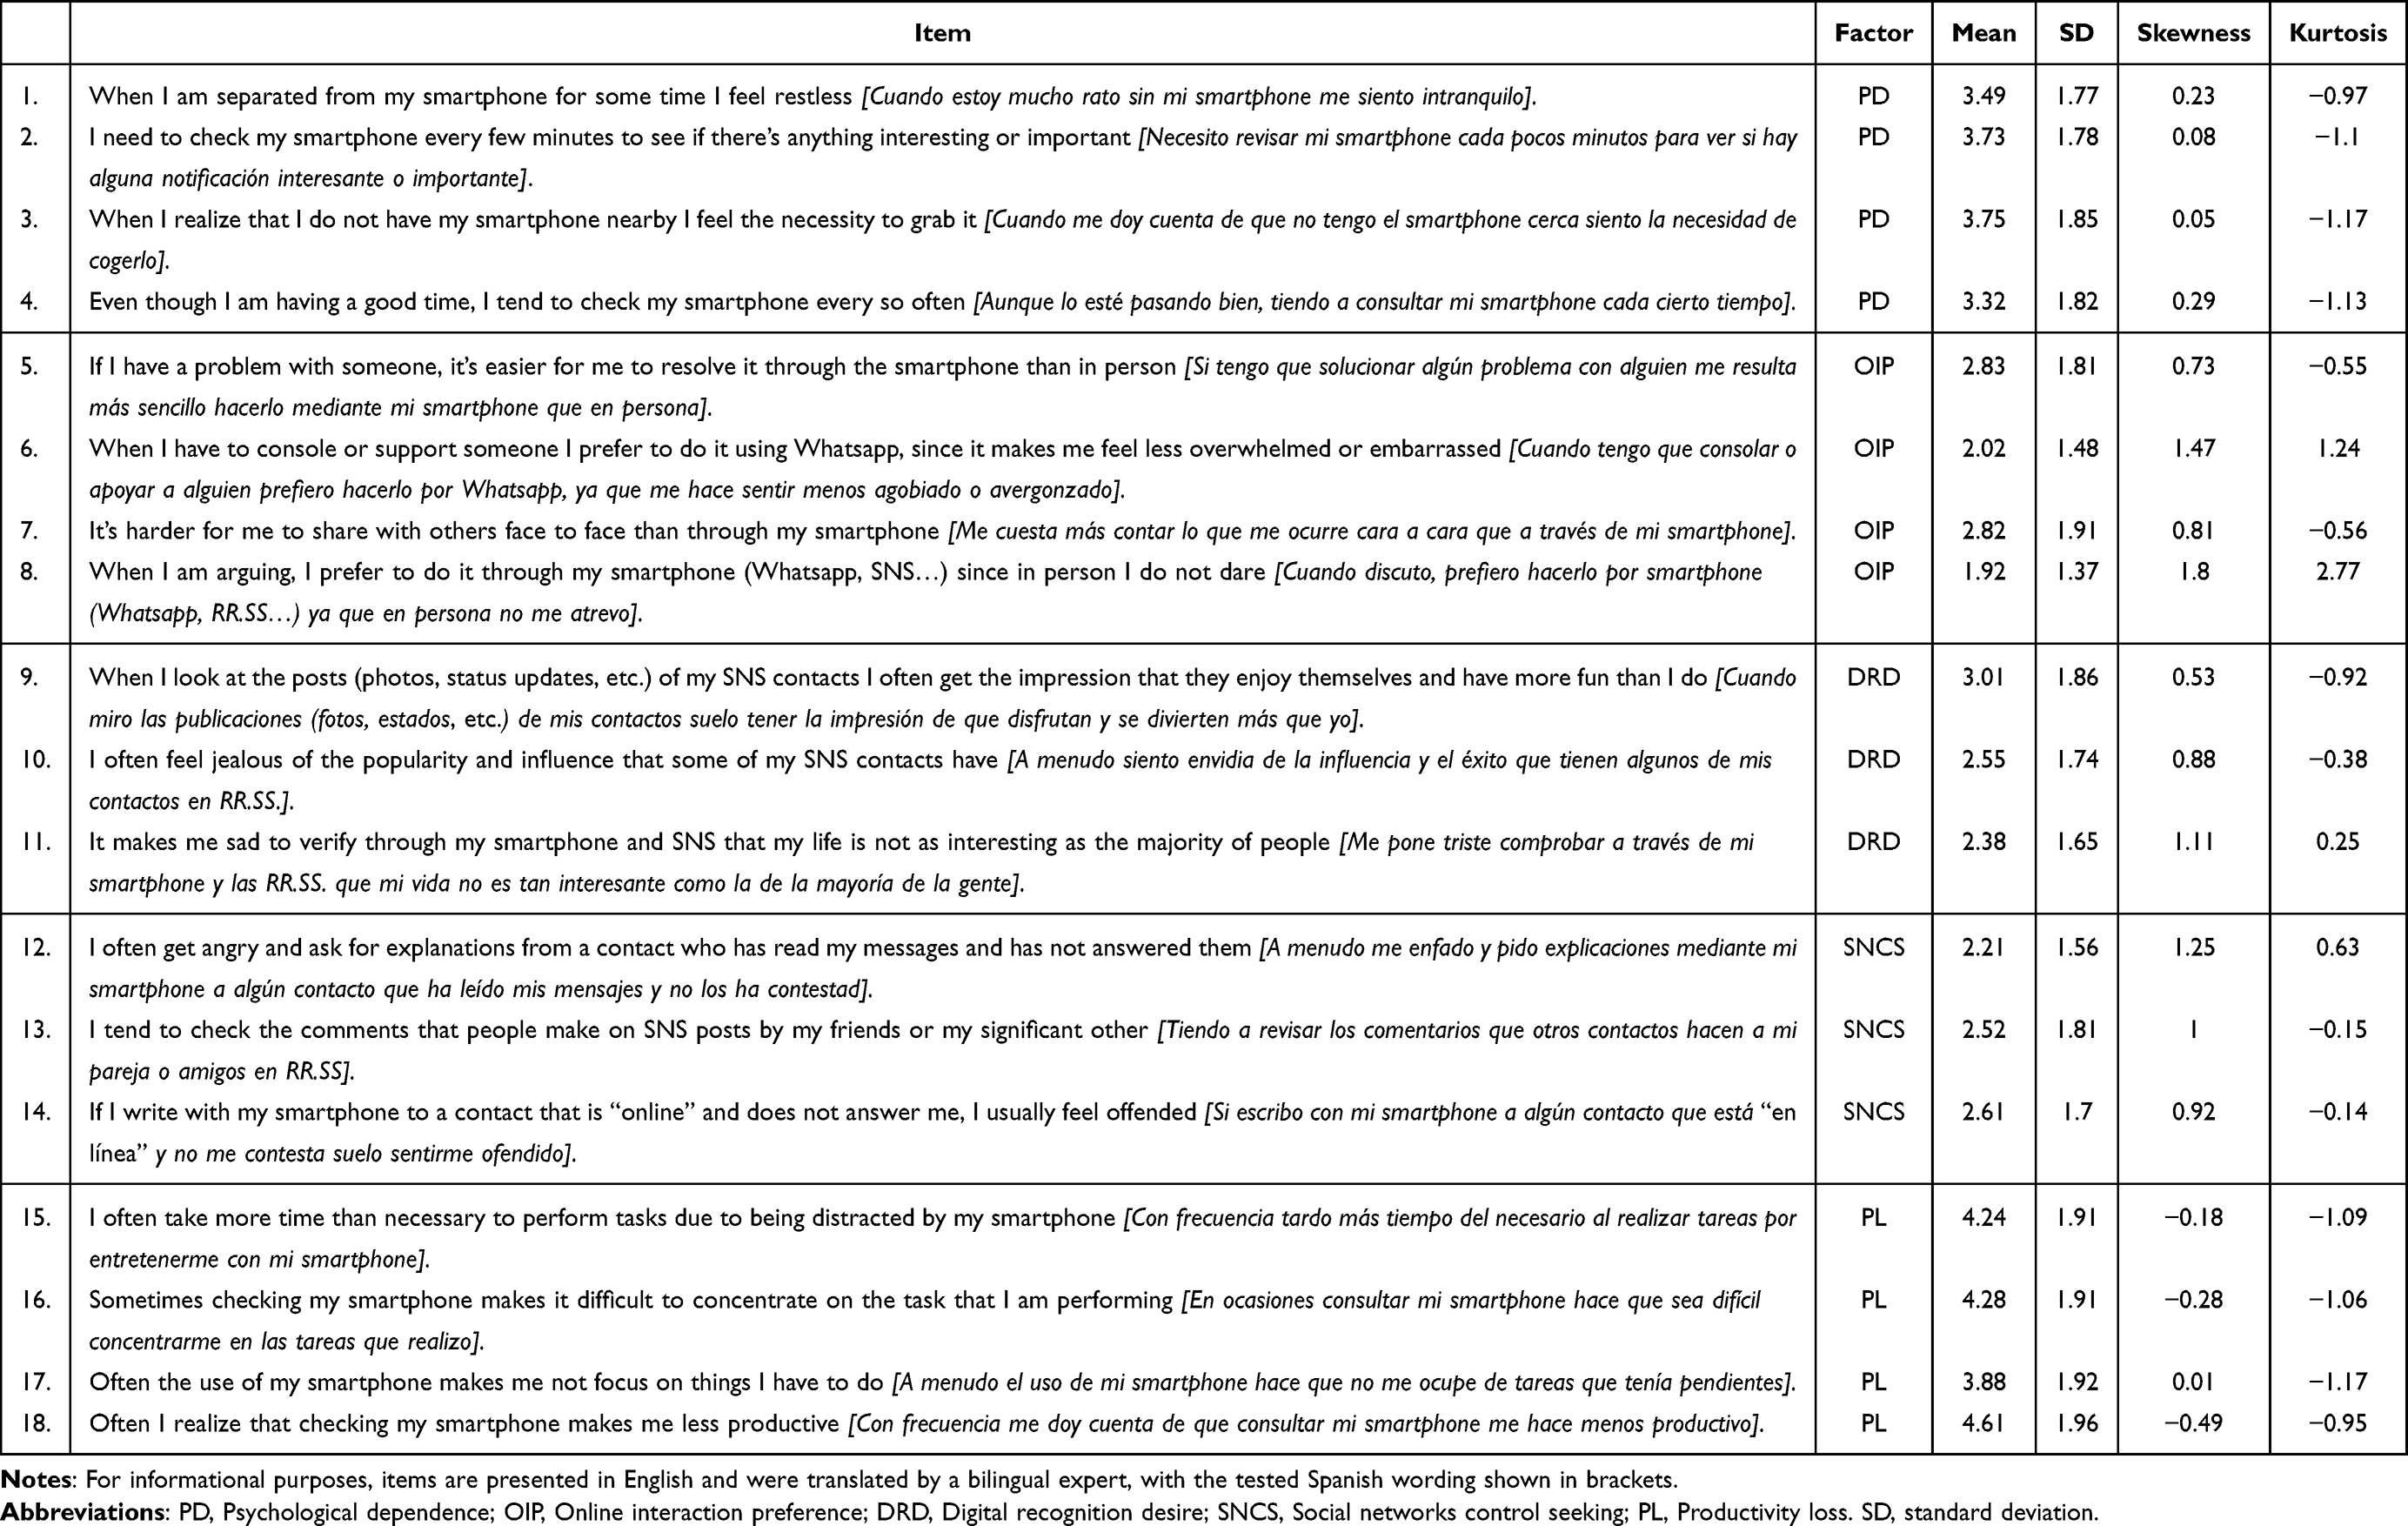 |
Table 4 Final PSSNUS Items and Their Descriptive Statistics from Study 5 (n = 355) |
Prior to the group comparison analysis, the assumptions of independence of observations and normality were ensured. The assumption of homogeneity of variances was tested and, where it was not satisfied in the DRD and PL dimensions, Welch’s correction was applied. The analysis of the PSSNUS shows small but significant gender differences in both the DRD factor and in the overall score (see, Table 5). In the DRD dimension, females score higher than males, with an effect size of small magnitude (d = −0.31), indicating a greater tendency to envy the success and recognition received by others in social networks among this group. The overall PSSNUS score also demonstrates a small gender difference (d = −0.23), with females scoring higher than males, suggesting a modestly higher general propensity for problematic smartphone use among the female participants.
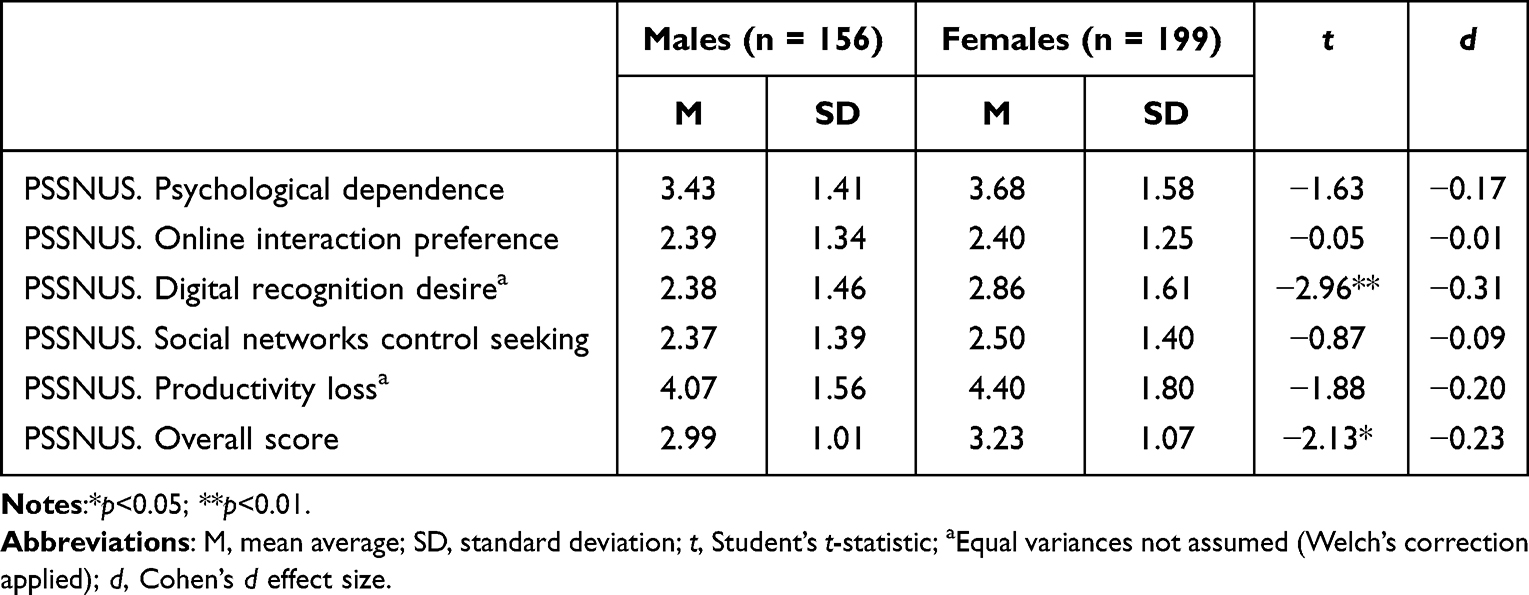 |
Table 5 Group Comparisons in PSSNUS Scores by Gender (n = 355) |
Concerning convergent and divergent validity, both the overall score and the individual dimensions of the instrument displayed significant correlations with the variables studied (see, Table 6). Specifically, the PSSNUS scale shows that the dimensions, especially PD, are moderately but distinctly correlated with daily smartphone usage. The PL dimension aligns closely with procrastination behaviors. Negative correlations with emotional intelligence are most pronounced in the OIP and DRD dimensions. While all dimensions of the scale exhibited significant correlations, the DRD dimension consistently showed the closest association with symptoms of anxiety, depression, and stress. Within the PSSNUS scale dimensions, correlations were all statistically significant and predominantly of moderate strength, reflecting meaningful but not excessive associations among the various aspects of problematic smartphone use.
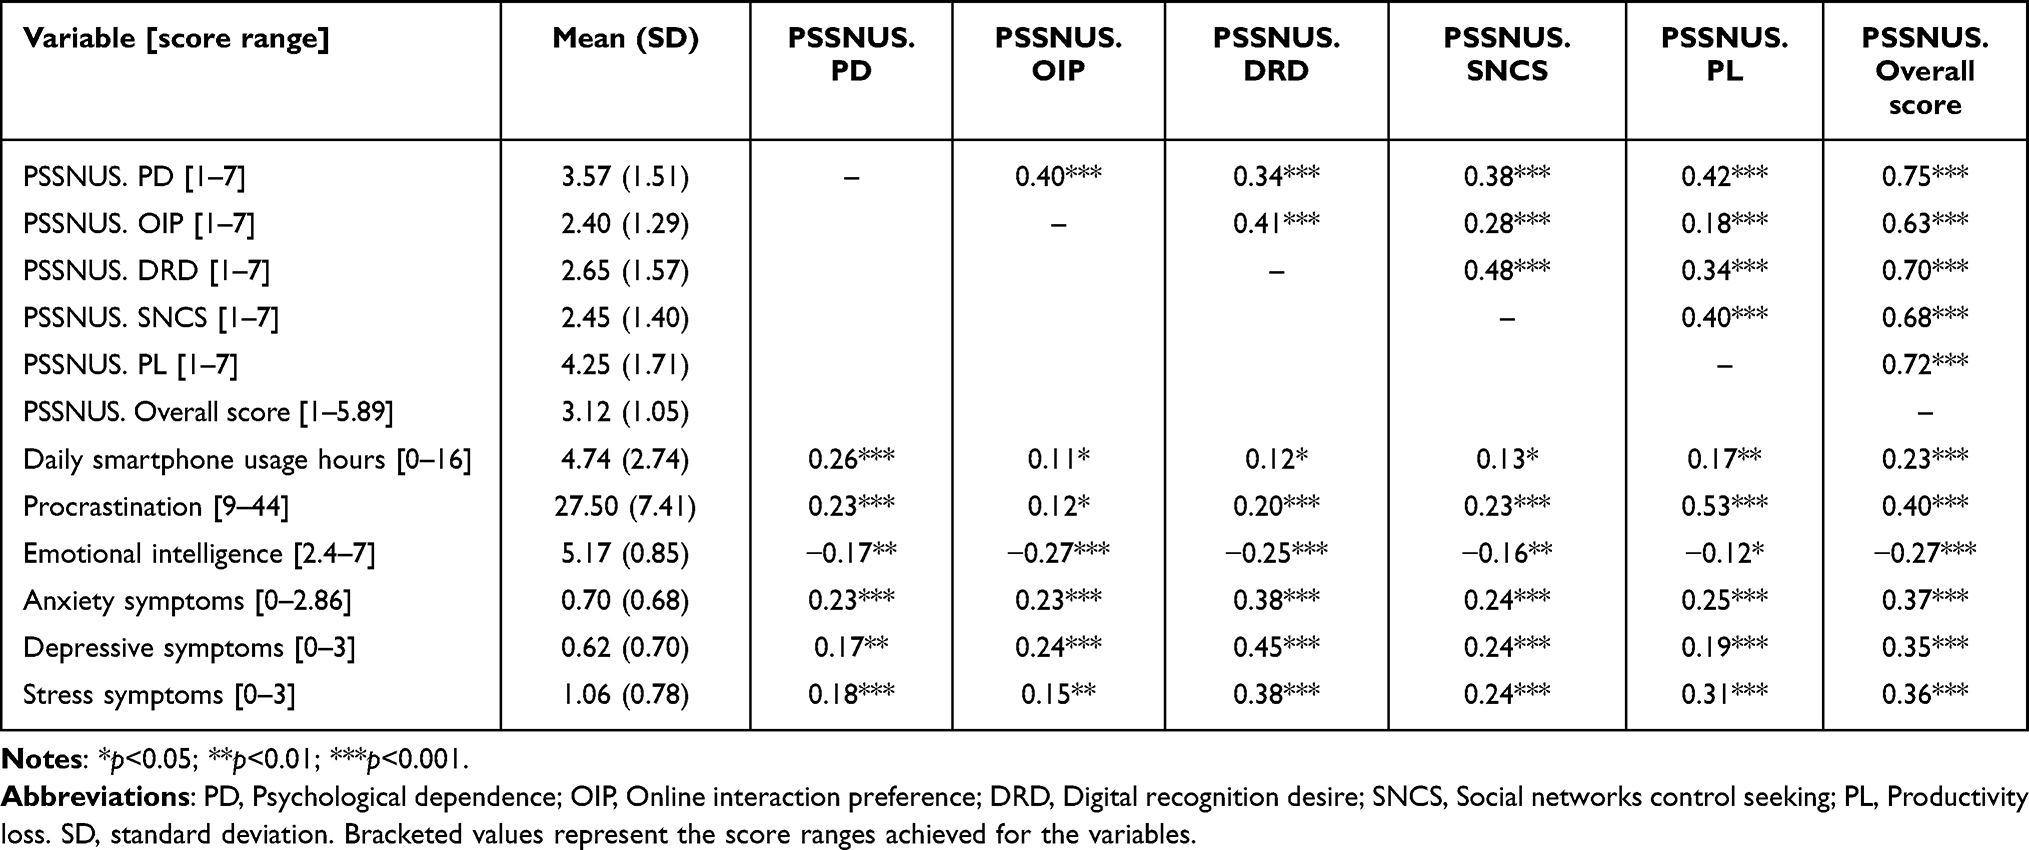 |
Table 6 Descriptive Statistics and PSSNUS Correlations with Smartphone Usage, Procrastination, Emotional Intelligence, and Mental Health Symptomatology (n = 355) |
Multiple linear regression analyses were conducted to assess the incremental validity of the PSSNUS dimensions regarding psychological symptoms of anxiety, depression, and stress after controlling for potential influences of sociodemographic factors, daily smartphone use hours, and emotional intelligence levels (see, Table 7). Overall, the most comprehensive model (model 4), which included all explored variables as predictors, accounted for 21.7%, 28.2%, and 23.9% of the variance in symptoms of anxiety, depression, and stress, respectively. With regard exclusively to the PSSNUS dimensions, they jointly explained an additional variance—beyond sociodemographic variables, daily smartphone usage, and emotional intelligence—of 6.5%, 11.5%, and 7.5% for the symptoms of anxiety, depression, and stress, respectively. Specifically, amidst the negligible predictive relevance of daily hours of smartphone usage, the DRD dimension stood out as the only factor independently related to symptoms of anxiety and depression; whereas for the outcome variable stress symptomatology, DRD and PL were the dimensions that made a unique predictive contribution. Therefore, upon examining model 4, it became evident that DRD was the dimension most robustly connected to all three symptom categories, surpassing even the predictive influence of emotional intelligence. These findings highlight the substantial role of the PSSNUS dimensions in elucidating the complexity of psychological symptoms associated with problematic smartphone use.
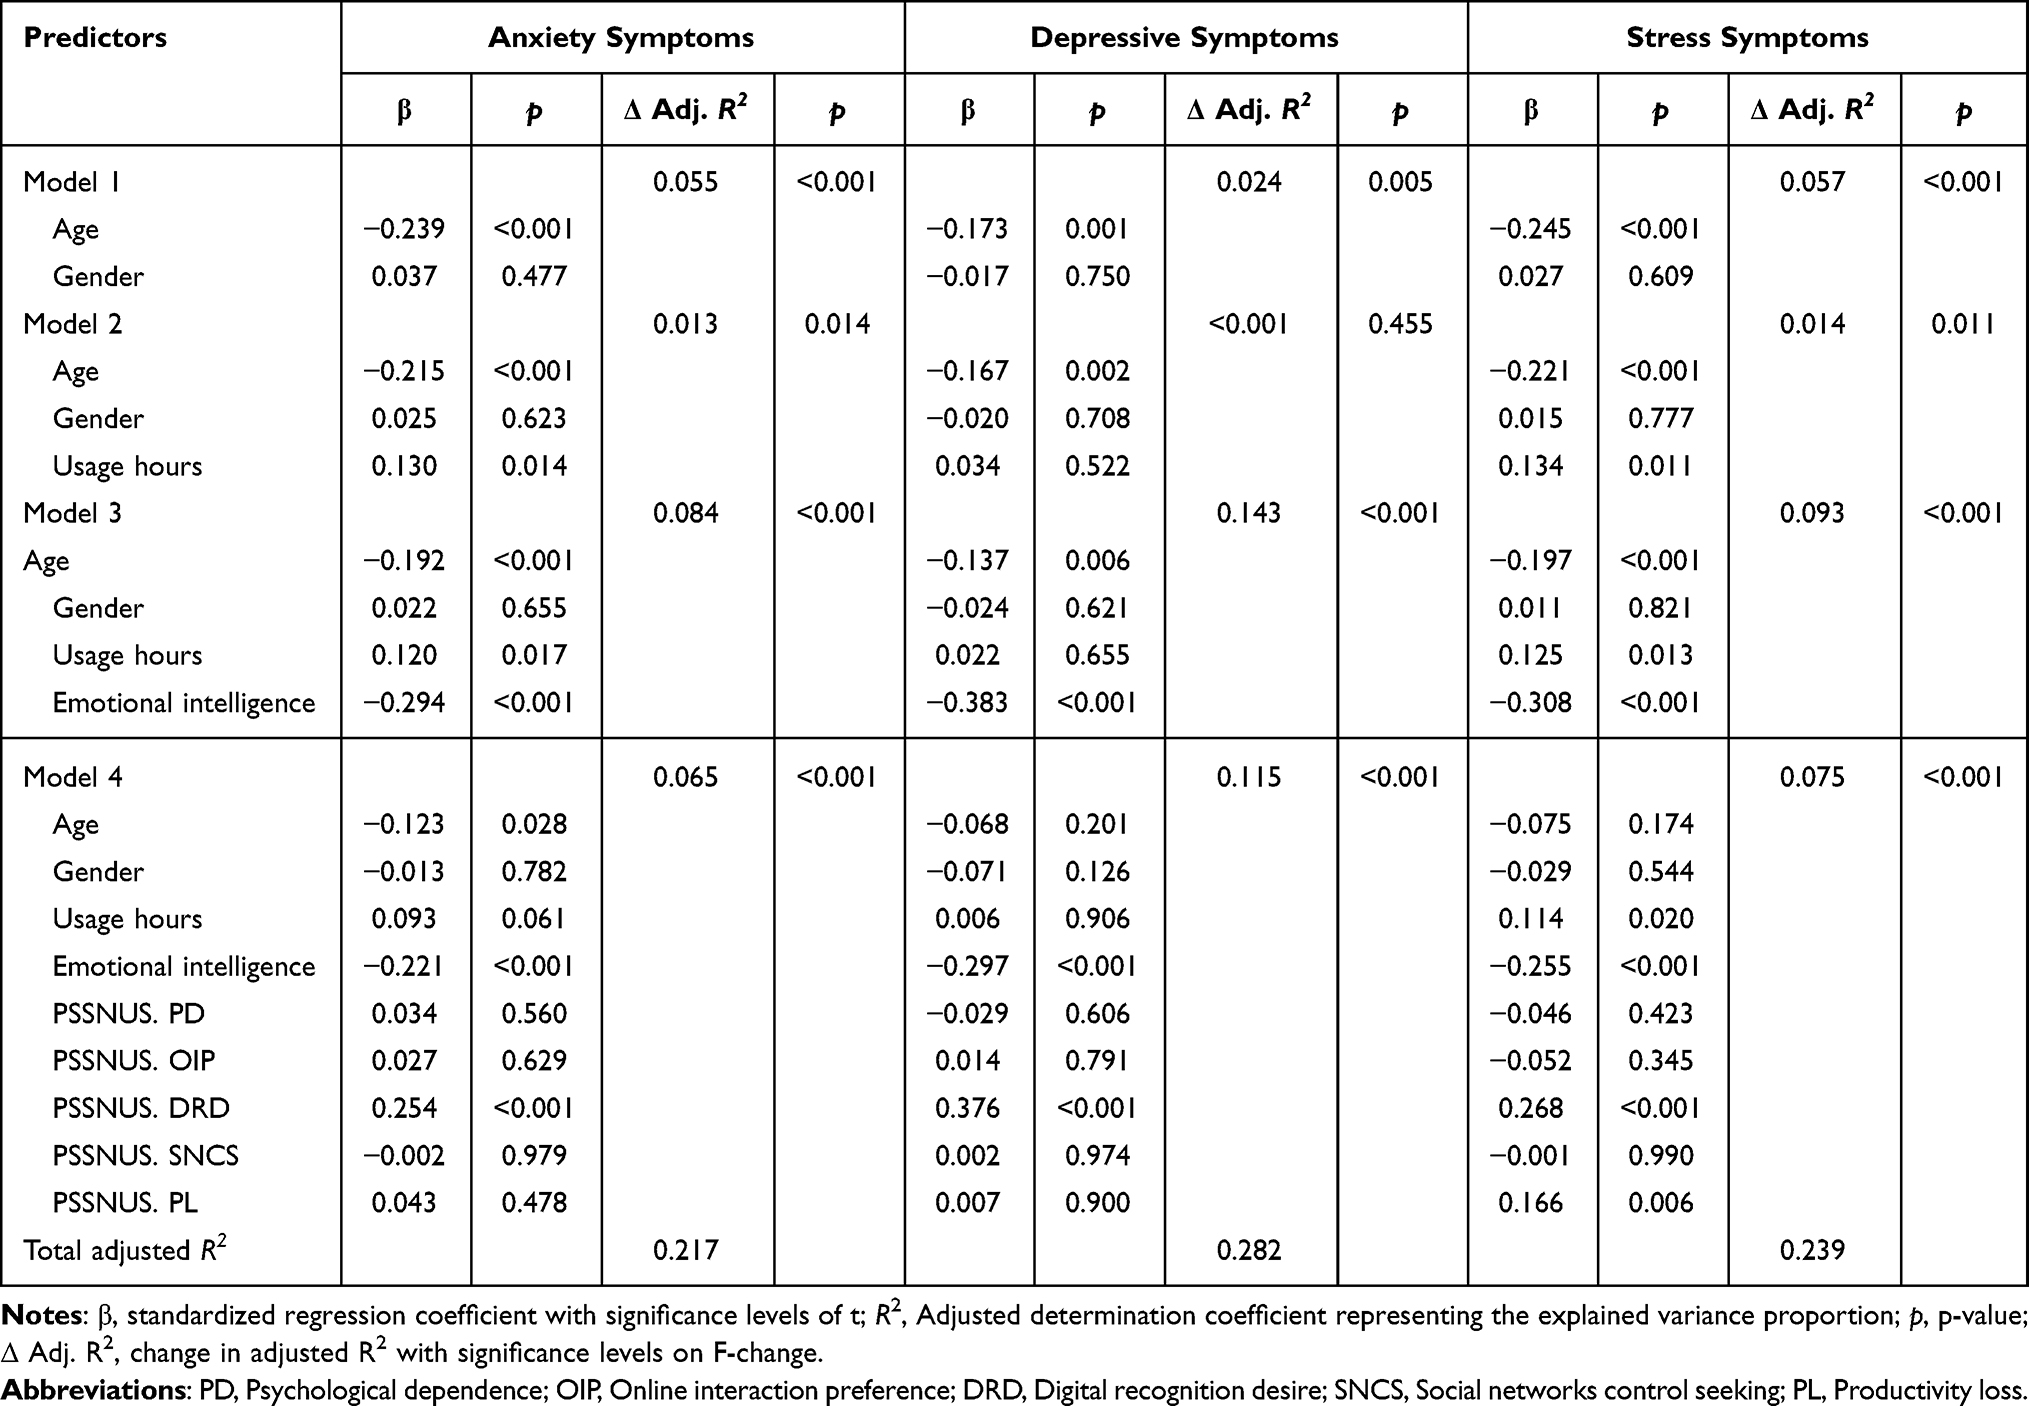 |
Table 7 Multiple Linear Regression of the Independent Associations of the PSSNUS Dimensions with the Symptoms of Anxiety, Depression, and Stress (n = 355) |
Discussion
The objective of the present research was to create and evaluate the psychometric properties of a brief and comprehensive self-assessment tool, crafted for Spanish-speaking individuals, to assess detrimental patterns of smartphone and social media usage that affect the user’s personal life and social interactions. The PSSNUS scale was developed to fit within the specific cultural setting of Spain, in order to prevent mistranslation and address the challenges of culturally adapting psychological assessment instruments,38 thus ensuring its cultural relevance and accuracy. Beyond focusing on smartphone usage patterns that negatively impact not only individual but also social functioning, another innovative and uncommon aspect of this research is the application of a mixed methodology. This approach combines traditional quantitative studies with less frequent qualitative studies, such as focus groups, cognitive debriefing and expert panels. Therefore, the novelty lies in the inclusion of qualitative analysis in the development, selection and refinement of the PSSNUS items. The performed procedure involves focus group interviews conducted to explore patterns of smartphone and social network usage trends that young people felt were harmful on both an individual and a social level. This method has proven exceptionally informative in health research,65 ensuring content validity through adherence to established guidelines.66
The findings from Study 1 and 2, both of a qualitative nature, revealed that the initial versions of the tool (consisting of 58 and 30 items, respectively) demonstrated their authenticity and accuracy in reflecting the intended construct, with items showing appropriate relevance and comprehensibility. Results from the Exploratory Factor Analysis (EFA) performed in Study 3 indicated that the preliminary 20-item version of the PSSNUS captured a four-factor structure of problematic smartphone and social networking sites use. Additionally, it evidenced its conceptual association and differentiation with variables such as internet addiction or daily device usage hours. Furthermore, in light of the considerable consensus among the experts’ analysis in Study 4, we opted to discard six items from the scale and, heeding the suggestions of two experts, added four items concerning the loss of productivity. Consequently, the findings from Study 4 have resulted in a final PSSNUS version with 18 items, indicating a potentially robust measure.
Upon conducting Study 5, the results of the CFA were in alignment with those from the EFA (except for the new dimension added at the panel of experts’ recommendation), supporting construct validity. Despite the various configurations tested, it was the five-factor correlated model that proved to be most plausible, reflecting an optimal fit and a notable reliability (ie, internal consistency). This is particularly relevant considering the varied factorial structures seen in the questionnaires previously reviewed for this study, from a unifactorial (MPPUS35) to a six-factor approach (CPDQ34). Moreover, while the addiction elements such as loss of control, reliance, tolerance, and withdrawal syndrome play a central role in some scales (SAS,9 TMP,10 ATeMo11), the PSSNUS scale offers a more holistic approach by addressing different facets or domains that influence user functioning (both individually and socially) and indicate problematic use. This perspective enhances our understanding of this phenomenon, beyond the scope of addiction and individual discomfort.
The PSSNUS revealed five distinct factors: 1) Psychological dependence (PD), which encompasses an individual’s compelling need to have the smartphone close at hand and to frequently check it, experiencing discomfort when not using the device. This dimension is possibly the most commonly reported among other multidimensional scales, with instruments such as the SAS,9 its Spanish abbreviated version,37 the ATeMo,11 the CPDQ,34 and the Spanish version of the MMPUS67 evaluating very similar aspects. 2) Online interaction preference (OIP), reflecting a tendency to resolve conflicts and express emotions via digital means rather than in-person, to avoid the discomfort of face-to-face interactions. This factor exhibits parallels with a subscale from the original SAS9 version and, notably, with one of the SIS’s14 dimensions, both connected to the “social anxiety” concept, which has been linked to problematic usage.68 3) Digital recognition desire (DRD), highlighting a yearning for social recognition and a sense of inferiority when comparing one’s own life to the seemingly more successful and enjoyable lives presented by others on social networks. This dimension, which bears a resemblance to the “fear of missing out” concept (ie, the apprehension that others might be having rewarding experiences on social media platforms from which one is absent),69 remains unaddressed by existing measures of this phenomenon. Consistent with recent research that points out the crucial role of social comparison70 and social reinforcement71 in smartphone and social media usage dynamics, DRD underscores the psychosocial character of the PSSNUS. 4) Social networks control seeking (SNCS), which reflects an urge to monitor and influence how others interact with oneself and valued individuals on social networks, experiencing feelings of anger or offense when this control is not achieved. This component, indicative of a clearly maladaptive social interaction pattern, has not been captured by any prior measurement tools for this construct, highlighting the need for its examination in future research involving diverse samples. Along with the DRD dimension, this component supports the notion advocated by certain scholars12 that social functioning needs to be detrimentally impacted to acknowledge the existence of problematic smartphone and social media use. 5) Productivity loss (PL), denoting the impairment of task efficiency and concentration, resulting in delayed completion of assignments, stemming from regular smartphone use. Despite the presence of specific items in other scales that examine the interference with work and studies (as in the case of ATeMo11), utilization in inappropriate contexts (as seen with TMD10), or the difficulty to concentrate attributed to their usage (as with SAS9), no factor perfectly equivalent to the PL can be found in alternative instruments.
Concerning gender differences, females exhibited higher levels on the DRD factor and in the overall PSSNUS score. These findings align with previous literature, evidencing that females spend more time on social networks than males72,73 and are more inclined to use smartphones for social purposes.35 Adolescent girls and young women from various cultures have shown significantly higher problematic smartphone use than men,28,29 which could be due to their tendency to place more value on social interactions and their greater sensitivity to the oxytocin released during these interactions.74 In the Spanish population, using the TMD and ATeMo scales, it has been observed that females make more excessive use of the device. However, in terms of the constitutive dimensions of these instruments, it has not been found that they exhibit a higher level of dependence or addiction.10,11 Thus, it is noteworthy that the DRD dimension emphasizes the desire for social acceptance, illustrating the psychosocial component of our scale, which is almost absent in the rest of the instruments mentioned. The higher total PSSNUS scores among females might be attributed to the fact that three (OIP, DRD, and SNCS) out of the five dimensions are associated with an impact on social functioning. These findings, while showing only small effect sizes, offer meaningful insights into the gender-specific aspects of problematic smartphone and social network sites usage.
In considering the validity of the PSSNUS scale, the varying degrees of correlations among its five dimensions reflect a sophisticated measure capable of differentiating unique facets of problematic use (without collinearity signs between them), highlighting their differential contribution to the overall construct. Consistent with the findings from Study 4, which indicated that the preliminary version of the scale (20 items across 4 factors) represented a construct concurrently linked to, yet distinct from, internet addiction (not measured in Study 5), the moderately low correlations between the five factors of the PSSNUS’s final version and daily usage hours indicate that problematic smartphone and social networking use is a construct that extends beyond mere overuse, as evidenced by other multidimensional instruments evaluating this phenomenon.14 Supported by meta-analytic evidence,75 the PSSNUS also proved to assess a phenomenon distinct from an individual’s level of procrastination, with PL emerging as the factor most strongly associated with this maladaptive variable (as device use diminishes concentration, leading to delays and postponements). Additionally, consistent with prior research, the PSSNUS exhibited concurrent validity in relation to anxious, depressive, and stress symptoms14,23–31,67,76 (with the DRD factor exhibiting closer associations) and to the level of emotional intelligence77,78 (with the OIP factor having stronger correlations). When examining the strength of associations between the PSSNUS dimensions and mental health variables, our results differ slightly from those obtained with other multidimensional tools.14 Unlike Pancani,14 the closest associations for anxiety, depression, and stress were not with the OIP dimension (“smartphone-mediated communication” as per such authors) but with the DRD dimension. This could be because in certain contexts, such as when in-person interactions are unfeasible or social relationships are strong, this aspect might be even positive.79 Moreover, the PSSNUS assesses other problematic use dimensions not covered in Pancani’s study,14 which may be more detrimental to mental health.
Acknowledging that an increased quantity/duration of smartphone usage does not inherently signify problematic use,26 and considering that review and meta-analyses studies have shown that both variables related to smartphones and social network sites constitute a risk factor for mental health,26,80 this research also explored the predictive power of the PSSNUS dimensions regarding symptoms of anxiety, depression, and stress. This was conducted considering potential influences of gender, age, and device usage hours; as well as controlling for emotional intelligence level, which has been found to influence these three types of symptoms.81 Consistent with previous studies,23–25,27,29 the findings demonstrated the incremental validity of our instrument, explaining significant percentages of additional variance beyond the previously mentioned variables. Specifically, when all PSSNUS dimensions were simultaneously considered, the DRD factor emerged as the sole predictor of these distress markers. Although some longitudinal research have argued that problematic use of this technology is responsible for mental health symptoms rather than the reverse,82 researchers who have analyzed accumulated evidence through meta-analyses favor a less simplistic explanation.80 It is plausible that individuals with anxious-depressive symptoms are more prone to problematic smartphone and social media use as a form of maladaptive coping, which exacerbates their psychological distress.27,80 Several mechanisms have been proposed to explain how these maladaptive usage patterns affect mental health. One possibility is that problematic smartphone and social media use disrupts and reduces users’ sleep (especially when exposed to screen light at night, which reduces melatonin), leading to increased psychological distress.27,30 Another hypothesis is that the activation of dopaminergic reward circuits through smartphone and social media use promotes dysfunctional social monitoring, leading to depression and anxiety due to social comparison.80,83 This supports the finding that the DRD dimension has shown the most detrimental effect on anxiety, depression, and stress levels. Altogether, these results suggest that the mental health of young Spaniards is influenced not only by demographic characteristics, emotional skills, or the amount of device usage but also by their specific patterns of use, particularly those aspects of this phenomenon that specifically affect the individual’s social sphere.
This study faces several limitations, including the reliance on a non-representative convenience sample of Spanish young adults, introducing potential self-selection bias and limiting the generalizability of our findings across different populations. Moreover, while subjective experience is pivotal in psychological phenomena,84 the reliance on self-reported measures may lead to social desirability biases. Notably, despite its comprehensive nature, the PSSNUS did not cover all facets of problematic smartphone use, such as the use of the smartphone to regulate emotions, online gambling, or the awareness of smartphone negative impact.14 Finally, the study’s cross-sectional nature and the omission of test-retest reliability and measurement invariance analysis subtly temper the robustness of our findings, suggesting fruitful avenues for further research to address these considerations. Future research should consider conducting longitudinal studies to examine the stability and causal relationships of problematic smartphone use. Testing the scale in more diverse populations, including different age groups, cultural backgrounds, and translations into other languages, could enhance the generalizability of the findings. Additionally, exploring new dimensions of problematic smartphone use would further enrich the understanding of this complex phenomenon.
Highlighting its strengths, the PSSNUS facilitates a prompt and exhaustive evaluation of this construct, focusing on problematic use beyond mere addiction or dependence, and considering both individual and social impacts, as advocated by Pancani.14 Our work is distinguished by a thorough validation process that adheres to guidelines provided by methodologically rigorous publications,40,45,46,85 encompassing five different studies utilizing a mixed-methods approach. The qualitative phase was essential in ensuring the relevance and comprehensibility of the scale’s items by enabling young users to identify and elaborate on specific problematic aspects. Focus groups, an uncommon practice, revealed not only dependency but also interpersonal factors (especially the DRD and SNCS dimensions, along with OIP) that were previously overlooked but are evidently maladaptive, significantly enhancing the content validity by capturing real-world experiences. Not relying exclusively on the literature on technological addictions represents a key difference from previously available instruments in Spanish,10,11,36,37 allowing us to broaden the understanding of problematic smartphone and social networks use. The diverse quantitative methodology applied established the construct’s dimensions, refined the PSSNUS’s structure, and confirmed its validity regarding digital habits and mental health indicators, reinforcing its strong psychometric properties. The current results, demonstrating the utility of both dimensional and overall scores of the PSSNUS,36 supports its effectiveness as a comprehensive evaluative tool for the young Spanish population.
Conclusion
This research introduced the PSSNUS, a multidimensional scale to assess patterns of smartphone and social network sites use that adversely affect not only the personal but also the social functioning of young Spaniards. Its psychometric properties, ease of administration and predictive capacity regarding psychological distress variables position it as an interesting tool for researchers and professionals aiming to mitigate the negative impacts of digital media’s influence on youth well-being. Among the strengths of this research are its thorough validation process and the use of a mixed-methods approach to support the scale’s robustness. Limitations include the cross-sectional design and convenience sampling, which limit causal inferences and generalizability, and the inherent biases in self-report data, including the tendency for social desirability responses. Future research should aim to replicate these findings in more diverse populations and different languages, use longitudinal designs, and incorporate objective usage data to enhance understanding of problematic smartphone and social network use across different contexts.
Ethical Statement
The Ethics Committee of the Francisco de Vitoria University (reference code: 08/2018), which is affiliated with the corresponding author’s institution, granted approval for this research, ensuring adherence to the Declaration of Helsinki principles for all materials and methods used.
Acknowledgments
Our heartfelt appreciation is extended to the expert psychologists for enhancing our research instrument, and to the participants, for their vital contributions to the study.
Funding
The study received financial support from Universidad Francisco de Vitoria, as part of the project UFV2024-19. The funders had no involvement in the design of the study, gathering or analysis of data, decision on publication, or the manuscript’s development.
Disclosure
The authors report no conflicts of interest in this work.
References
1. Horvath J, Mundinger C, Schmitgen MM, et al. Structural and functional correlates of smartphone addiction. Addict Behav. 2020;105:106334. doi:10.1016/j.addbeh.2020.106334
2. Global System for Mobile Communications Association. The Mobile Economy 2022; 2022.
3. Liu H, Zhou Z, Huang L, Zhu E, Yu L, Zhang M. Prevalence of smartphone addiction and its effects on subhealth and insomnia: a cross-sectional study among medical students. BMC Psychiatry. 2022;22(1):305. doi:10.1186/s12888-022-03956-6
4. Contreras-Rodríguez O, Albein-Urios N, Vilar-López R, et al. Increased corticolimbic connectivity in cocaine dependence versus pathological gambling is associated with drug severity and emotion-related impulsivity. Addict Biol. 2016;21(3):709–718. doi:10.1111/adb.12242
5. Walther B, Morgenstern M, Hanewinkel R. Co-occurrence of addictive behaviours: personality factors related to substance use, gambling and computer gaming. Eur Addict Res. 2012;18(4):167–174. doi:10.1159/000335662
6. Efrati Y, Mikulincer M. Individual-based compulsive sexual behavior scale: its development and importance in examining compulsive sexual behavior. J Sex Marital Ther. 2018;44(3):249–259. doi:10.1080/0092623X.2017.1405297
7. Müller SM, Wegmann E, García Arias M, Bernabéu Brotóns E, Marchena Giráldez C, Brand M. Deficits in executive functions but not in decision making under risk in individuals with problematic social-network use. Compr Psychiatry. 2021;106:152228. doi:10.1016/j.comppsych.2021.152228
8. Andreassen CS, Billieux J, Griffiths MD, et al. The relationship between addictive use of social media and video games and symptoms of psychiatric disorders: a large-scale cross-sectional study. Psychol Addict Behav. 2016;30(2):252–262. doi:10.1037/adb0000160
9. Kwon M, Lee J-Y, Won W-Y, et al. Development and validation of a smartphone addiction scale (SAS). PLoS One. 2013;8(2):e56936. doi:10.1371/journal.pone.0056936
10. Choliz M. Mobile-phone addiction in adolescence: the test of mobile phone dependence (TMD). Prog Heal Sci. 2012;2(1):33–44.
11. Olivencia-Carrión MA, Ramírez-Uclés I, Holgado-Tello P, López-Torrecillas F. Validation of a Spanish questionnaire on mobile phone abuse. Front Psychol. 2018;9:621. doi:10.3389/fpsyg.2018.00621
12. Billieux J, Philippot P, Schmid C, Maurage P, De Mol J, Van der Linden M. Is dysfunctional use of the mobile phone a behavioural addiction? Confronting symptom-based versus process-based approaches. Clin Psychol Psychother. 2015;22(5):460–468. doi:10.1002/cpp.1910
13. Canale N, Pancani L, Pivetta E, et al. Heterogeneity of smartphone impact on everyday life and its relationship with personality and psychopathology: a latent profile analysis. Compr Psychiatry. 2023;120:152356. doi:10.1016/j.comppsych.2022.152356
14. Pancani L, Preti E, Riva P. The psychology of smartphone: the development of the Smartphone Impact Scale (SIS). Assessment. 2020;27(6):1176–1197. doi:10.1177/1073191119831788
15. Gezgin DM, Hamutoglu NB, Sezen-Gultekin G, Ayas T. The relationship between nomophobia and loneliness among Turkish adolescents. Int J Res Educ Sci. 2018;4(2):358–374. doi:10.21890/ijres.409265
16. Billieux J. Problematic use of the mobile phone: a literature review and a pathways model. Curr Psychiatry Rev. 2012;8(4):299–307.
17. Jiang Q, Li Y, Shypenka V. Loneliness, individualism, and smartphone addiction among international students in China. Cyberpsychol Behav Soc Netw. 2018;21(11):711–718. doi:10.1089/cyber.2018.0115
18. Lin TTC, Chiang Y-H, Jiang Q. Sociable people beware? Investigating smartphone versus nonsmartphone dependency symptoms among young Singaporeans. Soc Behav Personal an Int J. 2015;43(7):1209–1216. doi:10.2224/sbp.2015.43.7.1209
19. Cerniglia L, Zoratto F, Cimino S, Laviola G, Ammaniti M, Adriani W. Internet addiction in adolescence: neurobiological, psychosocial and clinical issues. Neurosci Biobehav Rev. 2017;76:174–184. doi:10.1016/j.neubiorev.2016.12.024
20. Lewis M. Brain change in addiction as learning, not disease. N Engl J Med. 2018;379(16):1551–1560. doi:10.1056/NEJMra1602872
21. Lin H-M, Chang Y-T, Chen M-H, et al. Structural and functional neural correlates in individuals with excessive smartphone use: a systematic review and meta-analysis. Int J Environ Res Public Health. 2022;19(23):16277. doi:10.3390/ijerph192316277
22. Zeng X, Han X, Gao F, Sun Y, Yuan Z. Abnormal structural alterations and disrupted functional connectivity in behavioral addiction: a meta-analysis of VBM and fMRI studies. J Behav Addict. 2023;12(3):599–612. doi:10.1556/2006.2023.00025
23. Alhassan AA, Alqadhib EM, Taha NW, Alahmari RA, Salam M, Almutairi AF. The relationship between addiction to smartphone usage and depression among adults: a cross sectional study. BMC Psychiatry. 2018;18(1):148. doi:10.1186/s12888-018-1745-4
24. Demirci K, Akgönül M, Akpinar A. Relationship of smartphone use severity with sleep quality, depression, and anxiety in university students. J Behav Addict. 2015;4(2):85–92. doi:10.1556/2006.4.2015.010
25. Hossin MZ, Islam A, Billah M, Haque M, Uddin J. Is there a gradient in the association between internet addiction and health? PLoS One. 2022;17(3):e0264716. doi:10.1371/journal.pone.0264716
26. Thomée S. Mobile phone use and mental health. A review of the research that takes a psychological perspective on exposure. Int J Environ Res Public Health. 2018;15(12). doi:10.3390/ijerph15122692
27. Zhang C, Hao J, Liu Y, Cui J, Yu H. Associations between online learning, smartphone addiction problems, and psychological symptoms in Chinese college students after the COVID-19 pandemic. Front Public Health. 2022;10:881074. doi:10.3389/fpubh.2022.881074
28. AlQaderi N, Banibella Abdelmagied Elamin A, Yasser Abdelraouf Abdelmonem K, Teir HJ, Andrade G. Phone addiction, cyberbullying, and mental health amongst young adults in the United Arab Emirates: a cross-sectional study. BMC Psychol. 2023;11(1):313. doi:10.1186/s40359-023-01320-1
29. Lee M-S, Lee H. Problematic smartphone use and its relationship with anxiety and suicidal ideation among South Korean adolescents. Psychiatry Invest. 2023;20(9):843–852. doi:10.30773/pi.2023.0051
30. Gul H, Firat S, Sertcelik M, Gul A, Gurel Y, Kilic BG. Effects of psychiatric symptoms, age, and gender on fear of missing out (FoMO) and problematic smartphone use: a path analysis with clinical-based adolescent sample. Indian J Psychiatry. 2022;64(3):289–294. doi:10.4103/indianjpsychiatry.indianjpsychiatry_34_21
31. Long J, Liu Y, Wang Y, et al. The mediating effects of perceived family support in the relationship between anxiety and problematic smartphone use: a cross-cultural validation. J Nerv Ment Dis. 2024;212(2):76–83. doi:10.1097/NMD.0000000000001738
32. Cheng C, Lau Y-C. Social media addiction during COVID-19-mandated physical distancing: relatedness needs as motives. Int J Environ Res Public Health. 2022;19(8). doi:10.3390/ijerph19084621
33. Cuesta Cambra U, Cuesta Díaz V, Martínez Martínez L, Niño González JI. Smartphone: en comunicación, algo más que una adicción [Smartphone: more than an addiction in communication]. Rev Lat Comun Soc. 2020;75:367–381. doi:10.4185/RLCS-2020-1431
34. Toda M, Monden K, Kubo K, Morimoto K. Cellular phone dependence tendency of female university students. Nihon Eiseigaku Zasshi. 2004;59(4):383–386. doi:10.1265/jjh.59.383
35. Bianchi A, Phillips JG. Psychological predictors of problem mobile phone use. CyberPsychol Behav. 2005;8(1):39–51. doi:10.1089/cpb.2005.8.39
36. López-Fernández O, Honrubia-Serrano M, Freixa-Blanxart M. Adaptación española del “Mobile Phone Problem Use Scale” para población adolescente [Spanish adaptation of the “Mobile Phone Problem Use Scale” for adolescent population]. Adicciones. 2012;24(2):123–130. doi:10.20882/adicciones.104
37. Lopez-Fernandez O. Short version of the Smartphone Addiction Scale adapted to Spanish and French: towards a cross-cultural research in problematic mobile phone use. Addict Behav. 2017;64:275–280. doi:10.1016/j.addbeh.2015.11.013
38. Mikulic IM, Muiños R. La construcción y uso de instrumentos de evaluación en la investigación e intervención psicológica: el Inventario de Calidad de Vida percibida (ICV) [The construction and use of evaluation instruments in psychological research and intervention: the Perceived Quality of Life Inventory (ICV)]. Anu Investig. 2005;12:193–202.
39. Fernández-Rovira C. Motivaciones y tiempo de uso de las redes sociales por parte de los jóvenes españoles: señales de adicción [Motivations and time of social media use among Spanish youth: signs of addiction]. Anuar Electrón De Estud En Comunic Soc. 2022;15(2):1–19. doi:10.12804/revistas.urosario.edu.co/disertaciones/a.11155
40. Vogt DS, King DW, King LA. Focus groups in psychological assessment: enhancing content validity by consulting members of the target population. Psychological Assessment. 2004;16(3):231–243. doi:10.1037/1040-3590.16.3.231
41. Hinkin TR. A brief tutorial on the development of measures for use in survey questionnaires. Organ Res Methods. 1998;1(1):104–121. doi:10.1177/109442819800100106
42. Hair J, Black W, Babin B, Anderson R. Multivariate Data Analysis.
43. Calvo-Francés F. Internet Abusive Use Questionnaire: psychometric properties. Comput Human Behav. 2016;59:187–194. doi:10.1016/j.chb.2016.01.038
44. Westfall PH, Henning KSS. Understanding Advanced Statistical Methods. CRC Press; 2013; doi:10.1201/b14398
45. Lloret-Segura S, Ferreres-Traver A, Hernández-Baeza A, Tomás-Marco I. El análisis factorial exploratorio de los ítems: una guía práctica, revisada y actualizada [Exploratory factor analysis of items: a practical, revised, and updated guide]. An Psicol. 2014;30(3):1151–1169. doi:10.6018/analesps.30.3.199361
46. Goretzko D, Pham TTH, Bühner M. Exploratory factor analysis: current use, methodological developments and recommendations for good practice. Curr Psychol. 2021;40(7):3510–3521. doi:10.1007/s12144-019-00300-2
47. Horn J. Factors in factor analysis. Psychometrika. 1965;30(2):179–185.
48. Ruscio J, Roche B. Determining the number of factors to retain in an exploratory factor analysis using comparison data of known factorial structure. Psychol Assess. 2012;24(2):282–292. doi:10.1037/a0025697
49. Cattell RB. The scree test for the number of factors. Multivariate Behav Res. 1966;1(2):245–276. doi:10.1207/s15327906mbr0102_10
50. Worthington RL, Whittaker TA. Scale development research: a content analysis and recommendations for best practices. Couns Psychol. 2006;34(6):806–838. doi:10.1177/0011000006288127
51. Hu L, Bentler PM. Cutoff criteria for fit indexes in covariance structure analysis: conventional criteria versus new alternatives. Struct Equ Model a Multidiscip J. 1999;6(1):1–55. doi:10.1080/10705519909540118
52. Lovibond P, Lovibond S. The structure of negative emotional states: comparison of the Depression Anxiety Stress Scales (DASS) with the Beck Depression and Anxiety Inventories. Behav Res Ther. 1995;33(3):335–343. doi:10.1016/0005-7967(94)00075-u
53. Aponte-Daza VC, Ponce Valdivia F, Pinto Tapia B, Garcia F. Duelo anticipado y afrontamiento al estrés en cuidadores informales de personas de la tercera edad [Anticipatory grief and coping with stress in informal caregivers of elderly people]. Lib Rev Peru Psicol. 2022;28(2):e621. doi:10.24265/liberabit.2022.v28n2.621
54. Wong CS, Law KS. The effects of leader and follower emotional intelligence on performance and attitude: an exploratory study. Leadersh Q. 2002;13:243–274. doi:10.4324/9781315250601-10
55. Extremera N, Rey L, Sánchez-álvarez N. Validation of the Spanish version of the Wong law emotional intelligence scale (WLEIS-S). Psicothema. 2019;31(1):94–100. doi:10.7334/psicothema2018.147
56. Steel P. Arousal, avoidant and decisional procrastinators: do they exist? Pers Individ Dif. 2010;48(8):926–934. doi:10.1016/j.paid.2010.02.025
57. Guilera G, Barrios M, Penelo E, Morin C, Steel P, Gómez-Benito J. Validation of the Spanish version of the Irrational Procrastination Scale (IPS). PLoS One. 2018;13(1):1–11. doi:10.1371/journal.pone.0190806
58. Garson D. Structural Equation Modeling. Statistical Associates Publishers; 2012.
59. Chen F. Sensitivity of goodness of fit indexes to lack of measurement invariance. Struct Equ Model a Multidiscip J. 2007;14(3):464–504. doi:10.1080/10705510701301834
60. Kline RB. Principles and Practice of Structural Equation Modeling.
61. Cohen J. Statistical Power Analysis for the Behavioral Sciences.
62. Campbell DT, Fiske DW. Convergent and discriminant validation by the multitrait-multimethod matrix. Psychol Bull. 1959;56(2):81–105.
63. Rönkkö M, Cho E. An updated guideline for assessing discriminant validity. Organ Res Methods. 2022;25(1):6–14. doi:10.1177/1094428120968614
64. Haynes SN, Lench HC. Incremental validity of new clinical assessment measures. Psychol Assess. 2003;15(4):456–466. doi:10.1037/1040-3590.15.4.456
65. Hamui-Sutton A, Varela-Ruiz M. La técnica de grupos focales [The focus group technique]. Investig en Educ Médica. 2013;2(1):55–60. doi:10.1016/S2007-5057(13)72683-8
66. Muñiz J, Fonseca-Pedrero E. Ten steps for test development. Psicothema. 2019;31(1):7–16. doi:10.7334/psicothema2018.291
67. De-Sola J, Talledo H, Rubio G, de Fonseca FR. Psychological factors and alcohol use in problematic mobile phone use in the Spanish population. Front Psychiatry. 2017;8:1–11. doi:10.3389/fpsyt.2017.00011
68. Turgeman L, Hefner I, Bazon M, Yehoshua O, Weinstein A. Studies on the relationship between social anxiety and excessive smartphone use and on the effects of abstinence and sensation seeking on excessive smartphone use. Int J Environ Res Public Health. 2020;17(4). doi:10.3390/ijerph17041262
69. Elhai JD, Yang H, Montag C. Fear of missing out (FOMO): overview, theoretical underpinnings, and literature review on relations with severity of negative affectivity and problematic technology use. Brazilian J Psychiatry. 2021;43(2):203–209. doi:10.1590/1516-4446-2020-0870
70. Carraturo F, Di Perna T, Giannicola V, et al. Envy, social comparison, and depression on social networking sites: a systematic review. Eur J Investig Heal Psychol Educ. 2023;13(2):364–376. doi:10.3390/ejihpe13020027
71. Chang K, Li X, Zhang L, Zhang H. A double-edged impact of social smartphone use on smartphone addiction: a parallel mediation model. Front Psychol. 2022;13:1–10. doi:10.3389/fpsyg.2022.808192
72. Taywade A, Khubalkar R. Gender differences in smartphone usage patterns of adolescents. Int J Indian Psychol. 2019;7(4):509–515. doi:10.25215/0704.060
73. Chen B, Liu F, Ding S, Ying X, Wang L, Wen Y. Gender differences in factors associated with smartphone addiction: a cross-sectional study among medical college students. BMC Psychiatry. 2017;17(1):1–9. doi:10.1186/s12888-017-1503-z
74. Borland JM, Aiani LM, Norvelle A, et al. Sex-dependent regulation of social reward by oxytocin receptors in the ventral tegmental area. Neuropsychopharmacol. 2019;44(4):785–792. doi:10.1038/s41386-018-0262-y
75. Hidalgo-Fuentes S. Uso problemático del smartphone y procrastinación en el ámbito académico: un meta-análisis [Problematic smartphone use and procrastination in the academic field: a meta-analysis]. Electron J Res Educ Psychol. 2022;20(2):449–468. doi:10.25115/ejrep.v20i57.5629
76. Lăzăroiu G, Kovacova M, Siekelova A, Vrbka J. Addictive behavior of problematic smartphone users: the relationship between depression, anxiety, and stress. Rev Contemp Philos. 2020;19:50–56. doi:10.22381/RCP1920204
77. Mascia ML, Agus M, Penna MP. Emotional intelligence, self-regulation, smartphone addiction: which relationship with student well-being and quality of life? Front Psychol. 2020;11:375. doi:10.3389/fpsyg.2020.00375
78. Beranuy M, Oberst U, Carbonell X, Chamarro A. Problematic internet and mobile phone use and clinical symptoms in college students: the role of emotional intelligence. Comput Human Behav. 2009;25(5):1182–1187. doi:10.1016/j.chb.2009.03.001
79. Waytz A, Gray K. Does online technology make us more or less sociable? A preliminary review and call for research. Perspect Psychol Sci. 2018;13(4):473–491. doi:10.1177/1745691617746509
80. Augner C, Vlasak T, Aichhorn W, Barth A. The association between problematic smartphone use and symptoms of anxiety and depression—a meta-analysis. J Public Health. 2023;45(1):193–201. doi:10.1093/pubmed/fdab350
81. Baudry A-S, Grynberg D, Dassonneville C, Lelorain S, Christophe V. Sub-dimensions of trait emotional intelligence and health: a critical and systematic review of the literature. Scand J Psychol. 2018;59(2):206–222. doi:10.1111/sjop.12424
82. Lee S-Y, Lee HK, Choi J-S, et al. The Matthew effect in recovery from smartphone addiction in a 6-month longitudinal study of children and adolescents. Int J Environ Res Public Health. 2020;17(13):4751. doi:10.3390/ijerph17134751
83. Bettmann JE, Anstadt G, Casselman B, Ganesh K. Young adult depression and anxiety linked to social media use: assessment and treatment. Clin Soc Work J. 2021;49(3):368–379. doi:10.1007/s10615-020-00752-1
84. Robinson ME, Staud R, Price DD. Pain measurement and brain activity: will neuroimages replace pain ratings? J Pain. 2013;14(4):323–327. doi:10.1016/j.jpain.2012.05.007
85. Koskey KLK, Sondergeld TA, Stewart VC, Pugh KJ. Applying the mixed methods instrument development and construct validation process: the transformative experience questionnaire. J Mix Methods Res. 2018;12(1):95–122. doi:10.1177/1558689816633310
 © 2024 The Author(s). This work is published and licensed by Dove Medical Press Limited. The
full terms of this license are available at https://www.dovepress.com/terms.php
and incorporate the Creative Commons Attribution
- Non Commercial (unported, 3.0) License.
By accessing the work you hereby accept the Terms. Non-commercial uses of the work are permitted
without any further permission from Dove Medical Press Limited, provided the work is properly
attributed. For permission for commercial use of this work, please see paragraphs 4.2 and 5 of our Terms.
© 2024 The Author(s). This work is published and licensed by Dove Medical Press Limited. The
full terms of this license are available at https://www.dovepress.com/terms.php
and incorporate the Creative Commons Attribution
- Non Commercial (unported, 3.0) License.
By accessing the work you hereby accept the Terms. Non-commercial uses of the work are permitted
without any further permission from Dove Medical Press Limited, provided the work is properly
attributed. For permission for commercial use of this work, please see paragraphs 4.2 and 5 of our Terms.