")
Back to Journals » Nature and Science of Sleep » Volume 17
TEX10: A Novel Drug Target and Potential Therapeutic Direction for Sleep Apnea Syndrome
Authors Fan Z, Su H, Qiao T, Shi S, Shi P, Zhang A
Received 15 October 2024
Accepted for publication 7 April 2025
Published 1 May 2025 Volume 2025:17 Pages 731—746
DOI https://doi.org/10.2147/NSS.S499895
Checked for plagiarism Yes
Review by Single anonymous peer review
Peer reviewer comments 2
Editor who approved publication: Prof. Dr. Ahmed BaHammam
Zhitao Fan,1 Hui Su,2 Tong Qiao,1 Sunan Shi,1 Pengfei Shi,3 Anqi Zhang1
1Department of Otorhinolaryngology, Hebei Eye Hospital, Xingtai, Hebei Province, People’s Republic of China; 2Department of Neurosurgery, Xingtai People’s Hospital, Xingtai, Hebei Province, People’s Republic of China; 3Department of Ophthalmology, Hebei Eye Hospital, Xingtai, Hebei Province, People’s Republic of China
Correspondence: Zhitao Fan, Email [email protected]
Background: Sleep apnea syndrome (SAS) is a prevalent sleep disorder strongly associated with obesity, metabolic dysregulation, and cardiovascular diseases. While its underlying pathophysiological mechanisms remain incompletely understood, genetic factors likely play a pivotal role in SAS pathogenesis. This study investigates the causal relationships between potential drug target genes and SAS using multiple statistical approaches, aiming to provide novel insights for targeted therapeutic development.
Methods: We conducted a comprehensive genetic analysis integrating multiple methodologies to investigate gene-SAS relationships. Using publicly available GWAS and eQTL databases, we performed Mendelian Randomization (MR) analysis with the inverse variance weighted (IVW) method, validated by weighted median and MR-Egger approaches. Summary-data-based MR (SMR) analysis, coupled with HEIDI testing, assessed direct gene expression-SAS associations while controlling for linkage disequilibrium (LD). Colocalization analysis evaluated the probability of shared causal variants between SNPs, gene expression, and SAS. Statistical significance was determined using Benjamini-Hochberg multiple testing correction (FDR < 0.05). Additionally, mediation analysis explored TEX10’s influence on SAS through metabolic intermediates including BMI, waist circumference, and HDL cholesterol.
Results: We identified 18 candidate drug target genes significantly associated with SAS, with MAPKAPK3, TNXB, MPHOSPH8, and TEX10 showing consistent associations across multiple analyses. TEX10, in particular, exhibited significant associations with SAS risk in blood, cerebral cortex, hippocampus, and basal ganglia (PP.H4 > 0.9). Mediation analysis suggested that TEX10 might influence SAS risk indirectly through BMI, waist circumference, and HDL cholesterol levels.
Conclusion: Our study identified multiple potential therapeutic targets causally linked to SAS, with TEX10 emerging as a key candidate gene. These findings advance our understanding of SAS pathogenesis and offer promising directions for personalized diagnostics and targeted therapies.
Keywords: druggable genes, sleep apnea syndrome, drug target, expression quantitative trait loci, Mendelian randomization, summary-data-based Mendelian randomization
Introduction
Sleep apnea syndrome (SAS) is characterized by recurrent episodes of complete (apnea) or partial (hypopnea) upper airway obstruction during sleep, with each episode lasting ≥10 seconds and occurring ≥5 times per hour of sleep.1,2 Based on epidemiological evidence, SAS has an incidence rate of more than 20% in men, which is higher than the average incidence rate of 9% in women.3,4 With the global increase in obesity rates and an aging population, the prevalence of SAS is expected to continue escalating, becoming an increasingly serious public health issue.5,6 SAS has profound impacts on individual health and socioeconomic aspects. Health-wise, it is closely associated with various cardiovascular diseases such as hypertension,7 coronary heart disease,8 and heart failure,9 metabolic disorders like type 2 diabetes,10,11 and neurocognitive dysfunctions.12,13 Additionally, excessive daytime sleepiness makes patients more prone to traffic accidents and workplace incidents. Socioeconomically, the medical expenses, productivity losses, and accident-related costs due to SAS amount to tens of billions of dollars annually. Despite the widespread harm of SAS, current treatment methods have significant limitations. Continuous Positive Airway Pressure (CPAP) therapy is the current gold standard but suffers from poor compliance, with long-term usage rates below 50%.14,15 Oral appliances and surgical interventions are effective in some patients but have limited applicability.16–18 Pharmacotherapy, as a potential alternative, has gained widespread attention in recent years;19 however, no medications specifically targeting SAS have been approved to date, highlighting the urgent need to develop new effective drugs.
Genetic studies have demonstrated that SAS has a significant hereditary component, with heritability estimated between 30–40%.20,21 Genome-wide association studies (GWAS) have identified multiple genetic variants associated with SAS risk, involving biological pathways such as respiratory control, upper airway anatomy, fat distribution, and inflammatory responses.22–24 These findings provide important clues for understanding the molecular mechanisms of SAS and identifying potential drug targets. The application of pharmacogenomics has opened new avenues for personalized treatment and novel drug development.25 By integrating genomic data with drug response information, researchers can predict individual responses to specific therapies and identify new drug targets.26 In this process, expression quantitative trait loci (eQTL) analysis plays a crucial role by revealing how genetic variants influence gene expression, thereby helping to understand the functional significance of disease-associated variants.27 Summary data-based Mendelian randomization (SMR) analysis is a powerful causal inference tool that utilizes GWAS and eQTL data to identify genes across the genome that may have causal relationships with disease risk.28 This method has shown great potential in elucidating the mechanisms of complex diseases and identifying drug targets.29,30
In this study, we first conducted cis-eQTL analysis on known druggable genes to identify those regulated by SAS-associated genetic variants, serving as promising drug targets. Secondly, we employed SMR analysis to explore the causal relationships between SAS risk and gene expression, aiming to identify genes directly related to the pathogenesis of SAS. Thirdly, considering the close association between SAS and neural regulation, we performed brain tissue-specific cis-eQTL analysis to identify genes that may play key roles in the central nervous system. Finally, we conducted colocalization analysis and HEIDI tests on the selected candidate targets to enhance the reliability of our findings. Our study leveraged the harmonized GWAS meta-analysis data from UK Biobank and FinnGen, where sleep apnea cases were consistently identified through standardized disease classifications: phecode (a hierarchical system for EHR-based phenome-wide association studies) and ICD-10 (WHO’s International Classification of Diseases, 10th revision). This standardized approach ensures phenotype consistency across biobanks while enabling robust genetic association analyses. From a clinical application perspective, the results of this study deepen our understanding of the pathogenesis of SAS and provide a theoretical basis for drug development and future mechanistic research. This will aid in the development of more precise diagnostic tools and personalized treatment strategies.
Materials and Methods
Research Design
This study comprises several key steps: identifying a set of druggable genes, performing cis-eQTL analysis on these genes, conducting SMR analysis between the cis-eQTLs and SAS, determining candidate drug target genes, analyzing the cis-eQTLs of these genes in brain tissue, and finally performing colocalization analysis and HEIDI tests, along with mediation analysis related to risk factors based on prior evidence. Detailed procedural information is illustrated in Figure 1. The study adheres to the guidelines outlined in the STROBE-MR statement.31 The instrumental variables (IVs) in this study must satisfy three core assumptions:32 (1) IVs must be strongly associated with the genetic instruments of the druggable genes; (2) IVs must be independent of other confounding factors; (3) IVs must influence SAS exclusively through the druggable genes. Although this study utilized only publicly available datasets that have been previously published and are freely accessible to researchers, with no direct involvement of human subjects in our data collection process, we obtained institutional ethics approval from The Medical Ethics Committee of Hebei Eye Hospital (approval number: 2024LW27) in accordance with standard research protocols.
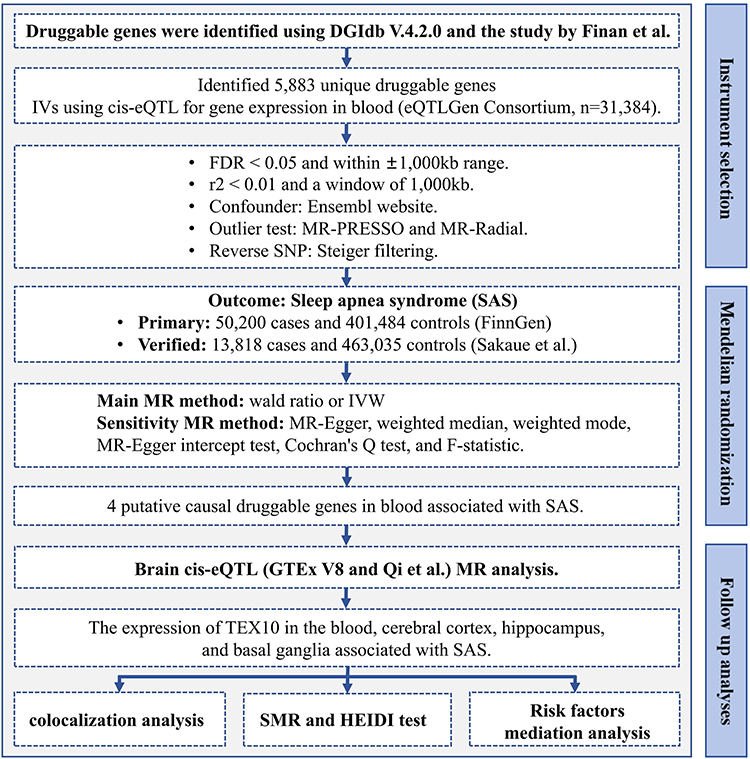 |
Figure 1 Flow chart for the study. Abbreviations: eQTL, expression quantitative trait locus; GETx, The Genotype-Tissue Expression Portal; FDR, false discovery rate; MR, Mendelian randomization; IVW, inverse-variance weighted; SMR, Summary-data-based Mendelian randomization; HEIDI, heterogeneity in dependent instruments. |
Identification of Druggable Target Genes
To identify druggable target genes, we utilized two primary sources: the Drug–Gene Interaction Database (DGIdb, version 4.2.0) and the recent review on gene “druggability” by Finan et al. DGIdb is a comprehensive resource that consolidates drug–gene interaction information and annotations of druggable genes from various publications, databases, and online resources.33–35 We specifically focused on the “category data” released by DGIdb in February 2022, which encompasses genes across all drug categories in DGIdb, sourced from the Ensembl database.36 This approach ensures that our research is based on the most up-to-date and comprehensive information on druggable genes.
eQTL Datasets
Our gene expression data were primarily obtained from the eQTLGen Consortium’s blood eQTL database, which includes cis-eQTL data from blood samples of 31,684 healthy individuals of European descent, covering 16,987 genes.37 We focused on statistically significant cis-eQTL results with a false discovery rate (FDR) less than 0.05.38 Corresponding allele frequency information was also collected for a more comprehensive analysis. To further validate our findings and enhance the reliability of the study, we incorporated additional data from two sources: brain eQTL data provided by Qi et al and eQTL data from the Genotype-Tissue Expression (GTEx) Project (version 8.0).39,40 These supplementary datasets allowed us to verify the results observed in blood samples and explore potential differences in gene expression across different tissues, particularly the brain. Detailed information about the datasets is shown in Table S1.
GWAS Datasets
The primary GWAS data for this study were sourced from the FinnGen consortium’s (release version 11),41 which includes summary statistics for SAS. This dataset comprises 50,200 SAS patients and 401,484 control subjects, all of European ancestry. To validate the robustness of our findings, we also referenced a large-scale study by Sakaue et al, involving 13,818 SAS patients and 463,035 controls, also of European descent.42 Considering potential sample overlap, we used the FinnGen SAS data as the outcome variable in our mediation analyses, while the summary statistics for risk factors were obtained from other independent cohorts. This design helps minimize potential biases and enhances the reliability of our results. Previous studies have shown that patients with SAS often develop complications associated with lifestyle-related diseases, for example, hypertension, hyperlipidemia, diabetes, and metabolic syndrome.43 Furthermore, patients with SAS similarly need smoking cessation and restricted alcohol use to prevent deterioration. Based on the previous studies, we focused on 13 modifiable risk factors related to physiological and lifestyle indicators potentially associated with SAS: body mass index (BMI) (ukb-b-19953), fasting insulin (ebi-a-GCST90002238),44 fasting glucose (ebi-a-GCST90002232),44 glycine levels (ebi-a-GCST90092820),45 waist-to-hip ratio adjusted for BMI (ebi-a-GCST90025996),46 creatinine levels (ebi-a-GCST90025946),46 serum uric acid levels (ebi-a-GCST90018977),42 waist circumference (ukb-b-9405), high-density lipoprotein cholesterol (HDL cholesterol) (ieu-b-109),47 low-density lipoprotein cholesterol (LDL cholesterol) (ieu-b-110),47 total cholesterol (ieu-a-301),48 triglycerides (ieu-b-111),47 and glycated hemoglobin (HbA1C) (ieu-b-103).49 The GWAS data for these risk factors were obtained from the IEU Open GWAS database.50 By comprehensively considering these diverse risk factors, we aimed to assess their potential associations with SAS and explore possible mediation effects. Detailed information about the datasets is shown in Table S1.
eQTL MR Analysis
We employed rigorous eQTL selection and MR analysis methods. Initially, we identified SNPs located within ±1000 kb of each gene’s transcription start site (TSS) in the druggable genome and with an FDR less than 0.05 as potential eQTLs.38 Using European sample data from the 1000 Genomes Project, we clumped SNPs within each eQTL based on linkage disequilibrium (LD) thresholds of r2 less than 0.01 and within a 1000 kb sliding window.27 Phenotypes associated with IVs were identified using the Ensembl database.36 To reduce potential confounding, we excluded SNPs directly associated with the outcomes, outcome-related traits, or known risk factors (eg, obesity, smoking, alcohol consumption). We harmonized the alleles of exposure and outcome data to ensure consistency. To improve the reliability of our results, we applied “MR-PRESSO” and “MR-Radial” outlier tests to identify and exclude outliers and used the “Steiger test” to determine the causal direction of the IVs, excluding SNPs with reverse associations.51–54 The strength of the IVs was assessed using the F-statistic (F=beta2/se2),55 considering (F>10) as indicative of sufficient instrument strength.56,57
In the MR analyses, we used the wald ratio method for single IVs and the inverse-variance weighted (IVW) method for multiple SNPs to calculate weighted average estimates.58,59 Sensitivity analyses using MR-Egger,60 weighted median,61 and weighted mode methods were conducted to verify the robustness of our main findings.62 Horizontal pleiotropy and heterogeneity among SNPs were assessed using the MR-Egger intercept test and Cochran’s Q test.63 Statistical significance was set at (P<0.05) after FDR correction.64 Supplementary analyses using brain eQTL data were performed to validate the robustness of our findings in whole blood tissue, ensuring consistency in the IV selection process.
Colocalization Analysis
To determine whether the associated eQTLs and SAS share causal variants within gene coding regions, we performed Bayesian colocalization analysis.65,66 We selected all SNPs within ±100kb of the TSS of each gene for colocalization analysis. This method evaluates five hypotheses: H0, no association with either eQTL or SAS; H1, association only with eQTL; H2, association only with SAS; H3, association with both eQTL and SAS through two independent SNPs; H4, association with both eQTL and SAS through a single shared SNP.67 We used the “coloc” package in R for this analysis.68 Results were interpreted based on the posterior probability (PP) of each hypothesis. A(PP.H4>0.7) was considered strong evidence for colocalization, indicating that eQTL and SAS share a causal variant, while PP.H4 values between 0.5 and 0.7 suggested moderate evidence.69,70 This analysis enabled us to understand potential shared genetic mechanisms between eQTLs and SAS, providing insights for further exploration of the disease’s molecular mechanisms.
Summary-Data-Based MR (SMR) Analysis
To verify the robustness of our MR results, we employed the SMR analysis along with the Heterogeneity in Dependent Instruments (HEIDI) test.71,72 These analyses aimed to confirm the causal relationships between druggable genes and SAS further. We utilized eQTL data from three main sources: eQTLGen, Qi et al, and GTEx version 8. In the SMR analysis, only the most significant SNP for each gene was considered, specifically selecting the SNP with the smallest p-value less than 5×10⁻⁸ within a 1 Mb region upstream and downstream of the gene.73 This approach ensured a focus on genetic variants most likely associated with gene expression.27 The HEIDI test, using multiple SNPs within the locus, helped distinguish druggable genes associated with SAS risk due to shared genetic variants rather than mere LD, which is crucial for excluding false-positive results. Strict criteria were adopted for interpreting the results: when (P-SMR < 0.05) and (P-HEIDI > 0.05), the SMR results were considered statistically significant, and the association was unlikely driven by LD.74 This stringent standard helped ensure the reliability of the identified causal relationships. All SMR and HEIDI tests were conducted using the SMR software (version 1.3.1). This comprehensive approach allowed a thorough assessment of potential causal relationships between druggable genes and SAS, providing a robust scientific basis for developing future therapeutic strategies.
Mediation Analysis
To explore the complex relationships among druggable genes, SAS, and its risk factors, we hypothesized that druggable genes might indirectly influence the occurrence and progression of SAS by affecting intermediate risk factors. To test this hypothesis, we conducted mediation MR analysis, aiming to assess whether the effect of druggable genes on SAS is mediated through known risk factors. Strict criteria were applied when selecting IVs for the risk factors: SNPs with p-values less than 5×10⁻⁸, LD (r2<0.001), and located within a ±10 Mb window around the target gene. These standards ensured that the selected IVs had sufficient statistical significance, independence, and relevance. Our analysis employed a two-step mediation MR method. First, we evaluated the effect of druggable genes on risk factors; second, we assessed the effect of risk factors on SAS. To quantify the indirect effect, we used the product of coefficients method by multiplying the effect sizes from these two steps.75,76 The delta method was applied to calculate the standard error, accurately assessing the uncertainty of the indirect effect. This comprehensive approach allowed a precise evaluation of the complex relationships among druggable genes, risk factors, and SAS, providing important insights into the pathological mechanisms of SAS and informing the development of potential therapeutic strategies.
Results
Selection of IVs
In this study, we identified 3952 genes from the DGIdb v4.2.0 database (Table S2) and extracted 4479 genes from the review by Finan et al (Table S3). In total, 5883 genes with potential pharmacological relevance were identified for further analysis (Table S4). Using eQTL data from blood tissue, we narrowed this down to 3694 genes that were potentially relevant for drug applications. After clumping, these genes were selected for subsequent MR analysis (Table S5). The F-statistics for all SNPs were greater than 10, indicating that the selected instruments were robust and not susceptible to weak instrument bias (Table S5). Furthermore, outliers and reverse SNPs were identified and removed using RadialMR and Steiger tests. After excluding SNPs associated with SAS-related confounding, the remaining SNPs were subjected to analysis. Detailed information on the confounding SNPs is provided in Table S6.
Druggable Genes Associated with SAS
In the primary analysis, we applied FDR correction (FDR < 0.05) to the Wald ratio and IVW methods, identifying 18 candidate drug target genes for SAS (Table 1, Table S7). Notably, four potential drug target genes (MAPKAPK3, TNXB, MPHOSPH8, and TEX10) reached statistically significant levels in the validated outcomes (Table 1, Table S8a). While TNXB (FinnGen: odds ratio (OR) = 0.95; IEU: OR = 0.92) exhibited a protective effect, MAPKAPK3 (FinnGen: OR = 1.07; IEU: OR = 1.08), MPHOSPH8 (FinnGen: OR = 1.25; IEU: OR = 1.29), and TEX10 (FinnGen: OR = 1.26; IEU: OR = 1.43) were associated with increased risk of SAS (Table 1). In addition, TEX10 showed stability when considering significant results adjusted for FDR for the preliminary and validation analyses to obtain the crossover genes (Table S8b). The P-values from Cochran’s Q test and the MR-Egger intercept test were all greater than 0.05, indicating no evidence of heterogeneity or directional pleiotropy among the IVs (Table 1). Additionally, our supplementary analysis revealed that the expression of TEX10 in the cerebral cortex, hippocampus, and basal ganglia, and MPHOSPH8 expression in the cerebellum, were statistically significant (PFDR<0.05), potentially linking these genes to an increased risk of SAS (Figure 2, Tables S9-S10).
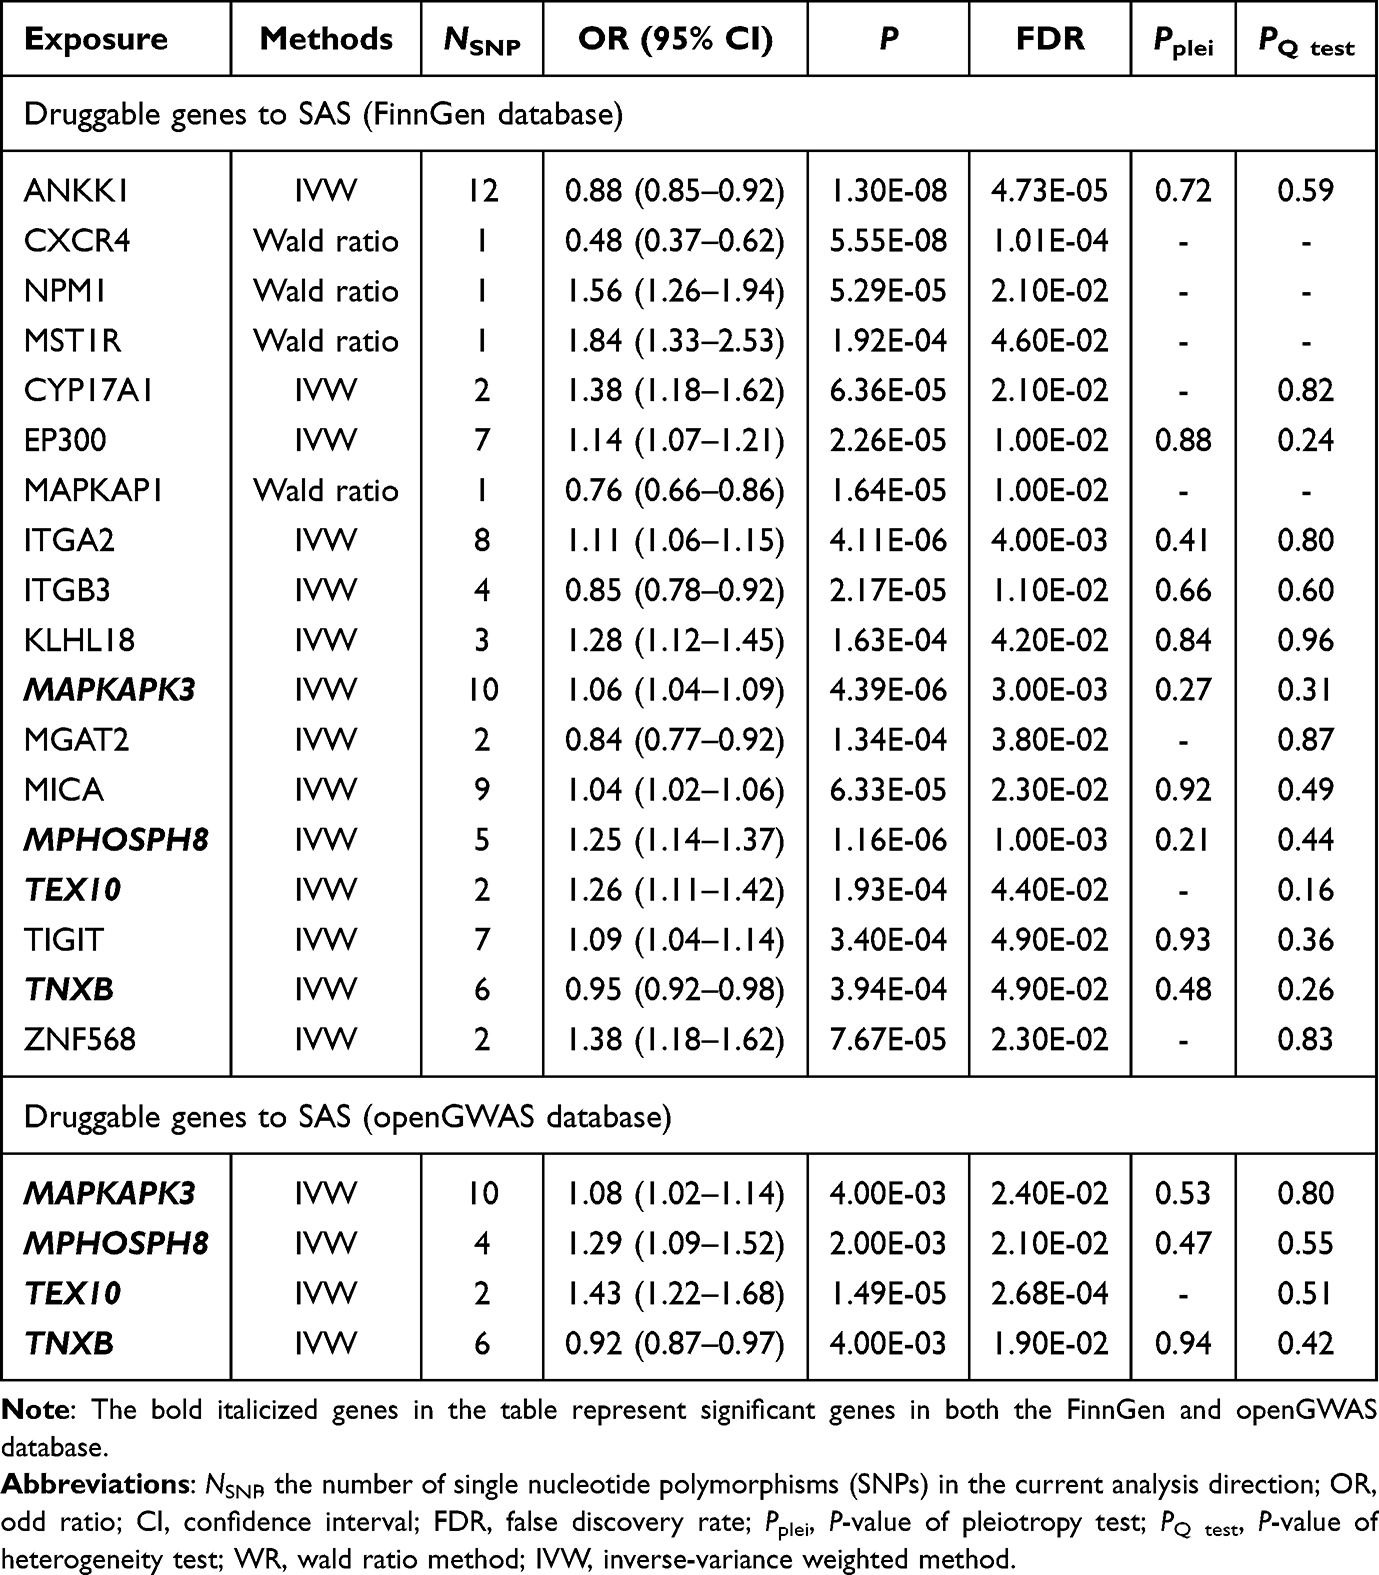 |
Table 1 The Results of Mendelian Randomization Analysis Between Druggable Genes and Sleep Apnea Syndrome (SAS) |
 |
Figure 2 Forest plot shows the results of Mendelian randomization between MPHOSPH8, TEX10 genes and different region of brain. The small box represents the odd ratio (OR) value, and the short horizontal line represents the upper value (right end) and lower value (left end) of the 95% confidence interval (CI) in the current analysis direction. FinnGen represents the SAS data derived from FinnGen database; IEU represent the SAS data derived from openGWAS database. Abbreviations: IV, inverse-variance weighted; SAS, sleep apnea syndrome. |
Subsequently, we performed colocalization analysis to assess the likelihood of shared causal genetic variants among SNPs associated with SAS and the four potential drug target genes. For TEX10, significant colocalization was observed in the blood (Figure 3A), cerebral cortex (Figure 3B), and basal ganglia across both datasets (PP.H4 > 0.9) (Figure 3A and B, Table S11). Additionally, the expression of MAPKAPK3 in the blood and MPHOSPH8 in the cerebral cortex and cerebellum showed a colocalization probability exceeding 70% in the primary results dataset. Further details are provided in Table S11.
 |
Figure 3 Colocalization analysis of SNPs associated with TEX10 expression and sleep apnea syndrome (SAS) risk in blood (A) and brain tissues (B). |
SMR Analysis Results
To further validate the accuracy of our previous MR analyses, we conducted SMR analyses on both the primary and validation outcomes. The results demonstrated that increased genetic susceptibility of TEX10 in the eQTL data from whole blood, cerebral cortex, and basal ganglia was significantly associated with a higher risk of SAS (Table S12, P<0.05). Additionally, the HEIDI test p-values were all greater than 0.05, indicating that the findings are not biased by LD, thus minimizing the risk of false positives (Table S12).
Mediation Analysis
To explore potential risk factors for SAS, this study employed MR analysis to evaluate the relationships between 15 modifiable risk factors and SAS. The findings revealed that a 1 standard deviation (SD) increase in BMI (OR=1.80), waist circumference (OR=1.99), triglycerides (OR=1.10), and waist-to-hip ratio (OR=1.13) were significantly associated with an increased risk of developing SAS. In contrast, a 1 SD increase in HDL cholesterol (OR=0.89) and fasting glucose (OR=0.76) was significantly associated with a reduced risk of SAS (Table S13). Additionally, both Cochran’s Q test and MR-Egger intercept test confirmed the absence of heterogeneity and directional pleiotropy among the IVs (Table S13). Notably, TEX10 levels in the blood, cerebral cortex, hippocampus, and basal ganglia were associated with four risk factors (BMI, waist circumference, HDL cholesterol, and triglycerides) for SAS. Our results showed that an increase in TEX10 gene expression leads to higher BMI, triglyceride levels, and waist circumference, and to decreased HDL cholesterol levels (see Table S14).
Further analysis investigated whether TEX10 could influence SAS development by modulating these risk factors. Mediation analysis indicated that TEX10 expression in blood, cerebral cortex, hippocampus, and basal ganglia could impact SAS through the mediating effects of BMI, waist circumference, and HDL cholesterol. Additionally, TEX10 expression in the hippocampus was found to influence SAS via triglyceride levels. Detailed results are presented in Figure 4. Mediator analysis revealed that increased TEX10 expression may influence SAS by elevating BMI (blood, OR=1.04; cerebral cortex (Qi et al), OR=1.02; basal ganglia, OR=1.02; cerebral cortex, OR=1.03; hippocampus, OR=1.01), waist circumference (blood, OR=1.04; cerebral cortex (Qi et al), OR=1.02; basal ganglia, OR=1.02; cerebral cortex, OR=1.03; hippocampus, OR=1.01), and triglyceride levels (hippocampus, OR=1.00). HDL is a beneficial type of cholesterol that helps transport excess cholesterol from the vessel walls to the liver for metabolism and excretion, thereby reducing the risk of cardiovascular disease.77 In further analysis, the increased expression of TEX 10 may also affect SAS by reducing HDL cholesterol levels (blood, OR=1.01; cerebral cortex (Qi et al), OR=1.00; basal ganglia, OR=1.00; cerebral cortex, OR=1.00; hippocampus, OR=1.00), although the mediation effect was very small. Detailed results are presented in Figures 4 and 5.
 |
Figure 4 Mediation analysis of TEX10 expression in blood and brain regions on sleep apnea syndrome (SAS) risk through body mass index (BMI), waist circumference, high density lipoprotein (HDL) cholesterol, and triglycerides. The black small box represents the odd ratio (OR) value of the current analysis direction, and the short horizontal line represents the upper (right end) and lower (left end) value of the 95% confidence interval (CI) in the current analysis direction. Abbreviation: FDR, false discovery rate. |
 |
Figure 5 Results of the mediation analysis. The dashed yellow red line indicates the direct effect of TEX 10 on risk factors; the red dashed line indicates the direct effect of risk factors on SAS; the solid blue red line indicates the direct effect of TEX 10 on SAS; and the blue dashed line indicates the mediation effect of TEX 10 on SAS mediated by risk factors. Abbreviations: BMI, body mass index; HDL, high density lipoprotein; SAS, sleep apnea syndrome; OR, the odd ratio. |
Discussion
In this study, we employed MR, eQTL, SMR, and colocalization analysis to explore the relationship between potential drug target genes and SAS. Our results indicate that multiple genes may play significant roles in the pathogenesis of SAS, providing valuable insights for the development of targeted therapeutic strategies. From the initial screening of 5883 potential druggable genes, we identified 18 genes that showed significant associations with SAS. Notably, four of these genes—MAPKAPK3, TNXB, MPHOSPH8, and TEX10—demonstrated consistent associations in both the primary and validation datasets. Among these, TEX10 exhibited particularly significant impact, suggesting it may serve as an important target for SAS drug development. To further elucidate the association between these genes and SAS, we performed brain tissue-specific eQTL analyses.
Our findings indicated that TEX10 expression in the cerebral cortex, hippocampus, and basal ganglia is associated with increased SAS risk, while MPHOSPH8 expression in the cerebellum showed similar associations. Notably, TEX10 expression in multiple brain regions correlated with SAS risk. Subsequent colocalization analyses confirmed a high probability (PP.H4>0.9) of shared genetic variants between TEX10 expression in blood, cerebral cortex, and basal ganglia and SAS, suggesting that TEX10 may play a pivotal role in SAS pathogenesis. Moreover, SMR analysis results confirmed the influence of TEX10 expression on SAS risk, further reinforcing its importance as a potential drug target. It is also noteworthy that our study identified several risk factors for SAS, including BMI, waist circumference, triglyceride levels, waist-to-hip ratio, and smoking status. These findings deepen our understanding of SAS risk factors and provide new directions for disease prevention strategies. Importantly, our mediation analysis suggests that TEX10 may impact the development of SAS by influencing risk factors such as BMI, waist circumference, and HDL cholesterol levels. This evidence unveils potential mechanisms by which TEX10 affects SAS, opening new avenues for therapies targeting this gene.
By integrating bioinformatics and statistical methods, we aim to achieve a thorough understanding of the genetic basis and pathogenesis of SAS. This will aid in developing more precise and effective individualized treatment strategies, significantly improving the quality of life and long-term health outcomes for patients with SAS. Multifactorial risk model could significantly enhance the accuracy of early identification of high-risk individuals, enabling more targeted preventive interventions.78,79 Specifically, for individuals carrying specific TEX10 gene variants, more proactive weight management and lifestyle intervention plans can be developed. Such genotype-based individualized prevention strategies may substantially reduce the risk of SAS onset. Firstly, the expression levels of TEX10 and other candidate genes are promising as novel biomarkers for SAS. This opens up the possibility of developing rapid, accurate, and convenient diagnostic methods based on blood tests. Such noninvasive diagnostic approaches could not only improve diagnostic efficiency but also offer alternative options for patients who have difficulty undergoing traditional sleep monitoring.80,81 However, large-scale prospective validation studies are needed before these biomarkers can be translated into clinical diagnostic tools. Secondly, the gene-phenotype associations identified in our study lay the foundation for individualized treatment of SAS.82,83 For instance, patients with abnormal TEX10 expression may require specific therapeutic plans. This could involve developing drugs that target TEX10 or optimizing existing treatments (such as adjusting parameters of continuous positive airway pressure therapy) based on the patient’s gene expression profile. Such molecular mechanism–based individualized treatment strategies are expected to significantly enhance treatment efficacy and patient adherence. Thirdly, given the close association between SAS and various metabolic and cardiovascular diseases, the gene targets identified in this study—such as TEX10—may become new avenues for managing SAS-related complications. By modulating the expression of TEX10, it might be possible to simultaneously ameliorate SAS symptoms and associated metabolic disorders, offering patients a more comprehensive health management plan. This multitarget therapeutic strategy could be particularly beneficial for patients with complex SAS. Fourth, the candidate genes identified in our study, especially TEX10, offer new research and development directions for the pharmaceutical industry. This could lead to the development of SAS therapeutics with entirely novel mechanisms of action, particularly benefiting patients who respond poorly to existing treatments. However, substantial translational research is required to move from basic findings to clinical applications.
TEX10 encodes a protein widely expressed in multiple tissues, including the central nervous system.84 Although initially discovered in testicular tissue, subsequent studies have revealed its important roles in various key biological processes.85–87 Combining our research results with existing literature, we can more precisely stratify SAS patients. This molecular feature–based patient stratification not only deepens our understanding of SAS-related pathophysiological processes but also aids in formulating individualized treatment strategies, optimizing clinical trial design, predicting disease prognosis, and ultimately improving patient outcomes and quality of life.
The molecular mechanisms by which TEX10 serves as a potential therapeutic target for SAS may involve several aspects: Firstly, TEX10 is involved in cell cycle control, particularly playing a critical role in the G1/S phase transition.88 In SAS patients, repeated hypoxia–reoxygenation events lead to chronic damage of upper airway muscles and neural tissues. TEX10 may influence the development of SAS through the following mechanisms: promoting the proliferation and regeneration of upper airway muscle cells, thereby improving muscle tone and function; regulating the proliferation and differentiation of neural stem cells,89 facilitating the repair of damaged neural tissues;90 maintaining normal tissue renewal,91,92 reducing chronic tissue damage caused by SAS. Secondly, our study found that TEX10 is significantly associated with metabolic parameters such as BMI, waist circumference, and HDL cholesterol levels. This suggests that TEX10 may be involved in the regulation of lipid metabolism. Given the close association between SAS and obesity and metabolic syndrome, we propose that TEX10 may also participate in the metabolic regulation of SAS through: influencing the differentiation and function of adipose tissue, thereby regulating body weight and fat distribution; participating in the regulation of hepatic lipid metabolism, affecting blood lipid levels; regulating insulin sensitivity, impacting glucose metabolism.93,94 These hypotheses provide new perspectives for explaining the interaction between SAS and metabolic disorders and guide the development of therapeutic strategies targeting both respiratory function and metabolic status. Thirdly, SAS patients commonly exhibit chronic systemic inflammation and increased oxidative stress.95,96 Although the direct role of TEX10 in inflammation regulation has not been extensively studied, its involvement in cellular stress responses suggests it may participate in this process. We propose that TEX10 may influence SAS-related inflammation and oxidative stress through: regulating the expression of inflammatory factors such as signal transducer and activator of transcription (STAT3); 97 and affecting cellular adaptive responses to hypoxia–reoxygenation injury.88,98 Verifying these hypotheses may provide a theoretical basis for developing new therapeutic strategies targeting SAS-related inflammation and oxidative stress. In summary, we propose that TEX10, as a potential therapeutic target for SAS, has a multifaceted molecular mechanism. It may influence the occurrence and development of SAS through multiple pathways, such as regulating the cell cycle and tissue regeneration, influencing metabolism and lipid metabolism, participating in inflammation and oxidative stress responses, and possibly circadian rhythm regulation. These diverse roles make TEX10 a particularly attractive therapeutic target because modulating it may simultaneously improve multiple pathophysiological aspects of SAS. However, we must acknowledge that most of the above mechanisms are still based on indirect evidence and speculation. Future research should focus on the verifying the specific mechanisms of TEX10 in SAS animal models, particularly using conditional gene knockout techniques to study its roles in different tissues.
Despite making significant progress in identifying potential drug targets for SAS, we recognize several limitations in our study that may affect the interpretation and generalization of the results. Firstly, our study is mainly based on genetic data from European populations. Considering the differences in genetic variations among different ethnic groups, our findings may not be fully generalizable to other populations.99 Future studies should include more diverse samples to validate and extend our findings. Secondly, although we used advanced statistical methods like MR to infer the causal relationship between gene expression and SAS risk, these methods are still based on certain assumptions, such as the validity of instrumental variables and the absence of pleiotropy. While sensitivity analyses were conducted, we cannot completely rule out potential biases. Thirdly, our research is primarily based on statistical associations and bioinformatics analyses. Although we identified potential drug targets like TEX10, we lack in vivo and in vitro functional validation experiments. This limits our understanding of the specific roles these genes play in SAS pathogenesis. Besides, we acknowledge that potential unmeasured confounders, such as genetic pleiotropy, population stratification, and environmental factors, may have influenced the observed associations. Fourth, our analyses are based on static gene expression data and cannot capture temporal dynamics and tissue-specific variations in gene expression.100–102 Considering the circadian rhythm characteristics of SAS and its complexity involving multiple organ systems, this is a significant limitation.103,104 Fifth, our study utilized comprehensive GWAS data from multiple sources, making it challenging to precisely quantify sample overlap between datasets. While we conducted cross-analyses using different GWAS datasets to mitigate this issue, potential sample overlap may still introduce bias into our results.
Conclusion
In conclusion, using MR analysis combined with eQTL analysis, colocalization analysis, and SMR, this study systematically explored the relationship between potential drug target genes and SAS. We successfully identified 18 candidate genes significantly associated with SAS, with TEX10 showing particularly prominent importance across multiple analyses. These findings offer new perspectives for an in-depth understanding of the molecular mechanisms of SAS and lay the foundation for developing targeted prevention, diagnosis, and treatment strategies.
Data Sharing Statement
The datasets generated and/or analyzed in this study are available from public databases, with specific access links provided in Table S1.
Ethics Approval and Consent to Participate
This research was reviewed and approved by The Medical Ethics Committee of Hebei Eye Hospital (approval number: 2024LW27). Although this study utilized only publicly available datasets that have been previously published and are freely accessible to researchers, and no human subjects were directly involved in our data collection process, we obtained institutional ethics approval in accordance with standard research protocols. All data usage complied with the terms and conditions specified by the original data providers and relevant data protection regulations. The datasets used in this study had previously undergone their respective ethical review processes during their original collection and publication.
Acknowledgments
We extend our gratitude to the teams behind the OpenGWAS, UK Biobank, FinnGen, eQTLGen, and GTEx databases for providing public access to their summary data. We also thank the principal investigators of these studies for their transparency and willingness to share their data for research purposes.
Author Contributions
Zhitao Fan: Conceptualization, Data curation, Methodology, Project administration, Software, Writing - original draft.
Hui Su: Data curation, Software, Visualization, Writing-review & editing.
Tong Qiao: Validation, Data curation, Writing-review & editing.
Sunan Shi: Formal analysis, Writing-review & editing.
Pengfei Shi: Validation, Visualization, Writing-review & editing.
Anqi Zhang: Project administration, Writing-review & editing.
All authors have agreed on the journal of submission, reviewed and approved all versions of the article before submission and during revision, accepted the final published version, and take responsibility and accountability for the article’s contents.
Funding
This study was supported by grants from Xingtai Science and Technology Plan Project (GRANT ID: 2022ZC129).
Disclosure
The authors declare that no commercial or financial relationships were present that could be interpreted as potential conflicts of interest in the conduct of this research.
References
1. Drazen JM. Sleep apnea syndrome. New Engl J Med. 2002;346(6):390. doi:10.1056/nejm200202073460602
2. Lv R, Liu X, Zhang Y, et al. Pathophysiological mechanisms and therapeutic approaches in obstructive sleep apnea syndrome. Signal Transduc Targeted Ther. 2023;8(1):218. doi:10.1038/s41392-023-01496-3
3. Senaratna CV, Perret JL, Lodge CJ, et al. Prevalence of obstructive sleep apnea in the general population: a systematic review. Sleep Med Rev. 2017;34:70–81. doi:10.1016/j.smrv.2016.07.002
4. Neagos A, Dumitru M, Neagos CM, Mitroi M, Vrinceanu D. Correlations between morphology, the functional properties of upper airways, and the severity of sleep apnea. J Clin Med. 2022;11(18):5347. doi:10.3390/jcm11185347
5. Di Bello F, Napolitano L, Abate M, et al. “Nocturia and obstructive sleep apnea syndrome: a systematic review”. Sleep Med Rev. 2023;69:101787. doi:10.1016/j.smrv.2023.101787
6. Xiong J, Xu Y, Wang N, et al. Obstructive sleep apnea syndrome exacerbates NASH progression via selective autophagy-mediated EEPD1 degradation. Adv Sci. 2024;11(35):e2405955. doi:10.1002/advs.202405955
7. Takasawa S, Shobatake R, Takeda Y, et al. Intermittent hypoxia increased the expression of DBH and PNMT in neuroblastoma cells via MicroRNA-375-mediated mechanism. Int J Mol Sci. 2022;23(11):5868. doi:10.3390/ijms23115868
8. Liu W, Zhou L, Zhao D, et al. Development and validation of a prognostic nomogram in lung cancer with obstructive sleep apnea syndrome. Front Med. 2022;9:810907. doi:10.3389/fmed.2022.810907
9. Okamura K, Shimada H, Imazato K, et al. Impact of renal denervation on quality of life (How does renal denervation contribute to improving hypertension treatment affected by poor medication adherence?). Hypertens Res. 2024. doi:10.1038/s41440-024-01679-7
10. Driessen S, Francque SM, Anker SD, et al. Metabolic dysfunction-associated steatotic liver disease and the heart. Hepatology. 2023. doi:10.1097/hep.0000000000000735
11. Sewefy AM, Atyia AM, Mohammed MM, Kayed TH, Hamza HM. Single anastomosis sleeve jejunal (SAS-J) bypass as a treatment for morbid obesity, technique and review of 1986 cases and 6 Years follow-up. Retrospective cohort. Int j Surg. 2022;102:106662. doi:10.1016/j.ijsu.2022.106662
12. Cavuoto MG, Robinson SR, O’Donoghue FJ, et al. Associations between amyloid burden, hypoxemia, sleep architecture, and cognition in obstructive sleep apnea. J Alzheimers Dis. 2023;96(1):149–159. doi:10.3233/jad-221049
13. Shobatake R, Ota H, Takahashi N, Ueno S, Sugie K, Takasawa S. The impact of intermittent hypoxia on metabolism and cognition. Int J Mol Sci. 2022;23(21). doi:10.3390/ijms232112957
14. Cohen O, Sánchez-de-la-Torre M, Al-Taie Z, et al. Heterogeneous effects of continuous positive airway pressure in non-sleepy obstructive sleep apnea on cardiovascular disease outcomes: post hoc machine learning analysis of the ISAACC trial (ECSACT study). Ann Am Thoracic Soc. 2024;21(7):1074–1084. doi:10.1513/AnnalsATS.202309-799OC
15. Reynor A, McArdle N, Shenoy B, et al. Continuous positive airway pressure and adverse cardiovascular events in obstructive sleep apnea: are participants of randomized trials representative of sleep clinic patients? Sleep. 2022;45(4). doi:10.1093/sleep/zsab264
16. Denolf PL, Vanderveken OM, Marklund ME, Braem MJ. The status of cephalometry in the prediction of non-CPAP treatment outcome in obstructive sleep apnea patients. Sleep Med Rev. 2016;27:56–73. doi:10.1016/j.smrv.2015.05.009
17. Ferguson KA, Cartwright R, Rogers R, Schmidt-Nowara W. Oral appliances for snoring and obstructive sleep apnea: a review. Sleep. 2006;29(2):244–262. doi:10.1093/sleep/29.2.244
18. Antonaglia C, Vidoni G, Contardo L, et al. Low arousal threshold estimation predicts failure of mandibular advancement devices in obstructive sleep apnea syndrome. Diagnostics. 2022;12(10):2548. doi:10.3390/diagnostics12102548
19. Avellar AB, Carvalho LB, Prado GF, Prado LB. Pharmacotherapy for residual excessive sleepiness and cognition in CPAP-treated patients with obstructive sleep apnea syndrome: a systematic review and meta-analysis. Sleep Med Rev. 2016;30:97–107. doi:10.1016/j.smrv.2015.10.005
20. de Azevedo PG, Guimarães MLR, Albuquerque ALB, et al. Whole-exome identifies germline variants in families with obstructive sleep apnea syndrome. Front Genet. 2023;14:1137817. doi:10.3389/fgene.2023.1137817
21. Petruco AC, Bagnato Mda C. [Genetic aspects of obstructive sleep apnea syndrome]. Aspectos genéticos da SAOS. J Bras Pneumol. 2010;36(Suppl 2):13–16. doi:10.1590/s1806-37132010001400005
22. Li K, Liu P, Zeng Y, Liu M, Ye J, Zhu L. Exploring the bidirectional causal association between sleep apnea syndrome and depression: a Mendelian randomization study involving gut microbiota, serum metabolites, and inflammatory factors. J Affective Disorders. 2024;366:308–316. doi:10.1016/j.jad.2024.08.153
23. Sun Y, Wang F, Li S. Bidirectional relationship between 56 peripheral inflammatory regulators and sleep apnea syndrome: a Mendelian randomization study. Heart Lung. 2023;62:116–121. doi:10.1016/j.hrtlng.2023.06.023
24. Zhang Y, Wang H, Yang J, Wang S, Tong W, Teng B. Obstructive sleep apnea syndrome and obesity indicators, circulating blood lipid levels, and adipokines levels: a bidirectional two-sample Mendelian randomization study. Nat Sci Sleep. 2024;16:573–583. doi:10.2147/nss.S460989
25. Pirmohamed M. Pharmacogenomics: current status and future perspectives. Nat Rev Genet. 2023;24(6):350–362. doi:10.1038/s41576-022-00572-8
26. Sadee W, Wang D, Hartmann K, Toland AE. Pharmacogenomics: driving personalized medicine. Pharmacol Rev. 2023;75(4):789–814. doi:10.1124/pharmrev.122.000810
27. Tang L. GWAS and eQTL disparity. Nat Methods. 2023;20(12):1873. doi:10.1038/s41592-023-02133-1
28. Zhu Z, Zhang F, Hu H, et al. Integration of summary data from GWAS and eQTL studies predicts complex trait gene targets. Nature Genet. 2016;48(5):481–487. doi:10.1038/ng.3538
29. Lin PW, Lin ZR, Wang WW, Guo AS, Chen YX. Identification of immune-inflammation targets for intracranial aneurysms: a multiomics and epigenome-wide study integrating summary-data-based Mendelian randomization, single-cell-type expression analysis, and DNA methylation regulation. Int j Surg. 2024. doi:10.1097/js9.0000000000001990
30. Mao R, Li J, Xiao W. Identification of prospective aging drug targets via Mendelian randomization analysis. Aging Cell. 2024;23(7):e14171. doi:10.1111/acel.14171
31. Skrivankova VW, Richmond RC, Woolf BAR, et al. Strengthening the reporting of observational studies in epidemiology using Mendelian randomization: the STROBE-MR statement. JAMA. 2021;326(16):1614–1621. doi:10.1001/jama.2021.18236
32. Lawlor DA, Harbord RM, Sterne JA, Timpson N, Davey Smith G. Mendelian randomization: using genes as instruments for making causal inferences in epidemiology. Stat Med. 2008;27(8):1133–1163. doi:10.1002/sim.3034
33. Cannon M, Stevenson J, Stahl K, et al. DGIdb 5.0: rebuilding the drug-gene interaction database for precision medicine and drug discovery platforms. Nucleic Acids Res. 2024;52(D1):D1227–d1235. doi:10.1093/nar/gkad1040
34. Griffith M, Griffith OL, Coffman AC, et al. DGIdb: mining the druggable genome. Nat Methods. 2013;10(12):1209–1210. doi:10.1038/nmeth.2689
35. Finan C, Gaulton A, Kruger FA, et al. The druggable genome and support for target identification and validation in drug development. Sci, trans med. 2017;9(383). doi:10.1126/scitranslmed.aag1166
36. Martin FJ, Amode MR, Aneja A, et al. Ensembl 2023. Nucleic Acids Res. 2022;51(D1):D933–D941. doi:10.1093/nar/gkac958
37. Võsa U, Claringbould A, Westra H-J, et al. Large-scale cis- and trans-eQTL analyses identify thousands of genetic loci and polygenic scores that regulate blood gene expression. Nature Genet. 2021;53(9):1300–1310. doi:10.1038/s41588-021-00913-z
38. Huang QQ, Ritchie SC, Brozynska M, Inouye M. Power, false discovery rate and Winner’s Curse in eQTL studies. Nucleic Acids Res. 2018;46(22):e133. doi:10.1093/nar/gky780
39. Battle A, Brown CD, Engelhardt BE, Montgomery SB. Genetic effects on gene expression across human tissues. Nature. 2017;550(7675):204–213. doi:10.1038/nature24277
40. Qi T, Wu Y, Fang H, et al. Genetic control of RNA splicing and its distinct role in complex trait variation. Nature Genet. 2022;54(9):1355–1363. doi:10.1038/s41588-022-01154-4
41. Kurki MI, Karjalainen J, Palta P, et al. FinnGen provides genetic insights from a well-phenotyped isolated population. Nature. 2023;613(7944):508–518. doi:10.1038/s41586-022-05473-8
42. Sakaue S, Kanai M, Tanigawa Y, et al. A cross-population atlas of genetic associations for 220 human phenotypes. Nature Genet. 2021;53(10):1415–1424. doi:10.1038/s41588-021-00931-x
43. Okuro M, Morimoto S. Sleep apnea in the elderly. Curr Opin Psychiatry. 2014;27(6):472–477. doi:10.1097/yco.0000000000000105
44. Chen J, Spracklen CN, Marenne G, et al. The trans-ancestral genomic architecture of glycemic traits. Nature Genet. 2021;53(6):840–860. doi:10.1038/s41588-021-00852-9
45. Richardson TG, Leyden GM, Wang Q, et al. Characterising metabolomic signatures of lipid-modifying therapies through drug target Mendelian randomisation. PLoS biol. 2022;20(2):e3001547. doi:10.1371/journal.pbio.3001547
46. Barton AR, Sherman MA, Mukamel RE, Loh PR. Whole-exome imputation within UK biobank powers rare coding variant association and fine-mapping analyses. Nature Genet. 2021;53(8):1260–1269. doi:10.1038/s41588-021-00892-1
47. Richardson TG, Sanderson E, Palmer TM, et al. Evaluating the relationship between circulating lipoprotein lipids and apolipoproteins with risk of coronary heart disease: a multivariable Mendelian randomisation analysis. PLoS Med. 2020;17(3):e1003062. doi:10.1371/journal.pmed.1003062
48. Willer CJ, Schmidt EM, Sengupta S, et al. Discovery and refinement of loci associated with lipid levels. Nature Genet. 2013;45(11):1274–1283. doi:10.1038/ng.2797
49. Soranzo N, Sanna S, Wheeler E, et al. Common variants at 10 genomic loci influence hemoglobin A₁(C) levels via glycemic and nonglycemic pathways. Diabetes. 2010;59(12):3229–3239. doi:10.2337/db10-0502
50. Hemani G, Zheng J, Elsworth B, et al. The MR-base platform supports systematic causal inference across the human phenome. eLife. 2018;7. doi:10.7554/eLife.34408
51. Wang Z, Yang Q. The causal relationship between human blood metabolites and the risk of visceral obesity: a Mendelian randomization analysis. Lipids Health Dis. 2024;23(1):39. doi:10.1186/s12944-024-02035-x
52. Bowden J, Spiller W, Greco M F D, et al. Improving the visualization, interpretation and analysis of two-sample summary data Mendelian randomization via the radial plot and radial regression. Int J Epidemiol. 2018;47(4):1264–1278. doi:10.1093/ije/dyy101
53. Verbanck M, Chen CY, Neale B, Do R. Detection of widespread horizontal pleiotropy in causal relationships inferred from Mendelian randomization between complex traits and diseases. Nature Genet. 2018;50(5):693–698. doi:10.1038/s41588-018-0099-7
54. Liu S, Deng Y, Liu H, et al. Causal relationship between meat intake and biological aging: evidence from Mendelian randomization analysis. Nutrients. 2024;16(15):2433. doi:10.3390/nu16152433
55. Feng Z, Wang Y, Fu Z, Liao J, Liu H, Zhou M. Exploring the causal effects of mineral metabolism disorders on telomere and mitochondrial DNA: a bidirectional two-sample Mendelian randomization analysis. Nutrients. 2024;16(10):1417. doi:10.3390/nu16101417
56. Liu D, Gao X, Pan XF, et al. The hepato-ovarian axis: genetic evidence for a causal association between non-alcoholic fatty liver disease and polycystic ovary syndrome. BMC Med. 2023;21(1):62. doi:10.1186/s12916-023-02775-0
57. Burgess S, Thompson SG. Avoiding bias from weak instruments in Mendelian randomization studies. Int J Epidemiol. 2011;40(3):755–764. doi:10.1093/ije/dyr036
58. Qiu H, Shi M, Zhong Z, et al. Causal relationship between aging and anorexia nervosa: a white-matter-microstructure-mediated Mendelian randomization analysis. Biomedicines. 2024;12(8):1874.
59. Burgess S, Butterworth A, Thompson SG. Mendelian randomization analysis with multiple genetic variants using summarized data. Genetic Epidemiol. 2013;37(7):658–665. doi:10.1002/gepi.21758
60. Burgess S, Thompson SG. Interpreting findings from Mendelian randomization using the MR-Egger method. Eur J Epidemiol. 2017;32(5):377–389. doi:10.1007/s10654-017-0255-x
61. Bowden J, Davey Smith G, Haycock PC, Burgess S. Consistent estimation in Mendelian randomization with some invalid instruments using a weighted median estimator. Genetic Epidemiol. 2016;40(4):304–314. doi:10.1002/gepi.21965
62. Burgess S, Foley CN, Allara E, Staley JR, Howson JMM. A robust and efficient method for Mendelian randomization with hundreds of genetic variants. Nat Commun. 2020;11(1):376. doi:10.1038/s41467-019-14156-4
63. Ovcjak A, Pontello R, Miller SP, Sun HS, Feng ZP. Hypothermia combined with neuroprotective adjuvants shortens the duration of hospitalization in infants with hypoxic ischemic encephalopathy: meta-analysis. Front Pharmacol. 2022;13:1037131. doi:10.3389/fphar.2022.1037131
64. Lu Y, Tang H, Huang P, et al. Assessment of causal effects of visceral adipose tissue on risk of cancers: a Mendelian randomization study. Int J Epidemiol. 2022;51(4):1204–1218. doi:10.1093/ije/dyac025
65. Cho C, Kim B, Kim DS, et al. Large-scale cross-ancestry genome-wide meta-analysis of serum urate. Nat Communs. 2024;15(1):3441. doi:10.1038/s41467-024-47805-4
66. Li Q, Gloudemans MJ, Geisinger JM, et al. RNA editing underlies genetic risk of common inflammatory diseases. Nature. 2022;608(7923):569–577. doi:10.1038/s41586-022-05052-x
67. Sheng X, Guan Y, Ma Z, et al. Mapping the genetic architecture of human traits to cell types in the kidney identifies mechanisms of disease and potential treatments. Nature Genet. 2021;53(9):1322–1333. doi:10.1038/s41588-021-00909-9
68. Giambartolomei C, Vukcevic D, Schadt EE, et al. Bayesian test for colocalisation between pairs of genetic association studies using summary statistics. PLoS Genetics. 2014;10(5):e1004383. doi:10.1371/journal.pgen.1004383
69. Chen Y, Xu X, Wang L, et al. Genetic insights into therapeutic targets for aortic aneurysms: a Mendelian randomization study. EBioMedicine. 2022;83:104199. doi:10.1016/j.ebiom.2022.104199
70. Tang AS, Rankin KP, Cerono G, et al. Leveraging electronic health records and knowledge networks for alzheimer’s disease prediction and sex-specific biological insights. Nature Aging. 2024;4(3):379–395. doi:10.1038/s43587-024-00573-8
71. Lee B, Yao X, Shen L. Integrative analysis of summary data from GWAS and eQTL studies implicates genes differentially expressed in alzheimer’s disease. BMC Genomics. 2022;23(Suppl 4):414. doi:10.1186/s12864-022-08584-8
72. Su Z, Wan Q. Potential therapeutic targets for membranous nephropathy: proteome-wide Mendelian randomization and colocalization analysis. Front Immunol. 2024;15:1342912. doi:10.3389/fimmu.2024.1342912
73. Wang Z, Li S, Cai G, et al. Mendelian randomization analysis identifies druggable genes and drugs repurposing for chronic obstructive pulmonary disease. Front Cell Infect Microbiol. 2024;14:1386506. doi:10.3389/fcimb.2024.1386506
74. Restuadi R, Steyn FJ, Kabashi E, et al. Functional characterisation of the amyotrophic lateral sclerosis risk locus GPX3/TNIP1. Genome Med. 2022;14(1):7. doi:10.1186/s13073-021-01006-6
75. Crouse WL, Keele GR, Gastonguay MS, Churchill GA, Valdar W. A Bayesian model selection approach to mediation analysis. PLoS Genetics. 2022;18(5):e1010184. doi:10.1371/journal.pgen.1010184
76. Chong RS, Li H, Cheong AJY, et al. Mendelian randomization implicates bidirectional association between myopia and primary open-angle glaucoma or intraocular pressure. Ophthalmology. 2023;130(4):394–403. doi:10.1016/j.ophtha.2022.11.030
77. Adorni MP, Ronda N, Bernini F, Zimetti F. High density lipoprotein cholesterol efflux capacity and atherosclerosis in cardiovascular disease: pathophysiological aspects and pharmacological perspectives. Cells. 2021;10(3). doi:10.3390/cells10030574
78. Lakeman IMM, van den Broek AJ, Vos JAM, et al. The predictive ability of the 313 variant-based polygenic risk score for contralateral breast cancer risk prediction in women of European ancestry with a heterozygous BRCA1 or BRCA2 pathogenic variant. Genet Med. 2021;23(9):1726–1737. doi:10.1038/s41436-021-01198-7
79. Lee A, Yang X, Tyrer J, et al. Comprehensive epithelial tubo-ovarian cancer risk prediction model incorporating genetic and epidemiological risk factors. J Med Genet. 2022;59(7):632–643. doi:10.1136/jmedgenet-2021-107904
80. Tovar-Camargo OA, Toden S, Goel A. Exosomal microRNA biomarkers: emerging frontiers in colorectal and other human cancers. Expert Rev Mol Diagn. 2016;16(5):553–567. doi:10.1586/14737159.2016.1156535
81. Zhang Q, Wen J, Zhou J, Zhang B. Missing-view completion for fatty liver disease detection. Comput Biol Med. 2022;150:106097. doi:10.1016/j.compbiomed.2022.106097
82. Park J, Lucas AM, Zhang X, et al. Exome-wide evaluation of rare coding variants using electronic health records identifies new gene-phenotype associations. Nat Med. 2021;27(1):66–72. doi:10.1038/s41591-020-1133-8
83. Zhou W, Bi W, Zhao Z, et al. SAIGE-GENE+ improves the efficiency and accuracy of set-based rare variant association tests. Nature Genet. 2022;54(10):1466–1469. doi:10.1038/s41588-022-01178-w
84. Buganim Y. Tex10: a new player in the core pluripotency circuitry. Cell Stem Cell. 2015;16(6):572–573. doi:10.1016/j.stem.2015.04.019
85. Castle CD, Cassimere EK, Denicourt C. LAS1L interacts with the mammalian Rix1 complex to regulate ribosome biogenesis. Mol Biol Cell. 2012;23(4):716–728. doi:10.1091/mbc.E11-06-0530
86. Finkbeiner E, Haindl M, Raman N, Muller S. SUMO routes ribosome maturation. Nucleus. 2011;2(6):527–532. doi:10.4161/nucl.2.6.17604
87. Gordon J, Chapus FL, Viverette EG, et al. Cryo-EM reveals the architecture of the PELP1-WDR18 molecular scaffold. Nat Commun. 2022;13(1):6783. doi:10.1038/s41467-022-34610-0
88. Wang Z, Sheng C, Kan G, Yao C, Geng R, Chen S. RNAi screening identifies that TEX10 promotes the proliferation of colorectal cancer cells by increasing NF-κB activation. Adv Sci. 2020;7(17):2000593. doi:10.1002/advs.202000593
89. Liang JH, Xu QD, Gu SG. LncRNA RSU1P2-microRNA let-7a-testis-expressed protein 10 axis modulates tumorigenesis and cancer stem cell-like properties in liver cancer. Bioengineered. 2022;13(2):4285–4300. doi:10.1080/21655979.2022.2031394
90. Finkbeiner E, Haindl M, Muller S. The SUMO system controls nucleolar partitioning of a novel mammalian ribosome biogenesis complex. EMBO J. 2011;30(6):1067–1078. doi:10.1038/emboj.2011.33
91. Xiang X, Deng L, Xiong R, et al. Tex10 is upregulated and promotes cancer stem cell properties and chemoresistance in hepatocellular carcinoma. Cell Cycle. 2018;17(11):1310–1318. doi:10.1080/15384101.2018.1480208
92. Xiang X, Xiong R, Yu C, et al. Tex10 promotes stemness and EMT phenotypes in esophageal squamous cell carcinoma via the Wnt/β‑catenin pathway. Oncol Rep. 2019;42(6):2600–2610. doi:10.3892/or.2019.7376
93. Ding J, Huang X, Shao N, et al. Tex10 coordinates epigenetic control of super-enhancer activity in pluripotency and reprogramming. Cell Stem Cell. 2015;16(6):653–668. doi:10.1016/j.stem.2015.04.001
94. Fanis P, Gillemans N, Aghajanirefah A, et al. Five friends of methylated chromatin target of protein-arginine-methyltransferase[prmt]-1 (chtop), a complex linking arginine methylation to desumoylation. Mol Cell Proteomics. 2012;11(11):1263–1273. doi:10.1074/mcp.M112.017194
95. Erturk N, Celik A, Kahraman Yaman S, Yaman H, Unal F, Calik Kutukcu E. Expiratory muscle strength training reduces oxidative stress and systemic inflammation in men with obstructive sleep apnea syndrome: a double-blinded, randomized parallel trial. Sleep. 2024;47(12). doi:10.1093/sleep/zsae221
96. Mastino P, Rosati D, de Soccio G, et al. Oxidative stress in obstructive sleep apnea syndrome: putative pathways to hearing system impairment. Antioxidants. 2023;12(7). doi:10.3390/antiox12071430
97. Xiang X, Kuang W, Yu C, et al. Tex10 interacts with STAT3 to regulate hepatocellular carcinoma growth and metastasis. Mol Carcinog. 2023;62(12):1974–1989. doi:10.1002/mc.23629
98. Luo S, Wang W, Feng J, Li R. TEX10 promotes the tumorigenesis and radiotherapy resistance of urinary bladder carcinoma by stabilizing XRCC6. J Immunol Res. 2021;2021:5975893. doi:10.1155/2021/5975893
99. Basu A. Use of race in clinical algorithms. Sci Adv. 2023;9(21):eadd2704. doi:10.1126/sciadv.add2704
100. Bao W, Liao A, Yu P, Shen J, Zhao W, Ding L. Aerodynamic evaluation of surgical design for the stenosis correction of airway. Front Cardiovasc Med. 2024;11:1359844. doi:10.3389/fcvm.2024.1359844
101. Pries R, Lange C, Behn N, Bruchhage KL, Steffen A. Dynamics of circulating CD14/CD16 monocyte subsets in obstructive sleep apnea syndrome patients upon hypoglossal nerve stimulation. Biomedicines. 2022;10(8):1925. doi:10.3390/biomedicines10081925
102. Saito K, Okada Y, Torimoto K, Takamatsu Y, Tanaka Y. Blood glucose dynamics during sleep in patients with obstructive sleep apnea and normal glucose tolerance: effects of CPAP therapy. Sleep Breath. 2022;26(2):771–781. doi:10.1007/s11325-021-02442-9
103. Bazin B, Geoffroy PA, Benzaquen H, et al. Continuous positive airway pressure as an accurate marker for non-24-hour sleep-wake rhythm disorder. J Sleep Res. 2023;32(4):e13859. doi:10.1111/jsr.13859
104. Peter-Derex L, Derex L. Wake-up stroke: from pathophysiology to management. Sleep Med Rev. 2019;48:101212. doi:10.1016/j.smrv.2019.101212
 © 2025 The Author(s). This work is published and licensed by Dove Medical Press Limited. The
full terms of this license are available at https://www.dovepress.com/terms.php
and incorporate the Creative Commons Attribution
- Non Commercial (unported, 4.0) License.
By accessing the work you hereby accept the Terms. Non-commercial uses of the work are permitted
without any further permission from Dove Medical Press Limited, provided the work is properly
attributed. For permission for commercial use of this work, please see paragraphs 4.2 and 5 of our Terms.
© 2025 The Author(s). This work is published and licensed by Dove Medical Press Limited. The
full terms of this license are available at https://www.dovepress.com/terms.php
and incorporate the Creative Commons Attribution
- Non Commercial (unported, 4.0) License.
By accessing the work you hereby accept the Terms. Non-commercial uses of the work are permitted
without any further permission from Dove Medical Press Limited, provided the work is properly
attributed. For permission for commercial use of this work, please see paragraphs 4.2 and 5 of our Terms.
Recommended articles
Unveiling Novel Protein Biomarkers for Psoriasis Through Integrated Analysis of Human Plasma Proteomics and Mendelian Randomization
Mao R, Zhang T, Yang Z, Li J
Psoriasis: Targets and Therapy 2024, 14:179-193
Published Date: 7 December 2024
Evidence from a Comprehensive Bioinformatics Analysis Point to Possible Therapeutic Targets for Vitiligo
Wang Y, Yao T, Lin Y, Wu J
Clinical, Cosmetic and Investigational Dermatology 2025, 18:1281-1295
Published Date: 27 May 2025