")
Back to Journals » Journal of Pain Research » Volume 18
The Causal Effects Between Circulating Inflammatory Proteins and Osteoarthritis: A Mendelian Randomization and Transcriptomic Analysis
Received 11 March 2025
Accepted for publication 28 June 2025
Published 4 July 2025 Volume 2025:18 Pages 3383—3402
DOI https://doi.org/10.2147/JPR.S523677
Checked for plagiarism Yes
Review by Single anonymous peer review
Peer reviewer comments 2
Editor who approved publication: Professor King Hei Stanley Lam
Shaoru Lin,1 Changwu Wu,2,3 Yimin Pan2
1Department of Orthopedics, The Second Affiliated Hospital of Hunan University of Chinese Medicine, Changsha, Hunan, People’s Republic of China; 2Department of Neurosurgery, Xiangya Hospital, Central South University, Changsha, Hunan, People’s Republic of China; 3National Clinical Research Center for Geriatric Disorders, Xiangya Hospital, Central South University, Changsha, Hunan, People’s Republic of China
Correspondence: Yimin Pan, Department of Neurosurgery, Xiangya Hospital, Central South University, No. 87 Xiangya Road, Changsha, 410008, People’s Republic of China, Email [email protected]
Background: Observational studies have demonstrated the correlation between various inflammatory proteins and osteoarthritis (OA). However, the causal relationship and directionality between them are still unclear. This study aims to analyze the potential causal relationship between circulating inflammatory proteins and OA using Mendelian randomization (MR) analysis.
Methods: This study used bidirectional two-sample MR analysis, employing the inverse variance-weighted as the primary MR method. The GWAS summary data for OA were derived from The Musculoskeletal Knowledge Portal, while the GWAS summary data for 91 circulating inflammatory proteins were obtained from a recently published study. Furthermore, this study used two transcriptomic cohorts from the GEO database to explore differentially expressed inflammation-related genes (IRGs) in OA and identify key inflammatory markers.
Results: This study provides suggestive evidence. The forward two-sample MR analysis found that the levels of urokinase-type plasminogen activator, adenosine deaminase, C-C motif chemokine 19, interleukin-10 receptor subunit alpha and latency-associated peptide transforming growth factor beta 1 have causal effects on lower risk of OA, and the levels of fractalkine, C-X-C motif chemokine 1, hepatocyte growth factor and interleukin-8 have causal effects on higher risk of OA. Reverse two-sample MR analysis showed that hip OA has causal effects on the increased levels of caspase 8, protein S100A12, interleukin-10 receptor subunit alpha, interleukin-7 and monocyte chemoattractant protein 2 and a causal effect on the decreased level of fms-related tyrosine kinase 3 ligand. Knee OA has a causal effect on the increased level of monocyte chemoattractant protein-3 and decreased level of interleukin-1-alpha respectively. Furthermore, we identified six key OA-related IRGs through comprehensive transcriptomic analysis, which could serve as potential diagnostic biomarkers for OA.
Conclusion: This study supports the causal relationship between OA and specific circulating inflammatory proteins and develops potential OA-related inflammatory biomarkers.
Keywords: osteoarthritis, circulating inflammatory proteins, Mendelian randomization study, causal relationship, inflammation-related genes, biomarker
Introduction
Osteoarthritis (OA) is characterized by the wear and narrowing of joint cartilage.1 It is a whole joint disease involving all joint tissues, including degeneration of menisci, subchondral bone remodeling and changes in the infrapatellar fat pad.2,3 Severe OA can lead to disability and have a detrimental impact on patients’ quality of life and lifespan.4–7 Specifically, OA is primarily characterized by chronic joint pain, often described as a dull ache that worsens with activity and improves with rest, but may progress to persistent pain even at rest due to cartilage degradation and synovial inflammation.8 This pain, along with morning stiffness (typically <30 minutes) and functional impairment, significantly reduces mobility and quality of life, particularly in weight-bearing joints like knees and hips.9 OA can affect any synovial joint in the body, but knee OA and hip OA are the most common types in clinical practice.10 Although current research suggests that obesity, previous joint injuries, age, and joint deformities are potential risk factors for OA,8 the specific mechanisms of disease development are not completely understood. The high prevalence of OA affects hundreds of millions of people worldwide, and in some developed countries, the cost of treating OA accounts for more than 2% of the gross domestic product.11,12 Furthermore, with the aging population and increasing prevalence of obesity, the incidence and total treatment costs of OA are expected to rise continuously.13 Given the significant economic burden that OA imposes on society, there is an urgent need for in-depth research on its specific etiology and the development of new treatment approaches and diagnostic markers to address OA.14
Inflammation is the physiological response of the body to external injury or infection,15 but abnormal inflammation can also cause damage to the body and trigger various diseases.16,17 The inflammatory response is mediated by a complex network of inflammatory cells and mediators, including cytokines and soluble receptors.15 Exploring the causal relationship between inflammation-related circulating proteins and diseases is of great significance. For example, a previous research has found a link between CD40 and the pathogenesis of rheumatoid arthritis and multiple sclerosis.18 The prevailing view is that inflammation plays a crucial role in the development of OA.19 Preliminary animal models and cell line experiments also provide evidence of a close connection between inflammation and OA.20 Inflammation drives OA progression by activating synovial macrophages and fibroblasts, which release pro-inflammatory cytokines (eg, IL-1β, TNF-α). These cytokines promote cartilage degradation via upregulation of MMPs, while also suppressing chondrocyte anabolic activity.21 Chronic inflammation further induces synovitis and subchondral bone remodeling, exacerbating joint dysfunction.22–24 Conclusions based on observational studies may be biased by confounding factors and reverse causality.25 Therefore, the true causal relationship between circulating inflammatory proteins and OA is still unclear. Although randomized controlled trials (RCTs) are considered the highest level of evidence to evaluate causal relationships,26 there are challenges in determining the causal effect between inflammatory proteins and OA through RCTs in practical implementation.
Mendelian randomization (MR), as an alternative approach to RCTs, has been widely employed to explore causal relationships between exposures and outcomes.27–30 MR is based on the summary data of genome-wide association studies (GWAS), using single nucleotide polymorphisms (SNPs) as instrumental variables (IVs).31 By following the principle of random allocation of genetic variation at the time of conception, MR largely avoids confounding factors and reverse causation issues commonly encountered in observational studies.27,28 Previous MR studies have conducted preliminary explorations into the association between inflammatory proteins and OA. Zhang et al employed the MR method to investigate the causal association between 41 inflammatory cytokines and KOA.32 Xu et al identified causal effects of six inflammatory cytokines on KOA but did not perform a reverse MR analysis.33 Lin et al determined two inflammatory proteins with causal relationships to KOA and three with causal relationships to HOA, but the GWAS summary data for OA was sourced from a small sample cohort.34 In this study, we conducted the bidirectional two-sample MR analysis based on the latest GWAS cohort of 91 circulating inflammatory proteins and the largest OA GWAS cohort to date, aiming to comprehensively explore the causal relationship between circulating inflammatory proteins and different types of OA, including OA at any sites, KOA and HOA.
Gene expression profiling based on transcriptome sequencing has recently been widely used in biomedical and clinical research and has become an important tool for biomarker development. Several studies based on transcriptome sequencing have successfully identified OA-related biomarkers. For example, Sun et al identified HTRA1, DPT and MXRA5 as potential biomarkers for OA based on transcriptome sequencing in a recent study.35 A study identified three tryptophan metabolism-related biomarkers (TDO2, AOX1, and SLC3A2) in OA through transcriptome analysis.36 However, despite the recognized potential importance of inflammation in the pathogenesis of OA, inflammation-related biomarkers for OA have yet to be developed. In the current study, we used transcriptomic data and comprehensive bioinformatics approaches to identify important inflammatory markers in OA. This exploratory analysis aims to provide new insights into the pathogenesis and diagnosis of OA.
Methods
Study Design and Data Sources
This study conducted two-sample MR analysis based on three key assumptions of MR: (1) IVs are significantly associated with the exposure; (2) IVs are not related to confounders that affect the association between exposure and outcome; (3) IVs are not directly associated with the outcome.37 The overview of the study design and the three key assumptions were shown in Figure 1. Firstly, a two-sample MR analysis was conducted using circulating inflammatory proteins as the exposure and OA as the outcome. Then, a reverse two-sample MR analysis was performed using OA as the exposure and circulating inflammatory proteins as the outcome.
 |
Figure 1 Mendelian randomization study design. OA, osteoarthritis. |
In addition to the most common HOA and KOA, we also included the data of OA at any sites to gain a more comprehensive understanding of the association of inflammatory proteins with OA. The GWAS summary data for OA at any sites, hip OA, and knee OA were sourced from The Musculoskeletal Knowledge Portal.38 This is the largest genome-wide meta-analysis for OA to date, comprising 826,690 individuals. GWAS summary data of 177,517 cases with OA at any sites, 36,445 cases with hip OA, and 62,497 cases with knee OA were included in this study. The GWAS summary data of circulating inflammatory proteins was from the latest study by Zhao et al,18 which included 91 inflammatory proteins and involved a total of 14,824 participants. Full per-inflammatory protein GWAS summary data are available for download at GWAS catalog (https://www.ebi.ac.uk/gwas/publications/37563310). GWAS data have been standardized in the source publications. Supplementary Table S1 summarized the definitions, cases, controls, descent, and sources for each trait. As described previously,17 we obtained the IRGs from the GeneCards database (https://www.genecards.org) and applied specific filters, including the requirement for protein-coding genes and relevance scores exceeding 5. Finally, we identified a total of 394 IRGs (Supplementary Box 1). The most recent OA microarray dataset (GSE236924) was sourced from the Gene Expression Omnibus (GEO) database (https://www.ncbi.nlm.nih.gov/gds), featuring normalized gene expression data from 89 OA patients and 7 control subjects.39 Furthermore, the GSE114007 cohort was also retrieved from the GEO database, consisting of normalized RNA-Seq data from 20 OA samples and 18 healthy controls.40 According to the description of the source publications, patients with a clear diagnosis of OA can be included, while the control group needs to be from normal people with no history of joint disease or trauma. The samples of GSE114007 are from joint tissues of KOA patients, while those of GSE236924 are from joint tissues of KOA or HOA patients. The data used in this study were from previous publications and public databases, so no ethical approval or informed consent was required.
Selection of Genetic Instrumental Variables
When using circulating inflammatory proteins as exposures, the traditional genome-wide significance threshold of P < 5×10⁻⁸ resulted in a large number of inflammatory proteins not obtaining significant SNPs. In order to include a sufficient number of SNPs as IVs, this study used a genome-wide significance threshold of P < 1×10⁻⁵. It is important to note that this may increase the risk of including weak IVs. To remove linkage disequilibrium among IVs, a clumping distance of 10,000 kb and R2 < 0.001 were utilized to assess SNPs during the clumping process. Furthermore, to avoid weak instrument bias, SNPs with F statistics < 10 were excluded. We ensured the harmonization of SNPs between the exposure and outcome variables, guaranteeing that they corresponded to the same alleles. SNPs closely associated with the outcome (P < 5×10⁻⁵) and palindromic SNPs were also eliminated. To rule out reverse causal associations, we performed Steiger tests and excluded SNPs failing the test. When using OA at any sites, hip OA and knee OA as exposures, the traditional genome-wide significance threshold of P < 5×10⁻⁸ was used for selection IVs and other thresholds and parameters were maintained. One of the key assumptions in MR analysis is that a SNP influences the outcome exclusively through its effect on the exposure. If the SNP is linked not only to the exposure but also to potential confounding factors that could impact the outcome, this can introduce bias into the observed relationship between exposure and outcome, thereby violating the assumption 2 of MR analysis (Figure 1). In this study, the PhenoScanner database (http://phenoscanner.medschl.cam.ac.uk/) was used to detect the association between SNPs and any potential confounders (such as obesity) and SNPs related to confounders were excluded. The selected and excluded SNPs associated with confounders in this study were summarized in Supplementary Tables S2 and S3.
MR Analysis
Five popular MR analysis methods were employed to explore the causal association between circulating inflammatory proteins and OA, including inverse variance-weighted (IVW),41 MR-Egger regression,42 weighted median,43 weighted mode44 and MR-PRESSO.45 A previous study has shown that the IVW method is more powerful than other methods under certain conditions.43 Therefore, this study focuses on the results of the IVW method, while the other four methods are used as supplementary. The MR-Egger intercept and MR-PRESSO were used to assess horizontal pleiotropy, with a P−intercept < 0.05 or a Global Test P < 0.05 in MR-PRESSO indicating the presence of horizontal pleiotropy. MR-PRESSO was also used to remove outliers. Cochran’s Q test in IVW was used to assess the heterogeneity among the included SNPs in each analysis, and a P <0.05 suggests high heterogeneity. Leave-one-out analysis was also performed to detect SNP outliers. Forward and reverse MR analyses used different SNPs due to different exposures and both tested key MR assumptions.
Differential Expression Analysis
The identification of differentially expressed IRGs (DEIRGs) was conducted using the linear models for microarray data (Limma) method, which employs linear models tailored for microarray data. In this study, the R package “limma” (version 3.64.0) was utilized to perform differential expression analysis and identify DEIRGs between OA and control samples in GSE236924 and GSE114007.46 The criteria established for screening included a p-value of less than 0.05 and a |Fold Change (FC)| greater than 1.5. Then, the intersection of DEIRGs in GSE236924 and GSE114007 was taken as the final DEIRGs.
Enrichment Analysis of OA-Related IRGs
Enrichment analyses for Gene Ontology (GO) and the Kyoto Encyclopedia of Genes and Genomes (KEGG) were conducted using the R package “clusterProfiler” (version 4.16.0).47 Statistical significance was defined with a p-value of less than 0.05 and a false discovery rate (FDR) of less than 0.05. The GO enrichment analysis encompassed biological processes (BP), molecular functions (MF), and cellular components (CC).
The Identification of Key OA-Related IRGs
Initially, the final DEIRGs were input into the STRING database (https://string-db.org/) to create the protein–protein interaction (PPI) network using the default settings.48 The visualization of this PPI network was then performed with Cytoscape software (version 3.9.0). Additionally, we employed three algorithms—betweenness, closeness, and degree—within Cytoscape to pinpoint the top 20 hub genes in the PPI network. The intersection of the hub genes identified by these algorithms was considered the key hub gene. Lastly, the random forest algorithm was applied to determine the most significant key hub genes, referred to as key OA-related IRGs, based on the mean decrease accuracy metric.
Statistical Analysis
All statistical analyses were performed using R software (version 4.3.3). The TwoSampleMR (version 0.5.7), MendelianRandomization (version 0.8.0), and MRPRESSO (version 1.0) packages were used for all MR analyses. A suggestive causal association was defined as a p <0.05. Due to the exploratory nature of this study, adjusted p-values were not employed. Differences between the two groups were assessed using the Wilcoxon rank sum test, with a p <0.05 deemed statistically significant. The R package “pROC” (version 1.18.5) was utilized to generate receiver operating characteristic (ROC) curves and calculate the area under the curve (AUC). Unless otherwise specified, default parameters were used.
Results
Causal Effects of Circulating Inflammatory Proteins on OA
First, we conducted the forward two-sample MR analysis using 91 circulating inflammatory proteins as exposures and OA at any sites, hip OA, and knee OA as outcomes. All results were summarized in Supplementary Tables S4–S6. In addition, the causal effects of all 91 inflammatory proteins on OA based on IVW analysis were presented as a heatmap in Supplementary Figure S1. As shown in Figure 2, after excluding SNPs related to confounders, IVW analysis indicated that urokinase-type plasminogen activator (PLAU) levels have a potential protective effect on OA at any sites (OR = 0.97, 95% CI = 0.94~1.00, p = 0.040), and adenosine deaminase (ADA) levels (OR = 0.96, 95% CI = 0.92~0.99, p = 0.017) and C-C motif chemokine 19 (CCL19) levels (OR = 0.94, 95% CI = 0.89~0.99, p = 0.027) also have potential protective effects on hip OA. For knee OA, IVW analysis revealed that fractalkine (known as CX3CL1) levels (OR = 1.07, 95% CI = 1.01~1.13, p = 0.014), C-X-C motif chemokine 1 (CXCL1) levels (OR = 1.04, 95% CI = 1.00~1.09, p = 0.041), hepatocyte growth factor (HGF) levels (OR = 1.10, 95% CI = 1.03~1.17, p = 0.005) and interleukin-8 (IL8) levels (OR = 1.06, 95% CI = 1.01~1.12, p = 0.032) have suggestive casual associations with the occurrence of knee OA, while interleukin-10 receptor subunit alpha (IL10RA) levels (OR = 0.93, 95% CI = 0.88~0.99, p = 0.013) and latency-associated peptide transforming growth factor beta 1 (TGFB1) levels (OR = 0.94, 95% CI = 0.90~0.99, p = 0.015) have potential protective effects on knee OA. The results of the other four supplementary MR analyses all supported the findings of the IVW analysis (Figure 2). Scatter plots of the above causal relationships were shown in Figure 3.
 |
Figure 2 Positive MR results of causal effects of circulating inflammatory proteins on OA. The X-axis of the forest plot is log2 transformed. Abbreviations: OA, osteoarthritis; OR, odds ratio; CI, confidence interval; MR, Mendelian randomization; SNP, single nucleotide polymorphisms; IVW, inverse-variance weighted; MR-PRESSO, MR pleiotropy residual sum and outlier. |
 |
Figure 3 The scatter plots of causal effects of circulating inflammatory proteins on OA at any sites (A), Hip OA (B), and knee OA (C). Abbreviations: MR, Mendelian randomization; OA, osteoarthritis; SNP, single nucleotide polymorphisms. |
Further, we conducted sensitivity analyses. MR Egger intercept and MR PRESSO indicated that there was no evidence of horizontal pleiotropy (Figure 2, all PEgger intercept > 0.05 and P-PRESSSO global test > 0.05). IVW heterogeneity analysis showed that except for Urokinase-type plasminogen activator levels in OA at any sites (P = 0.0474) and hepatocyte growth factor levels in knee OA (P = 0.0426), which showed mild heterogeneity, there was no heterogeneity in other causal associations (P > 0.05). In addition, the leave-one-out analysis indicated that that there were no outlier SNPs (Figure 4).
 |
Figure 4 Leave-one-out plots for two sample MR results of causal effects of circulating inflammatory proteins on OA at any sites (A), Hip OA (B), and knee OA (C). Forest plot of causal estimates omitting each variant in turn. Abbreviations: MR, Mendelian randomization; OA, osteoarthritis. |
Bidirectional Causal Effects Between Circulating Inflammatory Proteins and OA
To evaluate reverse causal effects, we performed a reverse two-sample MR analysis using OA at any sites, hip OA, and knee OA as exposures and 91 circulating inflammatory proteins as outcomes. The results of the reverse two-sample MR analysis were summarized in Supplementary Tables S7–S9. The causal effects of OA on all 91 inflammatory proteins based on IVW analysis were presented as a heatmap in Supplementary Figure S2. The IVW analysis failed to identify any causal effects of OA at any sites on circulating inflammatory proteins (Supplementary Table S7). As shown in Figure 5, the IVW analysis revealed causal effects of hip OA on increased levels of caspase 8 (CASP8) (OR = 1.07, 95% CI = 1.00~1.15, p = 0.046), protein S100A12 (OR = 1.08, 95% CI = 1.00~1.15, p = 0.037), IL10RA (OR = 1.09, 95% CI = 1.01~1.19, p = 0.029), interleukin-7 (IL7) (OR = 1.08, 95% CI = 1.01~1.16, p = 0.028), and monocyte chemoattractant protein 2 (MCP2) (OR = 1.09, 95% CI = 1.02~1.17, p = 0.015). It also identified a causal effect of hip OA on reduced levels of fms-related tyrosine kinase 3 ligand (FLT3LG) (OR = 0.93, 95% CI = 0.87~1.00, p = 0.045). For knee OA, IVW analysis showed that there was a causal association between knee OA and decreased levels of interleukin-1-alpha (IL1A) (OR = 0.88, 95% CI = 0.78~0.99 p = 0.033), as well as a causal association between knee OA and increased levels of monocyte chemoattractant protein-3 (MCP3) (OR = 1.16, 95% CI = 1.02~1.31, p = 0.021). The results of the other four MR analyses all supported the results of the IVW analysis (Figure 5). Scatter plots of the above causal relationships were shown in Figure 6.
 |
Figure 5 Positive MR results of causal effects of OA on circulating inflammatory proteins. The X-axis of the forest plot is log2 transformed. Abbreviations: OA, osteoarthritis; OR, odds ratio; CI, confidence interval; MR, Mendelian randomization; SNP, single nucleotide polymorphisms; IVW, inverse-variance weighted; MR-PRESSO, MR pleiotropy residual sum and outlier. |
 |
Figure 6 The scatter plots of causal effects of Hip OA (A), and knee OA (B) on circulating inflammatory proteins. Abbreviations: MR, Mendelian randomization; OA, osteoarthritis; SNP, single nucleotide polymorphisms. |
For the sensitivity analysis of the causal associations mentioned above, neither MR Egger intercept nor MR PRESSO identified horizontal pleiotropy (Figure 5, all P−Egger intercept > 0.05 and P-PRESSSO global test > 0.05). IVW heterogeneity analysis also did not detect heterogeneity (all P > 0.05). Further, leave-one-out analysis revealed that there were no outlier SNPs (Figure 7).
 |
Figure 7 Leave-one-out plots for two sample MR results of causal effects of Hip OA (A), and knee OA (B) on circulating inflammatory proteins. Forest plot of causal estimates omitting each variant in turn. Abbreviations: MR, Mendelian randomization; OA, osteoarthritis. |
The Identification of OA-Related IRGs
The previous results confirmed the bidirectional causal relationship between inflammatory proteins and OA, and we further hope to explore inflammatory biomarkers associated with OA. By comparing the expression of IRGs between the OA group and the normal group in the GSE236924 cohort, we identified 92 DEIRGs, of which 75 IRGs were upregulated in OA and 17 IRGs were downregulated in OA (Supplementary Table S10). Figure 8A showed the top 10 upregulated and downregulated IRGs in a heatmap, and Figure 8B showed all DEIRGs in a volcano plot. Similarly, in the GSE114007 cohort, we identified 122 DEIRGs, of which 82 IRGs were upregulated and 40 IRGs were downregulated in OA (Supplementary Table S11). Figure 8C showed the top 10 upregulated or downregulated IRGs in the GSE114007 cohort, and Figure 8D showed all DEIRGs in a volcano plot. Subsequently, by taking the intersection of DEIRGs from GSE236924 and GSE114007, we ultimately identified 48 OA-related IRGs (Figure 8E and Supplementary Table S12).
 |
Figure 8 The identification of DEIRGs in OA. (A) The heatmap shows the expression of the top 10 up- and down-regulated IRGs in GSE236924. The red block indicates upregulation, reflecting increased gene expression in OA, whereas the blue block indicates downregulation, indicating decreased gene expression. (B) Volcano plot of all DEIRGs between OA group and normal group in GSE236924, with significantly upregulated labelled in red and downregulated in green. (C) The heatmap shows the expression of the top 10 up- and down-regulated IRGs in GSE114007. The red block indicates upregulation, reflecting increased gene expression in OA, whereas the blue block indicates downregulation, indicating decreased gene expression. (D) Volcano plot of all DEIRGs between OA group and normal group in GSE114007, with significantly upregulated labelled in red and downregulated in green. (E) The intersection of IRDEGs between GSE236924 and GSE114007. |
Functional Enrichment Analysis of OA-Related IRGs
We performed functional enrichment analysis on 48 OA-related IRGs to explore their potential functions. These OA-related IRGs were mainly enriched in immune-related biological processes such as “immune system process” and “inflammatory response” in the GO BP terms (Figure 9A). In terms of GO CC, they were enriched in vesicle-related cellular components such as “vesicle”, “cytoplasmic vesicle” and “intracellular vesicle” (Figure 9B). In terms of GO MF, they were enriched in cytokine-related molecular functions such as “cytokine activity”, “cytokine receptor binding” and “cytokine binding” (Figure 9C). It is worth noting that OA-related IRGs were also enriched in immune-related KEGG pathways such as “cytokine-cytokine receptor interaction”, “NF-kappa B signaling pathway” and “leukocyte transendothelial migration” (Figure 9D).
 |
Figure 9 Enrichment analysis of OA-related IRGs. (A–C) Bubble plots of GO enrichment in biological process terms (A), cellular component terms (B), and molecular function terms (C). (D) Bubble plot of KEGG pathway analysis. |
The Identification of Key OA-Related IRGs
Initially, we established a preliminary PPI network based on 48 OA-related IRGs to identify hub genes (Supplementary Figure S3). Three IRGs were subsequently excluded due to their lack of correlation with other IRGs, resulting in 45 genes for the PPI network construction (Figure 10A). To pinpoint hub genes within this network, we employed three algorithms through the Cytoscape plug-in to identify the top 20 hub genes. Figure 10B–D illustrated the top 20 hub genes identified by each algorithm. A Venn diagram was used to show the overlap among the top 20 hub genes across the three methods (Figure 10E), leading to the identification of 17 overlapping genes as the final hub genes (Supplementary Table S13). Finally, we applied the random forest algorithm to assess the significance of these 17 hub genes, ultimately identifying six key OA-related IRGs (CD4, SELP, SYK, IGF1, CCL4, CYBB) that may serve as potential inflammatory biomarkers for diagnosing OA patients (Figure 10F).
 |
Figure 10 Construction of the PPI network and selection of hub genes. (A) The PPI network of 45 OA‐related IRGs was represented using STRING, excluding three IRGs due to a lack of interaction. (B–D) degree (B), betweenness (C) and closeness (D) algorithms were used to select the top 20 hub genes in Cytoscape, with darker colors indicating greater significance. (E) The intersection of top 20 hub genes from degree, betweenness and closeness algorithms. (F) Mean decrease accuracy based on random forest algorithm was used to rank the predictive importance of OA-related IRGs and screen out the six most important key OA-related IRGs. |
The Diagnostic Value of Key OA-Related IRGs
As illustrated in Figure 11A, the GSE236924 cohort revealed a notable upregulation of CD4, SELP, SYK, IGF1, CCL4 and CYBB in joint tissue samples of KOA/HOA compared to normal tissues. ROC curve analyses indicated that all six IRGs demonstrated promising diagnostic efficacy. Figure 10B–G presented the AUCs and 95% CIs for each gene: CD4 (AUC:0.91, 95% CI: 0.75–1.00), SELP (AUC:0.97, 95% CI: 0.93–1.00), SYK (AUC:0.89, 95% CI: 0.69–1.00), IGF1 (AUC: 0.89, 95% CI: 0.69–1.00), CCL4 (AUC:0.93, 95% CI: 0.85–1.00), CYBB (AUC:0.96, 95% CI: 0.90–1.00). In the GSE114007 cohort, the expression levels of the six IRGs were similarly significantly elevated in OA samples (Figure 11H). ROC curve analyses indicated that these IRGs also exhibited strong diagnostic performance within the GSE114007 cohort (Figure 11I–N).
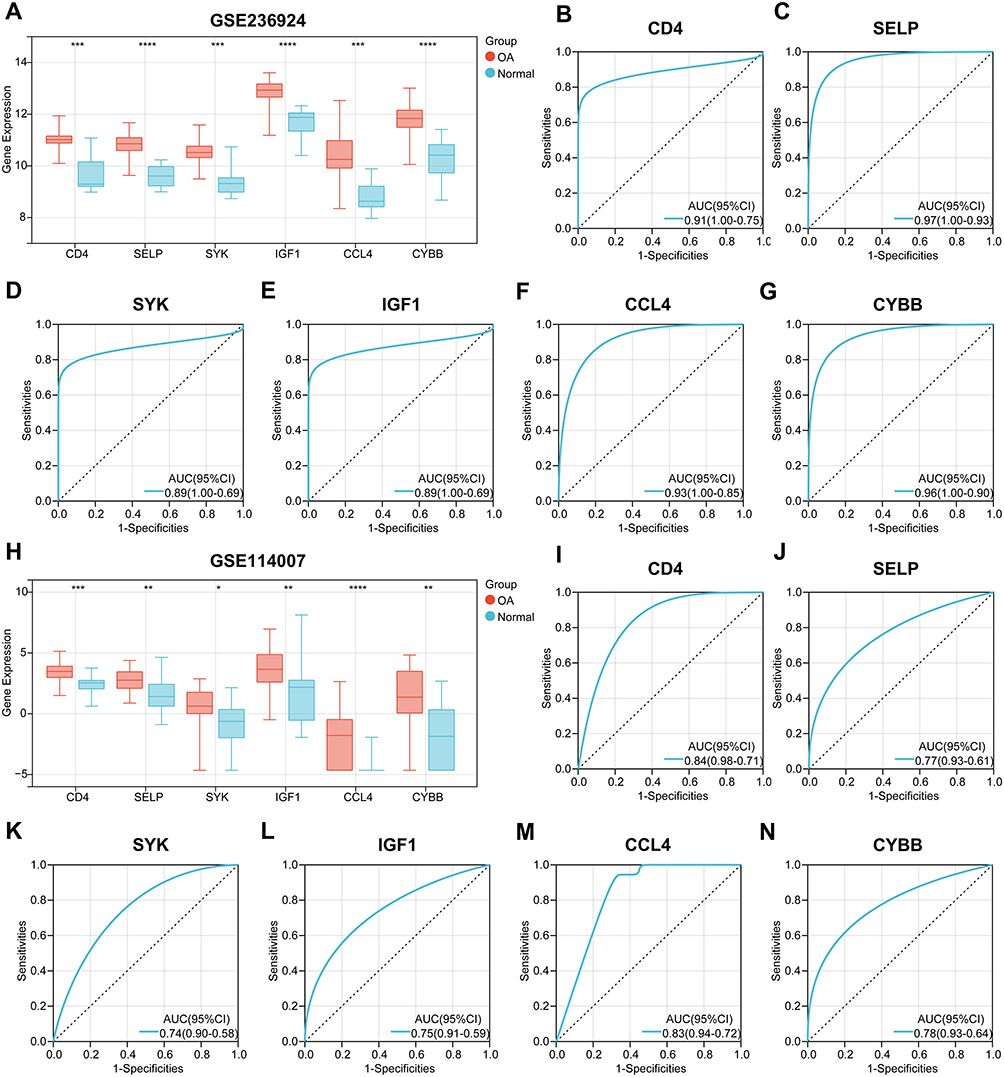 |
Figure 11 Evaluation of the diagnostic value of six key OA-related IRGs. (A) The expression differences of CD4, SELP, SYK, IGF1, CCL4 and CYBB between OA and normal tissues in GSE236924 cohort. (B–D) The ROC curves were used to evaluate the diagnostic efficacy of CD4 (B), SELP (C), SYK (D), IGF1 (E), CCL4 (F) and CYBB (G) in identifying OA in GSE236924 cohort, showing the AUC and 95% CI in each panel. (H) The expression differences of CD4, SELP, SYK, IGF1, CCL4 and CYBB between OA and normal tissues in GSE114007 cohort. (I–N) The ROC curves were used to evaluate the diagnostic efficacy of CD4 (I), SELP (J), SYK (K), IGF1 (L), CCL4 (M) and CYBB (N) in identifying OA in GSE114007 cohort, showing the AUC and 95% CI in each panel. *, p < 0.05; **, p < 0.01; ***, p < 0.001; ****, p < 0.0001. |
Discussion
OA is a common disease that severely impairs the quality of life for patients and imposes a significant economic burden on society.13,14 It is necessary to further explore the pathogenesis and biomarkers of OA in order to improve its prognosis. Existing studies have indicated a close association between OA and inflammation,19,20 however, the causal relationship and direction between OA and inflammatory proteins still needs to be revealed. In this study, we included the currently largest GWAS summary data of OA (177,517 cases and 649,173 controls) and the recently published GWAS summary data of 91 circulating inflammatory proteins including up to 14,824 participants for bidirectional two-sample MR analysis. In addition, we integrated transcriptome sequencing data of OA and IRGs list to explore the inflammation-related biomarkers of OA. This study suggests for the causal effects between OA and circulating inflammatory proteins and identifies important inflammatory markers in OA.
According to our findings, genetically determined levels of PLAU, ADA, CCL19, IL10RA, and TGFB1 are associated with a reduced risk of one of the three types of OA (OA at any sites, HOA and KOA), while levels of CX3CL1, CXCL1, HGF, and IL8 are associated with an increased risk of knee OA. Previous studies have shown that PLAU is involved in the NF-κB signaling pathway and affects inflammation response.49 OA and rheumatoid arthritis (RA) differ significantly in terms of etiology and pathophysiology. A recent study has indicated that the expression of PLAU in macrophages of OA patients is significantly lower than that in macrophages of RA patients,50 suggesting that PLAU may impact the disease through macrophages. ADA has the ability to convert adenosine into inosine.51 Previous reports have shown that inosine exerts anti-inflammatory effects in the human body after binding to specific G protein-coupled adenosine receptors.52,53 This may be a potential mechanism through which ADA reduces the risk of OA. Interestingly, although CCL19 is significantly upregulated in synovial tissues of RA, its expression remains unchanged in synovial tissues of OA.54 Additionally, CCL19 could not be detected in the conditioned medium generated from pathological tissues of OA patients.55 Although there is currently no research exploring the relationship between IL10RA and OA, it is known that IL10RA can mediate the immunosuppressive signal of IL10, thereby inhibiting the synthesis of pro-inflammatory cytokines.56 Combined with our study, it is valuable to further reveal the mechanism by which IL10RA reduces the risk of OA. It is known that the TGF-β pathway plays a significant role in the development of OA and the regulation of cartilage homeostasis.57,58 An increasing number of in vivo and in vitro studies have shown that inhibition of the TGF-β pathway can lead to imbalance of chondrocyte homeostasis and matrix degradation, thereby causing cartilage damage and OA.59,60 TGF-β is also involved in OA fibrosis.61 The study by Shen et al showed that TGF β RII knockout mice exhibited progressive OA.62 These studies strongly support our results that TGFB1 has a close causal relationship in the pathogenesis of OA. To date, several studies have demonstrated the involvement of CX3CL1 in the occurrence and OA.63,64 The study conducted by Hou et al found that CXCL1 promotes OA by facilitating the expression of IL6, which is consistent with our study.65 The roles of HGF and IL8 in the pathogenesis of OA have also been extensively studied.66,67 It is well known that IL-8 is increased in the synovium, infrapatellar fat pad, cartilage, etc. of OA patients.66 These studies are predominantly observational, based on population or in vitro/vivo models. Although they have demonstrated the correlation between these circulating inflammatory proteins and OA, they do not establish causal relationships. Our study, on the one hand, serves as a supplementary and supportive research to the existing studies. Simultaneously, it provides evidence in genetic level for the impact of these inflammatory proteins on the occurrence of OA. However, it is worth noting that Huang et al also used MR methods to explore the genetic effects of 29 circulating inflammatory cytokines on OA.68 Interestingly, there are some differences between the results of Huang et al and the results of this study. For example, IL8 was associated with an increased risk of knee OA in this study, but this association was not significant in the study of Huang et al. In contrast, IL7 may be associated with an increased risk of hip OA in the study of Huang et al, but this association was not found in this study. We speculate that the reasons for these differences are as follows: 1. The sources of the GWAS summary data of inflammatory proteins in the two studies are different. 2. The two studies used different IVs selection thresholds. These differences also suggest that more GWAS studies are needed in the future to verify and expand the results.
In reverse MR analysis, we found that OA affected the levels of several circulating inflammatory proteins, including CASP8, S100A12, IL10RA, IL7, MCP2, FLT3LG, IL1A, and MCP3. It is worth noting that the expression of IL10RA is associated with a lower risk of knee OA, while hip OA is correlated with increased levels of IL10RA. This indicates a bidirectional causal effect between IL10RA and OA. It also suggests that the causal direction of inflammatory proteins may vary in different types of OA, which warrants further exploration. CASP8 is a well-known apoptosis-related protein, and OA is often associated with the destruction and apoptosis of chondrocytes, therefore, it is logical for OA to increase the levels of CASP8. In fact, Mistry et al have also confirmed the elevated levels of CASP8 in a mouse model of OA.69 Previous studies have also confirmed that the expression of S100A12 is increased in OA and could reflect the severity of OA.70,71 An animal model study showed that IL7 secretion is increased in OA patients,72 and IL7 is also commonly recognized as a marker of OA,73 which supports our findings. Although several other circulating inflammatory proteins affected by OA have been poorly studied or have unclear results in OA, our study provides causal evidence for OA and the levels of these inflammatory proteins, which needs to be confirmed by more studies.
In this study, we identified six potential inflammatory biomarkers (CD4, SELP, SYK, IGF1, CCL4 and CYBB) for OA. Previous studies have also supported the feasibility of these IRGs as OA biomarkers. For example, CD4 is a well-known T cell marker, and a recent study has shown that CD4+ T cells promote joint degeneration and increase the expression of the aging marker CDKN1A by promoting IL-17 expression, thus regulating the response of OA to injury.74 The study by Teng et al also supports the potential causal effect of CD4+ T cells on OA.75 The function of SELP is to stimulate leukocyte adhesion at the injury site. A previous study confirmed that the genetic variation of SELP may play a role in the pathogenesis of OA.76 A large number of studies have confirmed the important role of SYK in OA. For example, Novikov et al found that inhibiting SYK could protect bone and cartilage in OA.77 Wang et al found that SYK axis mediated mast cell activation promoted inflammation and cartilage destruction in OA.78 IGF1 is a member of the growth factor family, which can promote chondrocyte proliferation, enhance matrix production and inhibit chondrocyte apoptosis. Wen et al reviewed in detail the role of IGF1 in cartilage anabolism and catabolism and the application potential in OA treatment.79 The study of Yang et al confirmed that upregulation of CCL4 could inhibit chondrocyte apoptosis and promote its proliferation in OA by activating NF-κB signaling pathway.80 Regarding CYBB, a recent study also identified CYBB as a diagnostic gene for OA and found that nimesulide inhibited chondrocyte necroptosis in OA by reducing CYBB expression.81 These studies strongly support the inflammation-related OA biomarkers identified in this study.
This study utilized MR analysis to explore the causal association between OA and circulating inflammatory proteins and identified potential inflammatory biomarkers using transcriptome data. Compared to observational studies, MR analysis avoids potential confounding factors and unclear causal directions. Furthermore, this study incorporated the largest GWAS data for OA and the latest GWAS data for 91 circulating inflammatory proteins, enhancing the reliability of our results. Lastly, multiple sensitivity analyses increased the robustness of the findings. Despite these advantages, our study still has some limitations. Firstly, due to limitations in the original GWAS summary data, we were unable to conduct stratified analyses by gender and age. Secondly, since the data included in this study were predominantly from individuals of European descent, extrapolating the results to populations of other ancestry is limited. Thirdly, as an exploratory study, we did not use adjusted p-values. Fourthly, although we made efforts to eliminate the influence of confounding factors, we cannot exclude the potential influence of third-party factors. It is necessary to further validate the results in future studies. Fifthly, the sample size of the control group in the GSE236924 cohort was relatively small, which may lead to bias of the differential expression analysis. Sixthly, previous MR studies may affect the novelty of this study, but they also strengthen the conclusions of this work. Lastly, the inflammation-related OA biomarkers we identified need further confirmation in prospective studies.
Conclusion
In conclusion, our results support the causal relationship between OA and specific circulating inflammatory proteins and identify six key inflammation-related OA biomarkers. Developing strategies for the prevention, diagnosis, and treatment of OA based on inflammatory proteins may hold promise.
Abbreviations
OA, Osteoarthritis; RCT, Randomized controlled trial; MR, Mendelian randomization; GWAS, Genome-wide association studies; SNP, Single nucleotide polymorphism; IV, Instrumental variables; IVW, Inverse variance-weighted; PLAU, Urokinase-type plasminogen activator; ADA, Adenosine deaminase; CCL19, C-C motif chemokine 19; CCL1, C-X-C motif chemokine 1; HGF, Hepatocyte growth factor; IL8, Interleukin-8; IL10RA, Interleukin-10 receptor subunit alpha; TGFB1, Transforming growth factor beta 1; CASP8, Caspase 8; IL7, Interleukin-7; MCP2, Monocyte chemoattractant protein 2; FLT3LG, Fms-related tyrosine kinase 3 ligand; IL1A, Interleukin-1-alpha; MCP3, Monocyte chemoattractant protein-3.
Data Sharing Statement
The GWAS summary data of OA can be downloaded download from The Musculoskeletal Knowledge Portal (https://mskkp.org). The GWAS summary data of circulating inflammatory proteins can be downloaded from GWAS catalog (https://www.ebi.ac.uk/gwas/publications/37563310). The GSE236924 and GSE114007 cohorts were obtained from the Gene Expression Omnibus database (https://www.ncbi.nlm.nih.gov/gds).
Ethics Approval and Consent to Participate
According to item 1 and 2 of Article 32 of the Measures for Ethical Review of Life Science and Medical Research Involving Human Subjects dated February 18, 2023, China, research projects meeting one of the following conditions may be exempted from ethical review: Conducting research using legally obtained public data or data generated through observation without interfering with public behavior; conducting research using anonymized information data.
Author Contributions
All authors made a significant contribution to the work reported, whether that is in the conception, study design, execution, acquisition of data, analysis and interpretation, or in all these areas; took part in drafting, revising or critically reviewing the article; gave final approval of the version to be published; have agreed on the journal to which the article has been submitted; and agree to be accountable for all aspects of the work.
Funding
There is no funding to report.
Disclosure
The authors declared no potential conflicts of interest in this work.
References
1. Aresti N, Kassam J, Nicholas N, Achan P. Hip osteoarthritis. BMJ. 2016;354:i3405. doi:10.1136/bmj.i3405
2. Fontanella CG, Belluzzi E, Pozzuoli A, et al. Exploring Anatomo-Morphometric Characteristics of Infrapatellar, Suprapatellar Fat Pad, and Knee Ligaments in Osteoarthritis Compared to Post-Traumatic Lesions. Biomedicines. 2022;10(6):1369. doi:10.3390/BIOMEDICINES10061369
3. Hu Y, Chen X, Wang S, Jing Y, Su J. Subchondral bone microenvironment in osteoarthritis and pain. Bone Res. 2021;9(1):1–13. doi:10.1038/s41413-021-00147-z
4. Yin B, Ni J, Witherel CE, et al. Harnessing tissue-derived extracellular vesicles for osteoarthritis theranostics. Theranostics. 2022;27(1):207–231. doi:10.7150/THNO.62708
5. Zou Z, Li H, Yu K, et al. The potential role of synovial cells in the progression and treatment of osteoarthritis. Exploration. 2023;3(5):20220132. doi:10.1002/EXP.20220132
6. Nüesch E, Dieppe P, Reichenbach S, Williams S, Iff S, Jüni P. All cause and disease specific mortality in patients with knee or Hip osteoarthritis: population based cohort study. BMJ. 2011;342(7798):638. doi:10.1136/BMJ.D1165
7. Drummen SJJ, Runhaar J, Bierma-Zeinstra SM, et al. Early-stage vs established knee osteoarthritis: a comparative observational study on prevalence and changes in pain, function and quality of life after supervised exercise and education among 10,365 patients. Osteoarthr Cartil. 2024;33(3):364–372. doi:10.1016/j.joca.2024.11.007
8. Hunter DJ, Bierma-Zeinstra S. Osteoarthritis. Lancet. 2019;393(10182):1745–1759. doi:10.1016/S0140-6736(19)30417-9/ASSET/20A9DE8C-08A4-4EB9-8439-5447D2AF4C7A/MAIN.ASSETS/GR4.SML
9. Cross M, Smith E, Hoy D, et al. The global burden of Hip and knee osteoarthritis: estimates from the Global Burden of Disease 2010 study. Ann Rheum Dis. 2014;73(7):1323–1330. doi:10.1136/ANNRHEUMDIS-2013-204763/ATTACHMENT/AEDF428A-D5E7-45CB-8BEB-BAF1DC9CFDF0/MMC1.PDF
10. Yang J, Liu P, Wang S, Jiang T, Zhang Y, Liu W. Causal relationship between sarcopenia and osteoarthritis: a bi-directional two-sample Mendelian randomized study. Eur J Med Res. 2023;28(1):1–9. doi:10.1186/s40001-023-01322-0
11. Safiri S, Kolahi AA, Smith E, et al. Global, regional and national burden of osteoarthritis 1990–2017: a systematic analysis of the Global Burden of Disease Study 2017. Ann Rheum Dis. 2020;79(6):819–828. doi:10.1136/annrheumdis-2019-216515
12. Hunter DJ, Schofield D, Callander E. The individual and socioeconomic impact of osteoarthritis. Nat Rev Rheumatol. 2014;10(7):437–441. doi:10.1038/nrrheum.2014.44
13. Kloppenburg M, Berenbaum F. Osteoarthritis year in review 2019: epidemiology and therapy. Osteoarthr Cartil. 2020;28(3):242–248. doi:10.1016/j.joca.2020.01.002
14. Abbafati C, Abbas KM, Abbasi M, et al. Global burden of 369 diseases and injuries in 204 countries and territories, 1990–2019: a systematic analysis for the Global Burden of Disease Study 2019. Lancet. 2020;396(10258):1204–1222. doi:10.1016/S0140-6736(20)30925-9
15. Medzhitov R. Origin and physiological roles of inflammation. Nature. 2008;454(7203):428–435. doi:10.1038/NATURE07201
16. Kay J, Thadhani E, Samson L, Engelward B. Inflammation-induced DNA damage, mutations and cancer. DNA Repair (Amst). 2019;83. doi:10.1016/J.DNAREP.2019.102673.
17. Long C, Song Y, Pan Y, Wu C. Identification of molecular subtypes and a risk model based on inflammation-related genes in patients with low grade glioma. Heliyon. 2023;9(12):e22429. doi:10.1016/j.heliyon.2023.e22429
18. Zhao JH, Stacey D, Eriksson N, et al. Genetics of circulating inflammatory proteins identifies drivers of immune-mediated disease risk and therapeutic targets. Nat Immunol. 2023;24(9):1540. doi:10.1038/S41590-023-01588-W
19. Shen J, Abu-Amer Y, O’Keefe RJ, McAlinden A. Inflammation and epigenetic regulation in osteoarthritis. Connect Tissue Res. 2017;58(1):49–63. doi:10.1080/03008207.2016.1208655
20. Pincus T. Clinical evidence for osteoarthritis as an inflammatory disease. Curr Rheumatol Rep. 2001;3(6):524–534. doi:10.1007/S11926-001-0068-4
21. Kunisch E, Kinne RW, Alsalameh RJ, Alsalameh S. Pro-inflammatory IL-1beta and/or TNF-alpha up-regulate matrix metalloproteases-1 and −3 mRNA in chondrocyte subpopulations potentially pathogenic in osteoarthritis: in situ hybridization studies on a single cell level. Int J Rheum Dis. 2016;19(6):557–566. doi:10.1111/1756-185X.12431
22. Robinson WH, Lepus CM, Wang Q, et al. Low-grade inflammation as a key mediator of the pathogenesis of osteoarthritis. Nat Rev Rheumatol. 2016;12(10):580–592. doi:10.1038/NRRHEUM.2016.136
23. Berenbaum F, Walker C. Osteoarthritis and inflammation: a serious disease with overlapping phenotypic patterns. Postgrad Med. 2020;132(4):377–384. doi:10.1080/00325481.2020.1730669
24. Marchev AS, Dimitrova PA, Burns AJ, Kostov RV, Dinkova-Kostova AT, Georgiev MI. Oxidative stress and chronic inflammation in osteoarthritis: can NRF2 counteract these partners in crime? Ann N Y Acad Sci. 2017;1401(1):114–135. doi:10.1111/NYAS.13407
25. Smith GD, Ebrahim S. Mendelian randomization”: can genetic epidemiology contribute to understanding environmental determinants of disease? Int J Epidemiol. 2003;32(1):1–22. doi:10.1093/ije/dyg070
26. Bothwell LE, Greene JA, Podolsky SH, Jones DS. Assessing the Gold Standard--Lessons from the History of RCTs. N Engl J Med. 2016;374(22):2175–2181. doi:10.1056/NEJMMS1604593
27. Ference BA, Holmes MV, Smith GD. Using Mendelian randomization to improve the design of randomized trials. Cold Spring Harb Perspect Biol. 2021;13(7). doi:10.1101/cshperspect.a040980
28. Sekula P, Del Greco FM, Pattaro C, Köttgen A. Mendelian randomization as an approach to assess causality using observational data. J Am Soc Nephrol. 2016;27(11):3253–3265. doi:10.1681/ASN.2016010098
29. Wu C, Luo F, Zhu Y, et al. Deciphering the Potential Causal and Prognostic Relationships Between Gut Microbiota and Brain Tumors: insights from Genetics Analysis and Machine Learning. Exploration. 2025:e20240087. doi:10.1002/EXP.20240087.
30. Pan Y, Sun X, Tan J, et al. Genetic Biomarkers and Circulating White Blood Cells in Osteoarthritis: a Bioinformatics and Mendelian Randomization Analysis. Biomedicines. 2025;13(1):90. doi:10.3390/BIOMEDICINES13010090
31. Burgess S, Small DS, Thompson SG. A review of instrumental variable estimators for Mendelian randomization. Stat Methods Med Res. 2017;26(5):2333–2355. doi:10.1177/0962280215597579
32. Zhang J, Li K, Qiu X. Exploring causal correlations between inflammatory cytokines and knee osteoarthritis: a two-sample Mendelian randomization. Front Immunol. 2024;15. doi:10.3389/FIMMU.2024.1362012.
33. Xu L, Ma J, Yu Q, et al. Evidence supported by Mendelian randomization: impact on inflammatory factors in knee osteoarthritis. Front Med. 2024;11:1382836. doi:10.3389/FMED.2024.1382836/FULL
34. Lin R, Zheng Q, Zhang R, et al. Causal effects of circulating inflammatory proteins on knee and Hip osteoarthritis: a two sample Mendelian randomization study. Clin Rheumatol. 2024;44(1):465–473. doi:10.1007/S10067-024-07232-8/FIGURES/3
35. Sun Y, Yang H, Guo J, Du J, Han S, Yang X. Identification of HTRA1, DPT and MXRA5 as potential biomarkers associated with osteoarthritis progression and immune infiltration. BMC Musculoskelet Disord. 2024;25(1):647. doi:10.1186/S12891-024-07758-7
36. Yang J, Zhou P, Xu T, et al. Identification of biomarkers related to tryptophan metabolism in osteoarthritis. Biochem Biophys Reports. 2024;39:101763. doi:10.1016/j.bbrep.2024.101763
37. Lu Y, Tang H, Huang P, et al. Assessment of causal effects of visceral adipose tissue on risk of cancers: a Mendelian randomization study. Int J Epidemiol. 2022;51(4):1204–1218. doi:10.1093/IJE/DYAC025
38. Boer CG, Hatzikotoulas K, Southam L, et al. Deciphering osteoarthritis genetics across 826,690 individuals from 9 populations. Cell. 2021;184(18):4784–4818.e17. doi:10.1016/j.cell.2021.07.038
39. Xie MM, Dai B, Hackney JA, et al. An agonistic anti-signal regulatory protein α antibody for chronic inflammatory diseases. Cell Reports Med. 2023;4(8):101130. doi:10.1016/J.XCRM.2023.101130
40. Fisch KM, Gamini R, Alvarez-Garcia O, et al. Identification of transcription factors responsible for dysregulated networks in human osteoarthritis cartilage by global gene expression analysis. Osteoarthr Cartil. 2018;26(11):1531–1538. doi:10.1016/J.JOCA.2018.07.012
41. Burgess S, Butterworth A, Thompson SG. Mendelian randomization analysis with multiple genetic variants using summarized data. Genet Epidemiol. 2013;37(7):658–665. doi:10.1002/gepi.21758
42. Bowden J, Smith GD, Burgess S. Mendelian randomization with invalid instruments: effect estimation and bias detection through Egger regression. Int J Epidemiol. 2015;44(2):512–525. doi:10.1093/ije/dyv080
43. Bowden J, Davey Smith G, Haycock PC, Burgess S. Consistent Estimation in Mendelian Randomization with Some Invalid Instruments Using a Weighted Median Estimator. Genet Epidemiol. 2016;40(4):304–314. doi:10.1002/gepi.21965
44. Hartwig FP, Smith GD, Bowden J. Robust inference in summary data Mendelian randomization via the zero modal pleiotropy assumption. Int J Epidemiol. 2017;46(6):1985–1998. doi:10.1093/ije/dyx102
45. Verbanck M, Chen CY, Neale B, Do R. Detection of widespread horizontal pleiotropy in causal relationships inferred from Mendelian randomization between complex traits and diseases. Nat Genet. 2018;50(5):693–698. doi:10.1038/s41588-018-0099-7
46. Ritchie ME, Phipson B, Wu D, et al. Limma powers differential expression analyses for RNA-sequencing and microarray studies. Nucleic Acids Res. 2015;43(7):e47. doi:10.1093/nar/gkv007
47. Yu G, Wang LG, Han Y, He QY. ClusterProfiler: an R package for comparing biological themes among gene clusters. Omi A J Integr Biol. 2012;16(5):284–287. doi:10.1089/omi.2011.0118
48. Cancer Genome Atlas Research. Comprehensive, Integrative Genomic Analysis of Diffuse Lower-Grade Gliomas. N Engl J Med. 2015;372(26):2481–2498. doi:10.1056/nejmoa1402121
49. Hu M, Jia LH, Wang M. PLAU contributes to the development of cholangiocarcinoma via activating NF-κB signaling pathway. Cell Biol Int. 2023;47(8):1381–1391. doi:10.1002/CBIN.12025
50. Li X, Sun H, Li H, et al. A Single-Cell RNA-Sequencing Analysis of Distinct Subsets of Synovial Macrophages in Rheumatoid Arthritis. DNA Cell Biol. 2023;42(4):212–222. doi:10.1089/dna.2022.0509
51. Van Der Weyden MB, Kelley WN. Human adenosine deaminase. Distribution and properties. J Biol Chem. 1976;251(18):5448–5456. doi:10.1016/S0021-9258(17)33080-6
52. Odashima M, Bamias G, Rivera-Nieves J, et al. Activation of A2A adenosine receptor attenuates intestinal inflammation in animal models of inflammatory bowel disease. Gastroenterology. 2005;129(1):26–33. doi:10.1053/j.gastro.2005.05.032
53. Milne GR, Palmer TM. Anti-Inflammatory and Immunosuppressive Effects of the A2A Adenosine Receptor. Sci World J. 2011;11:320. doi:10.1100/TSW.2011.22
54. Pickens SR, Chamberlain ND, Volin MV, Pope RM, Mandelin AM, Shahrara S. Characterization of CCL19 and CCL21 in Rheumatoid Arthritis. Arthritis Rheum. 2011;63(4):914. doi:10.1002/ART.30232
55. Belluzzi E, Olivotto E, Toso G, et al. Conditioned media from human osteoarthritic synovium induces inflammation in a synoviocyte cell line. Connect Tissue Res. 2019;60(2):136–145. doi:10.1080/03008207.2018.1470167
56. Patik I, Redhu NS, Eran A, et al. The IL-10 receptor inhibits cell extrinsic signals necessary for STAT1-dependent macrophage accumulation during colitis. Mucosal Immunol. 2023;16(3):233–249. doi:10.1016/J.MUCIMM.2023.02.006
57. Wu C, Jiao H, Lai Y, et al. Kindlin-2 controls TGF-β signalling and Sox9 expression to regulate chondrogenesis. Nat Commun. 2015;6(1). doi:10.1038/NCOMMS8531
58. Zhao W, Wang T, Luo Q, et al. Cartilage degeneration and excessive subchondral bone formation in spontaneous osteoarthritis involves altered TGF-β signaling. J Orthop Res. 2016;34(5):763–770. doi:10.1002/JOR.23079
59. Wang W, Song B, Anbarchian T, Shirazyan A, Sadik JE, Lyons KM. Smad2 and Smad3 Regulate Chondrocyte Proliferation and Differentiation in the Growth Plate. PLoS Genet. 2016;12(10):e1006352. doi:10.1371/JOURNAL.PGEN.1006352
60. Yan J, Li J, Hu J, et al. Smad4 deficiency impairs chondrocyte hypertrophy via the Runx2 transcription factor in mouse skeletal development. J Biol Chem. 2018;293(24):9162. doi:10.1074/JBC.RA118.001825
61. Blaney Davidson EN, Vitters EL, van den Berg WB, van der Kraan PM. TGF β-induced cartilage repair is maintained but fibrosis is blocked in the presence of Smad7. Arthritis Res Ther. 2006;8(3):R65. doi:10.1186/AR1931
62. Shen J, Li J, Wang B, et al. Deletion of the Transforming Growth Factor β Receptor Type II Gene in Articular Chondrocytes Leads to a Progressive Osteoarthritis-like Phenotype in Mice. Arthritis Rheum. 2013;65(12):3107. doi:10.1002/ART.38122
63. Guo YN, Cui SJ, Tian YJ, et al. Chondrocyte apoptosis in temporomandibular joint osteoarthritis promotes bone resorption by enhancing chemotaxis of osteoclast precursors. Osteoarthr Cartil. 2022;30(8):1140–1153. doi:10.1016/J.JOCA.2022.04.002
64. Jones B, Koch AE, Ahmed S. Pathological Role of Fractalkine/CX3CL1 in Rheumatic Diseases: a Unique Chemokine with Multiple Functions. Front Immunol. 2011;2(JAN). doi:10.3389/FIMMU.2011.00082
65. Hou SM, Chen PC, Lin CM, Fang ML, Chi MC, Liu JF. CXCL1 contributes to IL-6 expression in osteoarthritis and rheumatoid arthritis synovial fibroblasts by CXCR2, c-Raf, MAPK, and AP-1 pathway. Arthritis Res Ther. 2020;22(1). doi:10.1186/S13075-020-02331-8
66. Tonomura H, Takahashi K, Nagae M, Takatori R, Ishibashi H, Itsuji T. The Potential Role of Hepatocyte Growth Factor in Degenerative Disorders of the Synovial Joint and Spine. Int J Mol Sci. 2020;21(22):1–11. doi:10.3390/IJMS21228717
67. Huang S, Thomsson KA, Jin C, et al. Truncated lubricin glycans in osteoarthritis stimulate the synoviocyte secretion of VEGFA, IL-8, and MIP-1 α: interplay between O-linked glycosylation and inflammatory cytokines. Front Mol Biosci. 2022;9. doi:10.3389/FMOLB.2022.942406
68. Huang G, Li W, Kan H, Lu X, Liao W, Zhao X. Genetic influences of the effect of circulating inflammatory cytokines on osteoarthritis in humans. Osteoarthr Cartil. 2023;31(8):1047–1055. doi:10.1016/J.JOCA.2022.12.007
69. Mistry D, Oue Y, Chambers MG, Kayser MV, Mason RM. Chondrocyte death during murine osteoarthritis. Osteoarthr Cartil. 2004;12(2):131–141. doi:10.1016/j.joca.2003.10.006
70. Nakashima M, Sakai T, Hiraiwa H, et al. Role of S100A12 in the pathogenesis of osteoarthritis. Biochem Biophys Res Commun. 2012;422(3):508–514. doi:10.1016/J.BBRC.2012.05.036
71. Wang LC, Zhang HY, Shao L, et al. S100A12 levels in synovial fluid may reflect clinical severity in patients with primary knee osteoarthritis. Biomarkers. 2013;18(3):216–220. doi:10.3109/1354750X.2013.766262
72. Stone AV, Vanderman KS, Willey JS, et al. Osteoarthritic changes in vervet monkey knees correlate with meniscus degradation and increased matrix metalloproteinase and cytokine secretion. Osteoarthritis Cartilage. 2015;23(10):1780. doi:10.1016/J.JOCA.2015.05.020
73. Jia S, Yu Z, Bai L. Exerkines and osteoarthritis. Front Physiol. 2023;14. doi:10.3389/FPHYS.2023.1302769.
74. Faust HJ, Zhang H, Han J, et al. IL-17 and immunologically induced senescence regulate response to injury in osteoarthritis. J Clin Invest. 2020;130(10):5493–5507. doi:10.1172/JCI134091
75. Teng M, Wang J, Su X, et al. Associations between immune cells signatures and osteoarthritis: an integrated analysis of bidirectional Mendelian randomization and Bayesian colocalization. Cytokine. 2024;179:156633. doi:10.1016/J.CYTO.2024.156633
76. Gari MA, AlKaff M, Alsehli HS, et al. Identification of novel genetic variations affecting osteoarthritis patients. BMC Med Genet. 2016;17(Suppl 1). doi:10.1186/S12881-016-0330-2
77. Novikov FN, Panova MV, Titov IY, Stroylov VS, Stroganov OV, Chilov GG. Inhibition of SYK and cSrc kinases can protect bone and cartilage in preclinical models of osteoarthritis and rheumatoid arthritis. Sci Reports. 2021;11(1):1–14. doi:10.1038/s41598-021-02568-6
78. Wang Q, Lepus CM, Raghu H, et al. IgE-mediated mast cell activation promotes inflammation and cartilage destruction in osteoarthritis. Elife. 2019;8. doi:10.7554/ELIFE.39905
79. Wen C, Xu L, Xu X, Wang D, Liang Y, Duan L. Insulin-like growth factor-1 in articular cartilage repair for osteoarthritis treatment. Arthritis Res Ther. 2021;23(1). doi:10.1186/S13075-021-02662-0
80. Yang DW, Qian G, Jiang MJ, Wang P, Wang KZ. Inhibition of microRNA-495 suppresses chondrocyte apoptosis through activation of the NF-κB signaling pathway by regulating CCL4 in osteoarthritis. Gene Ther. 2019;26(6):217–229. doi:10.1038/S41434-019-0068-5
81. Deng M, Tang C, Yin L, et al. Screening chondrocyte necroptosis-related genes in the diagnosis and treatment of osteoarthritis. Heliyon. 2024;10(15):e35263. doi:10.1016/J.HELIYON.2024.E35263
 © 2025 The Author(s). This work is published and licensed by Dove Medical Press Limited. The
full terms of this license are available at https://www.dovepress.com/terms.php
and incorporate the Creative Commons Attribution
- Non Commercial (unported, 4.0) License.
By accessing the work you hereby accept the Terms. Non-commercial uses of the work are permitted
without any further permission from Dove Medical Press Limited, provided the work is properly
attributed. For permission for commercial use of this work, please see paragraphs 4.2 and 5 of our Terms.
© 2025 The Author(s). This work is published and licensed by Dove Medical Press Limited. The
full terms of this license are available at https://www.dovepress.com/terms.php
and incorporate the Creative Commons Attribution
- Non Commercial (unported, 4.0) License.
By accessing the work you hereby accept the Terms. Non-commercial uses of the work are permitted
without any further permission from Dove Medical Press Limited, provided the work is properly
attributed. For permission for commercial use of this work, please see paragraphs 4.2 and 5 of our Terms.