")
Back to Journals » Diabetes, Metabolic Syndrome and Obesity » Volume 17
The Effect of Diabetic Ketoacidosis and Hyperosmolar Hyperglycemic on the Metabolic Tumor Markers: A Real-World Retrospective Study
Authors Wen S , Xu D, Yuan Y, Xu Z, Li Y, Gong M, Yuan X, Zhou L
Received 17 July 2024
Accepted for publication 26 October 2024
Published 1 November 2024 Volume 2024:17 Pages 4115—4133
DOI https://doi.org/10.2147/DMSO.S487398
Checked for plagiarism Yes
Review by Single anonymous peer review
Peer reviewer comments 2
Editor who approved publication: Dr Rebecca Conway
Song Wen,1,* Dongxiang Xu,1,* Yue Yuan,1,* Zhimin Xu,1 Yanyan Li,1 Min Gong,1 Xinlu Yuan,1 Ligang Zhou1,2
1Department of Endocrinology, Shanghai Pudong Hospital, Fudan University, Shanghai, 201399, People’s Republic of China; 2Shanghai Key Laboratory of Vascular Lesions Regulation and Remodeling, Shanghai Pudong Hospital, Shanghai, 201399, People’s Republic of China
*These authors contributed equally in this work
Correspondence: Ligang Zhou, Department of Endocrinology, Shanghai Pudong Hospital, Fudan University, Shanghai, 201399, People’s Republic of China, Tel +008613611927616, Email [email protected]
Objective: Serum tumor markers have been discovered to be elevated in individuals with diabetes mellitus (DM); however, their significance in diabetic ketoacidosis (DKA) and hyperosmolar hyperglycemia (HHS) is unknown. We evaluated these indicators in the patients with DKA and HHS.
Materials and Methods: We retrospectively collected the laboratory data of 565 diabetic patients from Shanghai Pudong Hospital between Jan, 2019 and May, 2023, including 300 patients with type 2 diabetes mellitus (T2DM), 206 with DKA, and 59 with HHS. Serum tumor biomarkers and further clinical laboratory tests were compared among the three groups. Patients with conspicuous tumor evidence were excluded from the study.
Results: We found significantly higher levels of carbohydrate antigen 199 (CA199) in DKA (p< 0.01), carcinoembryonic antigen (CEA), complex prostate specific antigen (CPSA) (p< 0.01), prostate specific antigen (PSA) (p< 0.05) in HHS, as well as the plasma lipid profile, iron, and electrolytes, in addition to decreased thyroid function, hepatic and renal function, and cardiac function (p< 0.05). A Spearman correlational study revealed that osmolar levels were significantly positively correlated with myoglobin (MYO) and cardiac troponin I (cTNI), whereas serum iron concentration (r=0.520) was positively correlated with CEA levels in HHS. pH was negatively correlated with CA199 (r=− 0.195), while HbA1c (r=0.22), globin (r=0.341), and total cholesterol (TC) (r=0.191) were positively correlated with elevated CA199 levels. Moreover, the multilinear regression investigation identified osmolarity as a significant determinant for CEA, as well as other parameters, and all proved to be proper predictors for CEA in HHS via ROC curve establishment.
Conclusion: Elevated CA199 levels in DKA were associated with acidosis, whereas HHS with elevated CEA levels may be related to iron homeostasis and could be predicted via the osmolar degree and other predictors.
Keywords: diabetes mellitus, diabetic ketoacidosis, hyperosmolar hyperglycemic state, tumor markers, osmolar, iron homeostasis
Introduction
Both diabetic ketoacidosis (DKA) and diabetic hyperosmolar hyperglycemic state (HHS) are acute and severe consequences of diabetes mellitus (DM).1 Despite the fact that both conditions are characterized by extreme hyperglycemia, they share distinct causes, pathophysiology, clinical manifestations, and laboratory examinations; consequently, the exact therapeutic approach may not be identical regardless of fluid resuscitation and minimal 0.1U/kg insulin dosage therapy.2 For instance, patients with DKA may be younger, with a diagnosis of ketosis-prone diabetes, such as type 1 diabetes (T1D), or diabetes with extreme islet function deficiency; they often onset with ketonemia combined with varying degrees of acidosis, and the loss of bodily fluid may account for 10% or more of body weight. Additionally, the patient may exhibit nausea, vomiting, abdominal pain, and other gastroenterological symptoms, but with relatively mild disturbance of consciousness compared to HHS.3 However, HHS can occur in elderly patients who do not frequently have a history of DM. These patients are characterized by more severe hyperglycemia (>33.3 mmol/L or 599.4 mg/dL) and hyperosmolar state (osmolar>320 mosm/L or hypernatremia), and loss of body fluid can be proportional to >10% of body weight, while patients often manifest with coma or unconsciousness with a Glasgow coma scale (GCS) below 14, and with altered vital signs such as hypotension, tachycardia, and hypoperfusion.4,5 The inducible causes of these two disorders can vary due to infections, uncontrolled hyperglycemia, loss of diet control, inappetence, dehydration, or other potential factors.6,7
In recent decades, with advances in the knowledge of the pathophysiology of DM, as well as DKA, HHS, and other diabetic complications, a consensus has gradually been reached that individuals with DM are at risk not only for cardiovascular disease but also for cancer.8 Multiple epidemiological studies have shown that hyperglycemia is a significant risk factor for the incidence, progression, and prognosis.9 However, despite the higher risk of cancer, the association between DM and cancer is not merely linear, and its pathophysiology remains obscure.10,11 This may be attributed to the scarcity of effective screening maneuvers and specificity of the screening methods. One of the selected clinical measures was the evaluation of circulating tumor markers such as alpha-fetoprotein (AFP), carcinoembryonic antigen (CEA), carbohydrate antigen 199 (CA199), and Carbohydrate antigen 125 (CA125).12 However, recent clinical trials have confirmed that these conventional indicators are detectable at much higher levels in patients with DM, particularly in hyperglycemic cohorts.13–15 Uncertainty exists as to whether these high markers imply the likelihood of developing cancer, given that we saw normalization of the levels of these markers in a few cohorts. In contrast, the others remained positive, which should be a caveat for all clinical practitioners.16 One of the assumptions is attributed to the metabolic change related to glycosylation in patients with DM and cancer.17 Another assumption describes that tissue or massive cell damage may change the secretion pattern of the tumor markers.18 The significance or cause of these elevated markers in T2DM has not been completely understood, and there are sparse observations and reports in extreme conditions, such as DKA and HHS. Whether this elevation in DKA and HHS could be a clue to the higher possibility of progression to actual cancer remains unclear.
In this pilot study, we investigated not only the presence of tumor markers such as AFP, CEA, CA199, CA155, Carbohydrate antigen 153 (CA153), prostate-specific antigen (PSA), and complexed prostate-specific antigen (CPSA) in T2DM, but also the acute diabetic complications, including DKA and HHS with the distinct profile of both situations. Further, we aim to explore the relationship between the elevated tumor markers and other blood indicators, to reveal the sources or pathophysiology of this observed phenomenon via clinical analyses, and to identify the cancer risk factors in DKA and HHS.
Materials and Methods
Source of Patient Data
We retrospectively collected complete data on 565 adult diabetic patients admitted to the Department of Endocrinology between Jan, 2019 and May, 2023 from the inpatient record system of the Shanghai Pudong Hospital. Three hundred patients (n=300) with type 2 diabetes mellitus who met the diagnostic criteria for T2DM according to the 1999 World Health Organization (WHO) guidelines were included in a randomized manner.19 The diagnostic standards for diabetes (DM) includes with at least one of the symptoms of hyperglycemia such as dry mouth, polydipsia, polyuria, unknown reasons for bodyweight rapid reduction, etc or hyperglycemic crisis, and the random plasma glucose value exceeds 200 mg/dL (11.1 mmol/L), or fasting (no caloric intake for at least 8h) plasma glucose value exceeds 126 mg/dL (7.0 mmol/L), or 2 hours post oral glucose challenge by oral glucose tolerance test (OGTT) shows exceeding 200 mg/dL, and those results examined at least two different single days. While type 1 diabetes (TIDM) often occurs at an early age, with or without immunoreactivity for diabetes-related antibodies, concurrently showing sparse pancreatic insulin secretion represented by extremely low C-peptide levels, who often exhibit ketone-prone characteristics. However, type 2 diabetes (T2DM) onset latency has a strong genetic background in adults without acute insulin insufficiency, and often with overweight or obesity, who exhibit overt insulin resistance.
Patients who fulfilled the international diagnostic criteria for diabetic ketoacidosis (DKA) (n=206) (blood glucose>250 mg/dL, with ketonemia or urine ketone, and pH< 7.3 or HCO3-<15 mmol/L determined by blood-air analyses, anion gap>10 mmol/L), hyperosmolar hyperglycemic state (HHS) (n=59) (blood glucose>599.4 mg/dL, with hyperosmolar state defined as >320mOsm/L, pH>7.3 or HCO3->15 mmol/L determined by blood-air analyses, urinary glucose showed strong positive, without or weak positive for ketonemia or urine ketone, anion gap<12 mmol/L), and T2DM (n=300) were retrospectively included in the study at a random manner according to the calculation of matched sample size (1:3:5). All DKA or HHS patients received hydration treatment and a continuous low intravenous dose of rapid-acting insulin (0.1 U/kg) until the normalization of pH, ketone, or blood osmolar. T2DM patients received either oral antidiabetic medications, such as metformin, sulfonylurea, glinides, pioglitazone, sodium glucose co-transporter inhibitors (SGLT-2i), α-glucosidase inhibitors, dipeptidyl peptidase-IV inhibitors (DPP-IV inhibitors), or injectables, such as glucagon-like peptide-1 receptor agonists (GLP-1RA) and insulin (basal insulin or combined with prandial insulin or premixed insulin), based on disease progression, glycemic control, and complications such as liver or kidney insufficiency.
Other acidosis disorders, including lactic acidosis, shock, hypoperfusion of circulation, hypoxia such as chronic obstructive pulmonary disease (COPD), asthma, uremia, intestinal obstruction, and severe sepsis, were excluded from the study according to the information of diagnoses and history as well as evidences from certain examinations or maneuvers such as enhanced computed tomography (CT), magnetic Resonance imaging (MRI) of the recording system. In addition, patients with tumors or other obvious abnormalities, including obstructive suppurative cholangitis, pancreatitis, and prostatic hyperplasia, were excluded from the study based on the imaging evidence of certain tumors in our recording system. The clinical characteristics of the groups are presented in Table 1.
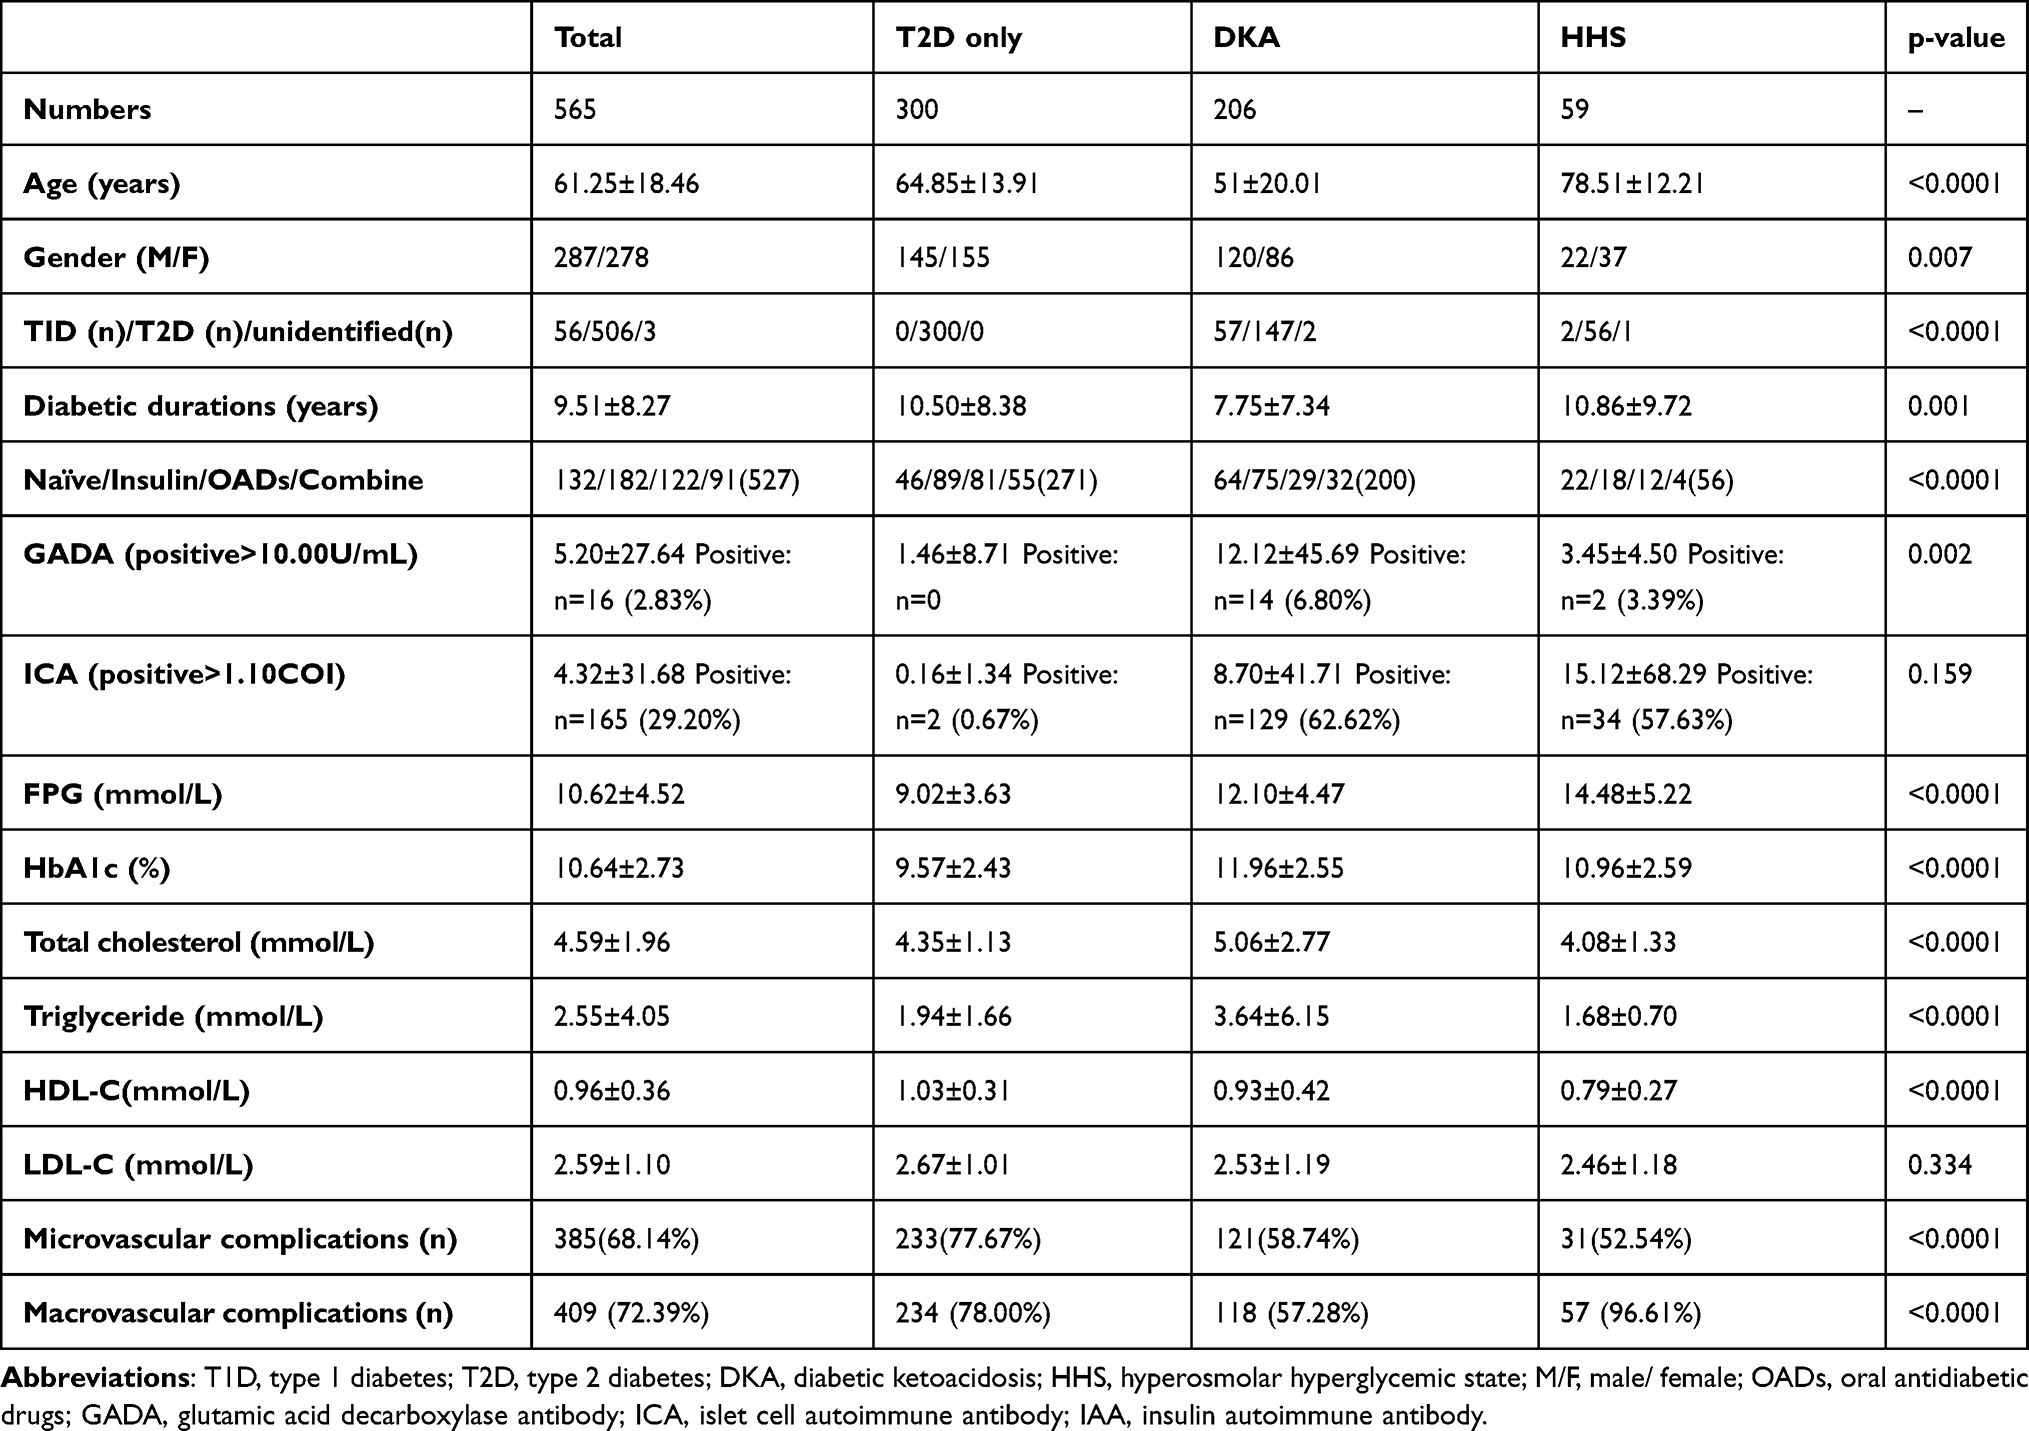 |
Table 1 The Demographic Characteristics of Patients Among Three Groups in T2D Only, DKA, HHS |
Blood Sampling and Methods of Laboratory Assessment
On the first day of admission, blood samples were obtained from patients to assess metabolic, organic, and tumor parameters. These laboratory parameters included serum blood glucose, pancreatic islet function, hemoglobin A1C (HbA1C), serum tumor markers, plasma lipids, electrolytes, trace micronutrients, thyroid function, hepatic function, renal function, and cardiac function. All biochemical indicators, including fasting blood glucose, lipid parameters, hepatic function, and kidney function indicators (estimated glomerular filtration rate [eGFR], creatinine, and serum iron), were analyzed using a fully automatic biochemical analyzer (ADVIA Chemistry XPT, SIEMENS, USA). HbA1C levels were analyzed using an HbA1C analyzer (TOSOH G8), which reflects the level of glycemic control in the past three months. C-peptide, thyroid function indicators, and tumor markers were processed using chemiluminescence methods in a fully automatic chemiluminescence immunoassay analyzer (ADIVA Centaur XPT, SIEMENS, USA). Cardiac injury indicators, including brain natriuretic peptide (BNP), myoglobin (MYO), cardiac troponin I (cTNI), and creatine kinase-Mb (CKMB) were analyzed using immunofluorescence assays (Pylon, ET Healthcare, USA). Other indicators, such as urinary microalbumin-to-creatinine ratio (UACR), were calculated by dividing the value of measured urinary creatinine (Benedict-Behre method) by the value of measured urinary microalbumin (pmteinelTor).
Established Homeostasis Model Assessment of Insulin Resistance (HOMA-IR) and Homeostasis Model Assessment of β Cell Function (HOMA-β)
To estimate and compare insulin resistance and β-cell function among the three groups, a homeostasis model was established using fasting glucose and fasting C-peptide. The HOMA-IR and HOMA-β were executed using a calculator (HOMA2-IR, which could calculate the insulin resistance and β-cell function as well as insulin sensitivity when the glycemic could be higher as 25 mmol/L, as well as the using C-peptide as lower as 0.2 nmol/L or using endogenous insulin value) that was downloaded from the University of Oxford http://www.dtu.ox.ac.uk/.
Statistical Analyses
Statistical analyses were performed using Statistical Package for the SPSS (IBM, version 26.0) and Prism (GraphPad, version 10.0). To compare the groups of patients with T2D only, DKA, and HHS, all data were analyzed using standard one-way ANOVA or Brown-Forsythe and Welch ANOVA tests, depending on whether the data were fitted for a normal distribution and homogeneity of variance. Tukey’s test or Dunnett’s T3 test was used for post hoc analyses. Correlation studies were performed using Pearson or Spearman analyses. The significance threshold for all statistical analyses was set at p<0.05. Data are presented as mean±standard error of the mean (SEM).
Results
The General Profile and Disequilibrium of Glucose Metabolism in T2D Only, DKA and HHS
We initially examined the overall profile, including age and glucose metabolic status, and discovered disparities in age (T2DM only: 64.85± 13.91 years; DKA: 51±20.01 years; HHS: 78.51±12.21 years; T2DM only vs HHS: p<0.0001; DKA vs HHS: p<0.0001), blood glucose (FPG: T2DM only: 9.02±3.63 mmol/L; DKA: 12.10±4.47 mmol/L; HHS: 14.48±5.22 mmol/L; 2hPPG: T2DM only: 13.79 ±5.26 mmol/L; DKA: 15.63±5.17 mmol/L; HHS: 15.30±5.48 mmol/L; FPG: T2D only vs DKA: p<0.0001; T2D only vs HHS: p<0.0001; DKA vs HHS: p=0.0039; 2hPPG: T2D only vs DKA: p=0.0046), HbA1c (T2DM only: 9.57±2.43%; DKA: 11.96 ±2.55%; HHS: 10.96±2.59%; T2D vs HHS: p=0.002; DKA vs HHS: p=0.0447), c-peptide (FPCP: T2DM only: 0.41±0.34 nmol/L; DKA: 0.19±0.22 nmol/L; HHS: 0.48±0.46 nmol/L; T2D only vs DKA: p<0.0001; DKA vs HHS: p=0.0008; 2hPPCP: T2DM only: 0.77±0.63 nmol/L; DKA: 0.26±0.31 nmol/L; HHS: 0.57±0.51 nmol/L; T2D vs DKA: p<0.0001; DKA vs HHS: 0.0048), diabetic antibodies including GAD (T2DM only: 1.46±8.71IU/mL; DKA: 12.12±45.69IU/mL; HHS: 3.45±4.50IU/mL; T2D only vs DKA: p=0.0289), IAA (T2DM only: 1.87±6.76RU/mL; DKA: 12.55±45.79RU/mL; HHS: 15.03±21.42RU/mL; T2D only vs DKA: p=0.0282; T2D only vs HHS: p=0.0034), whereas the ICA and glycated albumin (GA), as well as homeostatic assessment model of insulin resistance (HOMA-IR) did not show significant dissimilar (p>0.05) (Figure 1A–I).
 |
Figure 1 The comparison of Age (A), blood glucose (FPG, 2hPPG) (B), HbA1c (C), GA (D), c-peptide (FPCP, 2hPPCP) (E), HOMA-IR (F), GAD (G), IAA (H), and ICA (I) between the T2D, DKA, and HHS groups. Abbreviations: BG, blood glucose; FPG, fasting plasma glucose; 2hPPG, 2 hours postprandial plasma glucose; HbA1c, glycated hemoglobin A1c; GA, glycated albumin; FPCP, fasting plasma c-peptide; 2hPPCP, 2 hours postprandial plasma c-peptide; HOMA-IR, homeostatic assessment model of insulin resistance; GAD, glutamic acid decarboxylase autoimmune antibody; IAA, insulin autoimmune antibody; ICA, islet autoimmune antibody. Note: *p<0.05; **p<0.01; ***p<0.001; ****p<0.0001; ns: no significance; The data were shown as mean±SEM. |
The Elevated Tumor Markers in HHS When Compared to DKA and T2DM Only
Furthermore, we compared serum tumor markers among the T2D-only, DKA-only, and HHS-only groups. Interestingly, we found that cancer antigen 199 (CA199) (T2DM only: 20.90±17.42U/mL; DKA: 40.75±62.88U/mL; HHS: 42.35±98.03U/mL; T2D only vs DKA: p=0.0021), carcinoembryonic antigen (CEA) (T2DM only: 2.21±1.58ng/mL; DKA: 2.58±1.69 ng/mL; HHS: 4.30±3.06ng/mL; T2D only vs HHS: p=0.0004; DKA vs HHS: p=0.0043), complexed prostate specific antigen (CPSA) (T2DM only: 1.44±3.32ng/mL; DKA: 1.39±4.39ng/mL; HHS: 3.85±4.33 ng/mL; T2D only vs HHS: p=0.0043; DKA vs HHS: p=0.0003), prostate specific antigen (PSA) (T2DM only: 1.89±3.47ng/mL; DKA: 1.23±1.88ng/mL; HHS: 7.08±8.04 ng/mL; DKA vs HHS: p=0.0256), and lactate dehydrogenase (LDH) (T2DM only: 196.70±74.33U/L; DKA: 245.67±123.14U/L; HHS: 326.52±204.02U/L; T2D only vs DKA: p=0.0001; T2D only vs HHS: p=0.0006; DKA vs HHS: p=0.0538) showed significantly disparity in HHS and/or DKA. Nonetheless, disparities in alpha-fetoprotein (AFP), cancer antigen 125 (CA125), and cancer antigen 153 (CA153) were not significant (p>0.05) (Figure 2A–H).
 |
Figure 2 The comparisons of elevated tumor markers including AFP (A), CA125 (B), CA153 (C), CA199 (D), CEA (E), CPSA (F), PSA (G), and LDH (H) between T2D, DKA, and HHS groups. Abbreviations: AFP, α-fetoprotein; CA125, cancer antigen 125; CA153, cancer antigen 153; CA199, cancer antigen 199; CEA, carcinoembryonic antigen; CPSA, complex prostate-specific antigen; PSA, prostate-specific antigen; LDH, lactate dehydrogenase. Note: *p<0.05; **p<0.01; ***p<0.001; ns: no significance; The data were shown as mean±SEM. |
The Trend of Thyroid Function Decline in DKA and HHS Among Three Groups
We observed evident decline tendency in thyroid function including FT3 (T2DM only: 4.11±1.08 pmol/L; DKA: 2.94±1.05 pmol/L; HHS: 2.57±0.66 pmol/L; T2D only vs DKA: p<0.0001; T2D only vs HHS: p<0.0001), FT4 (T2DM only: 15.23±2.53 pmol/L; DKA: 13.95±3.75 pmol/L; HHS: 13.42±2.91 pmol/L; T2D only vs HHS: p=0.0002), TT3 (T2DM only: 1.28±0.38 nmol/L; DKA: 0.78±0.32 nmol/L; HHS: 0.76±0.22 nmol/L; T2D only vs HHS: p<0.0001), TT4 (T2DM only: 93.12±20.72 nmol/L; DKA: 71.37±24.72 nmol/L; HHS: 74.89±24.59 nmol/L; T2D only vs DKA: p<0.0001; T2D only vs HHS: p<0.0001), TSH (T2DM only: 2.76±4.99mIU/L; DKA: 1.27±1.15mIU/L; HHS: 0.83±0.72mIU/L; DKA vs HHS: p=0.0029); whereas the levels of TPOAb, TgAb, and Tg did not differ from each other group substantially (p>0.05) (Figure 3A–H).
 |
Figure 3 The comparisons among T2D-only, DKA, and HHS groups in respect of thyroid function: FT3 (A), FT4 (B), TT3(C), TT4(D), TSH(E), TPOAb (F), TgAb (G), and Tg (H). Abbreviations: FT3, free triiodothyronine; FT4, free thyroxine; TT3, total triiodothyronine; TT4, total thyroxine; TPOAb, thyroid peroxidase antibody; TgAb, thyroid globulin antibody; Tg, thyroid globulin. Note: **p<0.01; ***p<0.001; ****p<0.0001; ns: no significance; The data were shown as mean±SEM. |
The Spectrum of Lipids in DKA and HHS Varies Between Three Groups
The analyses revealed that the levels of TC (T2DM only: 4.35±1.13 mmol/L; DKA: 5.06±2.77 mmol/L; HHS: 4.08±1.33 mmol/L; T2D only vs DKA: p=0.0057; DKA vs HHS: p=0.0229) and TG (T2DM only: 1.94±1.66 mmol/L; DKA: 13.95±3.75 pmol/L; HHS: 1.68±0.70 mmol/L; T2D only vs DKA: p<0.0001; DKA vs HHS: p<0.0001) were markedly elevated in groups of DKA, compared with other 2 groups. However, HDL and LDL levels were not significantly different (p>0.05). On the other hand, the level of APOA1 were obviously reduced in HHS (T2DM only: 1.13±0.21g/L; DKA: 1.08±0.30g/L; HHS: 0.99±0.25g/L; T2D only vs HHS: p=0.0034), while APOE increased notably in DKA (T2DM only: 39.09±19.32 mg/L; DKA: 58.06±53.02 mg/L; HHS: 46.56±17.70 mg/L; T2D only vs DKA: p=0.0335). When compared with HHS, the level of sdLDL were distinctly higher in DKA (T2DM only: 0.89±0.48 mmol/L; DKA: 1.06±1.02 mmol/L; HHS: 0.52±0.37 mmol/L; DKA vs HHS: p=0.0347). Nonetheless, the levels of APOA2, APOB, and LPa did not differ between groups (p>0.05) (Figure 4A–G).
 |
Figure 4 The spectrum of plasma lipids (A); APOA1(B); APOA2(C); APOB(D); APOE(E); LPa(F); sdLDL(G), differs among T2D alone, DKA, and HHS groups. Abbreviations: TC, total cholesterol; TG, triglyceride; HDL, high-density lipoprotein; LDL, low-density lipoprotein; APOA1, apolipoprotein A1; APOA2, apolipoprotein A2; APOB, apolipoprotein B; APOE, apolipoprotein E; LPa, lipoprotein a; sdLDL, small dense low-density lipoprotein. Note: *p<0.05; **p<0.01; ****p<0.0001; ns: no significance; The data were shown as mean±SEM. |
The Impairment of Hepatic Function in DKA and HHS Was Compared to That of T2DM-Only Patients
Stepwise evaluation showed that compared with T2D only, hepatic function was compromised in the DKA and HHS groups. Especially, the protein concentration including total protein (TP: T2DM only: 64.67±6.14g/L; DKA: 61.96±11.07 g/L; HHS: 61.28±8.34 g/L; T2D only vs DKA: p<0.0001; T2D only vs HHS: p=0.0011) and albumin (ALB: T2DM only: 38.22±4.40g/L; DKA: 35.84±6.50 g/L; HHS: 31.88±4.96 g/L; T2D only vs DKA: p=0.0005; T2D only vs HHS: p<0.0001; DKA vs HHS: P=0.0002) were substantially reduced in both DKA and HHS, while globin decreased obviously in DKA (GLO: T2DM only: 26.49±3.86 g/L; DKA: 23.18±4.27 g/L; HHS: 26.52±5.47 g/L; T2D only vs DKA: p<0.0001; DKA vs HHS: p=0.0286). In addition, we also observed the ratio of ALB to GLO (A/G: T2DM only: 1.48±0.26; DKA: 1.57±0.35; HHS: 1.26±0.31; T2D only vs DKA: p=0.0521; T2D only vs HHS: p=0.0023; DKA vs HHS: p<0.0001), where HHS possessed reduced value significantly, and the contents of pro-albumin in both DKA and HHS showed remarkably lower (T2DM only: 228.40±67.63 mg/L; DKA: 145.88±67.39 mg/L; HHS: 125.5±63.15 mg/L; T2D only vs DKA: p<0.0001; T2D only vs HHS: p<0.0001). In terms of liver injury, the both DKA and HHS groups exhibited increased AST (T2DM only: 25.20±14.69U/L; DKA: 41.80±109.27 U/L; HHS: 61.70±149.22 U/L; T2D only vs DKA: p=0.0359; T2D vs HHS: p=0.0007); while total bilirubin increased significantly in HHS (T2DM only: 11.81±5.26μmol/L; DKA: 11.94±8.52 μmol/L; HHS: 13.76±7.93 μmol/L; T2D only vs HHS: p=0.0335); the ratio of AST/ALT were evidently increased in HHS (T2DM only: 1.16±0.44; DKA: 1.26±0.77; HHS: 1.55±0.64; T2D only vs HHS: p=0.0073). The level of γ-GGT showed no significant (p>0.05), while bile acid showed decreased distinctively in DKA (Bile acids: T2DM only: 7.29±10.57μmol/L; DKA: 3.50±4.41μmol/L; HHS: 5.67±4.36μmol/L; T2D only vs DKA: p=0.0006) (Figure 5A–H).
 |
Figure 5 Comparisons of hepatic function based on protein content (A); A/G(B); proalbumin (C); bilirubin (D), transferase (E), AST/ALT (F); γ-GGT (G), and Bile acids (H). Abbreviations: TP, total protein; ALB, albumin; GLO, globin; TBiL, total serum bilirubin; DBiL, direct serum bilirubin; SBiL, indirect serum bilirubin; γ-GGT, γ-glutamyl transpeptidase. Notes: *p<0.05; **p<0.01; ***p<0.001; ****p<0.0001; ns: no significance; The data were shown as mean±SEM. |
The Impaired Renal Function in DKA and HHS Compared to the Patients with T2DM Only
Moreover, the analyses on renal function showed injury on kidney filtration in groups of HHS including increased blood urea nitrogen (BUN) (T2DM only: 8.03±5.26 mmol/L; DKA: 10.12±8.97 mmol/L; HHS: 22.66±13.52 mmol/L; T2D only vs HHS: p<0.0001, DKA vs HHS: p<0.0001), serum creatinine (SCr) (T2DM only: 82.57±67.68μmol/L; DKA: 99.47±91.70μmol/L; HHS: 184.47±124.82μmol/L; T2D only vs HHS: p<0.0001; DKA vs HHS: p<0.0001), uric acid (UA) (T2DM only: 330.76±125.87μmol/L; DKA: 512.25±227.38μmol/L; HHS: 569.13±214.33μmol/L; T2D only vs HHS: p<0.0001), reduced urinary albumin to creatinine ratio (UACR) (T2DM only: 97.23±106.50 mg/g; DKA: 173.90±128.65 mg/g; HHS: 1.38±0.77 mg/g; T2D only vs HHS: p<0.0001; DKA vs HHS: p<0.0001), as well as the enhanced serum concentration of cystatin C (CysC) (T2DM only: 1.31±0.9 mg/L; DKA: 1.03±0.74 mg/L; HHS: 2.44±0.94 mg/L; T2D only vs HHS: p<0.0001; DKA vs HHS: p<0.0001) (Figure 6A–E).
 |
Figure 6 The presentation of impaired renal function in terms of BUN (A), SCr (B), Uric acid (C), CysC (D), UACR (E) among T2D only, DKA, HHS. Abbreviations: BUN, blood urea nitrogen; Scr, serum creatinine; CysC, cystatin C; UACR, urinary albumin-to-creatinine ratio. Notes: ****p<0.0001; ns: no significance; The data were shown as mean±SEM. |
The Disparity in Electrolyte and Iron Assessment Among T2DM Only, DKA, HHS
We reviewed the data on electrolytes and iron, and found that the concentration of Natrium (T2DM only: 140.81±4.30 mmol/L; DKA: 139.18±9.29 mmol/L; HHS: 159.20±9.32 mmol/L; T2D only vs HHS: p<0.0001; DKA vs HHS: p<0.0001) and Chlorine (T2DM only: 105.46±5.37 mmol/L; DKA: 105.63±8.25 mmol/L; HHS: 121.38±8.31 mmol/L; T2D only vs HHS: p<0.0001; DKA vs HHS: p<0.0001) were significantly higher in groups of HHS than other two groups; The level of blood calcium (T2DM only: 2.17±0.17 mmol/L; DKA: 2.08±0.15 mmol/L; HHS: 2.09±0.19 mmol/L; T2D only vs DKA: p=0.0002) was decreased in DKA, and phosphorus (T2DM only: 1.14±0.25 mmol/L; DKA: 0.97±0.75 mmol/L; HHS: 0.86±0.37 mmol/L; T2D only vs HHS: p=0.0002) was significant lower in HHS, as well as iron (T2DM only: 12.80±4.99μmol/L; DKA: 8.02±1.23μmol/L; HHS: 7.15±3.28μmol/L; T2D only vs HHS: p<0.0001); however, the levels of magnesium (T2DM only: 0.81±0.09 mmol/L; DKA: 1.50±0.17 mmol/L; HHS: 1.28±0.38 mmol/L; T2D only vs DKA: p<0.0001; T2D only vs HHS: p<0.0001; DKA vs HHS: p=0.0022) were elevated in DKA and HHS, while potassium are generally identical (p>0.05). The binding ability of carbon-dioxide reduced substantially in DKA and HHS (T2DM only: 27.39±3.40 mmol/L; DKA: 19.97±6.21 mmol/L; HHS: 22.32±3.38 mmol/L; T2D only vs DKA: p<0.0001; T2D only vs HHS: p<0.0001) (Figure 7A–H).
 |
Figure 7 The comparisons of serum electrolytes containing natrium (A), potassium (B), chlorine (C), CO2 binding (D); calcium (E), phosphorus (F), iron (G), magnesium (H) among groups T2D only, DKA, HHS. Abbreviation: Cl, chlorine. Notes: **p<0.01; ***p<0.001; ****p<0.0001; ns: no significance; The data were shown as mean±SEM. |
The Cardiac Injury in the Patients Among the Patients with T2DM, DKA and HHS
The analyses showed that when compared with groups of DKA and T2DM only, the markers of cardiac injury showed elevated myoglobin (MYO) (T2DM only: 74.72±174.42ng/mL; DKA: 158.53±244.92ng/mL; HHS: 561.80±790.15ng/mL; T2D only vs DKA: p=0.0008; T2D vs HHS: p=0.0002; DKA vs HHS: p=0.0024), cardiac troponin I (cTNI) (T2DM only: 0.09±0.16 ng/mL; DKA: 0.42±2.26 ng/mL; HHS: 0.52±1.22ng/mL; T2D only vs HHS: p=0.0466), creatine kinase (CK) (T2DM only: 123.64±245.61ng/mL; DKA: 268.45±646.36ng/mL; HHS: 779.30±1076.40ng/mL; T2D only vs DKA: p=0.0107), creatine kinase-Mb (CKMb) (T2DM only: 15.66±9.40ng/mL; DKA: 25.12±24.84ng/mL; HHS: 31.80±21.41ng/mL; T2D only vs DKA: p=0.0012; T2D vs HHS: p=0.0012), whereas the markers of heart failure including Brain-type natriuretic peptide (BNP), N-Terminal Pro-Brain natriuretic peptide (NT-ProBNP) showed no significant alterations (p>0.05) (Figure 8A–F).
 |
Figure 8 The comparisons of markers of heart failure, cardiac injury among groups of T2D only, DKA, and HHS: BNP(A); MYO(B); NT-ProBNP(C); cTNI (D); CK(E); CKMb (F). Abbreviations: BNP, Brain-type natriuretic peptide, MYO, myoglobin, NT-proBNP, N-Terminal Pro-Brain natriuretic peptide, cTNI, cardiac troponin I, CK, creatine kinase, CKMb, creatine kinase-Mb. Notes: *p<0.05; **p<0.01; ***p<0.001; ns: no significance; The data were shown as mean±SEM. |
The Relationship Between the HHS States and Tumor Markers and Cardiac Injury
In the next step, we analyzed the critical indices related to the elevations in CEA and cardiac injury and found that osmolar (defined as 2* (CNa++CK+) + glucose) was positively correlated with the change in MYO and cTNI, while HbA1c was negatively correlated with MYO. However, the level of serum iron concentration was positively correlated with the levels of CEA, LDH, and cTNI. (Table 2).
 |
Table 2 The Spearman Nonparametric Analysis Reveals Relationship Between Osmolar, HbA1c, Iron and Tumor Markers, Cardiac Injury Markers in HHS |
The Spearman Nonparametric Analysis Reveals Association Between DKA, Tumor Markers, Reduced Hepatic Function, and Cardiac Injury
Furthermore, we investigated the relationship between DKA-related parameters and tumor markers, hepatic function, and cardiac damage. We observed a correlation between pH and CEA (negative), MYO, CK, and CKMb (positive) concentrations. HbA1c levels were positively correlated with CA199 levels and negatively correlated with MYO and CK levels. Moreover, globin expression positively correlated with CA199. TC was positively correlated with CA199 levels and negatively correlated with bile acid, MYO, and CK levels. (Table 3).
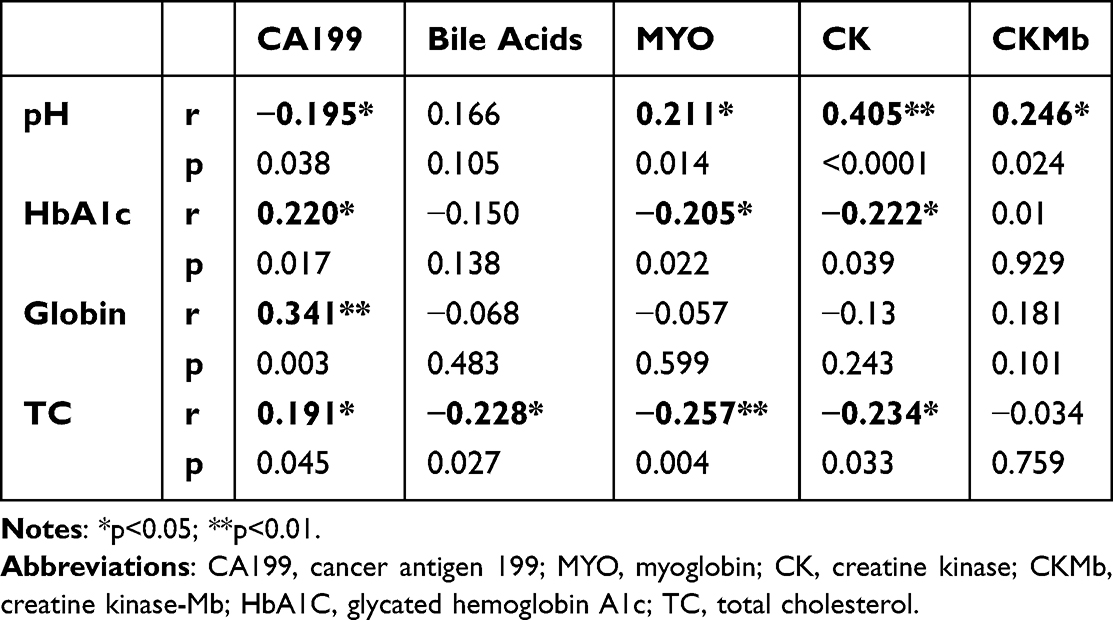 |
Table 3 The Relationship Between pH, HbA1c, and Tumor Markers, Cardiac Injury Markers in DKA |
The Multilinear Regression Models for the Independent Variables Associated with the Change of CEA and CA199 in HHS and DKA
We further developed multilinear regression models for changes in CEA levels in HHS, and CA199 in DKA. We found that FPCP, cTNI, osmolar, Scr, TSH, and HbA1c were significant determinants of the change in CEA in HHS (R square 0.616) (Table 4). Although multiple parameters were correlated with CA199 in DKA, we only identified serum globin and total CO2 as significant independent variables for CA199 changes in DKA (R square 0.060) (Table 5).
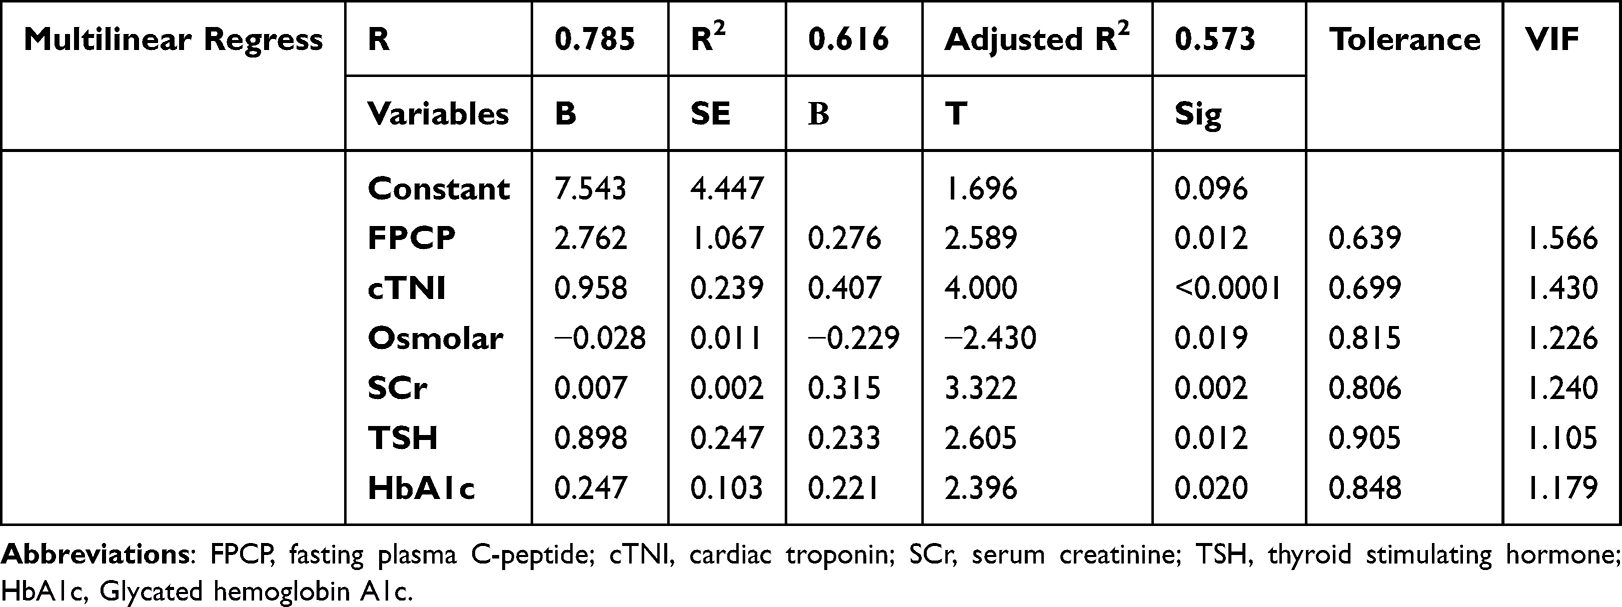 |
Table 4 The Multilinear Regression Model Shows the Significant Variables to the CEA Changes in HHS |
 |
Table 5 The Multilinear Regression Model Shows the Significant Variables to the CA199 Changes in DKA |
The Predicted Value of Regression Parameters in HHS and DKA for CEA and CA199
Finally, we created a receiver operating characteristic (ROC) curve to assess the predictive value of previously established parameters in multilinear regression models for CEA and CA199 in HHS and DKA. According to our findings, the Youden index was 94.97% for FPCP, 91.67% for cTNI, 100% for osmolarity, 100% for SCr, 92.11% for TSH, and 80.39% for HbA1c. In contrast, the Youden index of CA199 was 14.34% for globin and 19.13% for tCO2 in DKA (Figures 9A–F and 10A and B).
 |
Figure 9 The predict value of established multilinear variables for the CEA in HHS represented by FPCP(A), cTNI (B), Osmolar (C), SCr (D), TSH (E), HbA1c (F). The Cut-off, sensitivity, specificity, and AUC were annotated in the Fig. below the curve. Abbreviations: FPCP, fasting plasma C-peptide; cTNI, cardiac troponin; SCr, serum creatinine; TSH, thyroid-stimulating hormone; HbA1c: Glycated hemoglobin A1c. |
 |
Figure 10 The predict value of established multilinear variables for the CA199 in DKA represented by Globin (A), and tCO2 (B). The Cut-off, sensitivity, specificity, and AUC were annotated in the Fig. below the curve. Abbreviation: tCO2, total CO2 concentration in plasma. |
Discussion
In the present study, we delineated a relatively comprehensive profile of both DKA and HHS. We hypothesized that patients with higher tumor biomarker levels who are challenged with acute diabetic disorders will also be prone to various cancers. Our study confirmed that patients in extreme situations have elevated serum tumor biomarkers, and this alteration was linked with multiple metabolic factors that could be considered a potential risk for cancer. Therefore, in these patients, the susceptibility to developing cancer cannot be ignored, but more attention should be paid to the distinct potential risk factors for DKA and HHS (Figure 11).
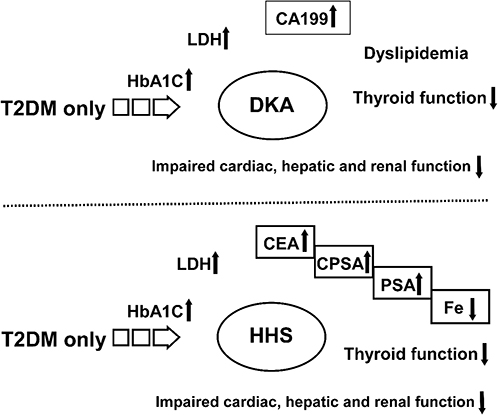 |
Figure 11 The summary of biomarkers of tumor, tracer nutrition and impaired thyroid, cardiac, hepatic and renal function among groups of T2D only, DKA and HHS. Re-examination of tumor markers including CEA, PSA and CPSA (indicated by the box) in DKA or HHS patients will benefit in the early diagnosis of specific tumors after their recovery from DKA and HHS. Iron supplement maybe also necessary for these patients. Abbreviations: CEA, carcinoembryonic antigen; CPSA, complexed prostate specific antigen; and PSA, prostate specific antigen; LDH, lactate dehydrogenase; CA199, cancer antigen 199; Fe, iron; HbA1c, glycated hemoglobin A1c. |
In the primary step, we outline the background of glucose metabolism in DKA, HHS, and T2D. The finding of the average onset age approximates our clinical observation, and the indicators for glycemic control proved that relative to ordinary T2D, DKA and HHS revealed a worse situation. For DKA, due to immune injury manifested by a higher titer of autoimmune antibodies, such as GAD, we observed a decline in C-peptide concentration, which is an indicator of pancreatic islet function. However, for HHS, our findings could not completely support the previous evidence or hypothesis that patients with HHS acquire a higher degree of insulin resistance,20 which was represented by HOMA-IR in our study, owing to the probable limitations of sample size and variation in pancreatic function evaluation data.
We then directly analyzed the distribution and significance of the aforementioned tumor markers among the three groups. Notably, CA199 levels were considerably enhanced in DKA but not in HHS, whereas CEA, CPSA, and PSA concentrations were higher in HHS. This is in line with previous studies showing that elevated serum CA199 levels can be routinely observed in patients with uncontrolled hyperglycemia.21–23 One proposed explanation attributed this phenomenon to the shared blood supply for exocrine parenchymal and endocrine islets, as well as hyperglycemic stimuli resulting in nuclear injuries of pancreatic cells and the release of CA199 from the nuclei.24 In this situation, we could infer that the impairment in pancreatic islets could be more profound in DKA than in HHS, whereas HHS may be characterized by higher insulin resistance according to previous clinical evidence, which requires further investigation. The interpretation of the elevation of CEA, PSA, and CPSA in HHS might be associated with caveats, such as aging, malnutrition, compromised immune response, and other factors that may be risk factors in HHS for certain cancers, which will be discussed in stepwise analyses.25 We also observed that LDH was substantially increased in both DKA and HHS; however, the significance of LDH may be non-specific, as it is required for metabolism in a variety of tissues and organs, as well as in many malignancies. In this study, the occurrence of higher LDH levels may be acute,26 and the increased LDH levels did not directly establish the persistent existence of a particular carcinoma but may signal damage to the cells of various tissues and organs in acute diabetic disorders.27
In addition, we compared thyroid function among the three groups, the alterations of which could be viewed as the severity of diseases, as there was no virtual thyroid impairment, as indicated by the negative results for TPOAb and TgAb, markers for autoimmune thyroiditis and thyroid injury, and the findings of a consistent decline in TSH with thyroid hormones. This phenomenon may be regarded as a functional adaptation of the thyroid to the reduced metabolic state of DKA or HHS, also known as non-thyroidal illness syndrome.28–30 Previous research has suggested that non-thyroidal illness syndrome could be observed in a variety of severe systemic diseases, and the primary treatment for this condition is the treatment of the primary disease.31–33
We also compared the lipid spectra of DKA and HHS. These results suggest that lipid imbalance may be more pronounced in DKA, as there is a change in macronutrient metabolism as a result of excessive ketone production and glucose deficit, as evidenced by higher TC, TG, APOE, and LDL levels.34–36 Patients with HHS had higher APOA1 levels, indicating an early significant change in HDL in HHS. The lipid spectrum suggested that both groups may be potential targets for cardiovascular risk factors.
In the next stepwise analysis, we found disturbed hepatic and renal functions in the DKA and HHS groups. Due to aging and chronic malnutrition, hepatic status may be adverse in HHS, not only in protein synthesis but also in hepatic transferase and bilirubin levels, which are related to uncontrollable hyperglycemia in HHS.36,37 Bile acids are associated with farnesoid X receptor (FXR) signaling, which regulates lipid and glucose metabolism.38 We also observed a significant decrease in the level of bile acids in DKA, whereas γ-GGT was comparable between the groups, indicating that bile acid excretion may be unaffected while bile acid synthesis is abnormal in DKA.
Elevations in BUN, SCr, Uric acid, and cysC, an early kidney injury marker,39 as well as a decrease in UACR clearly indicated the presence of severe renal insufficiency in the HHS group. These changes may be attributable to considerable body fluid loss, which results in hypoperfusion of the kidney and oliguria and subsequently impairs glomerular and tubular function, as evidenced by the increase in BUN and SCr and the decrease in uric acid excretion. Nonetheless, the decline in kidney function may be partially or completely reversible in HHS because fluid resuscitation may restore renal perfusion if properly administered.
Thereafter, we analyzed the changes in electrolyte and iron levels in the three groups. Changes in Na+, K+, and Cl− levels corroborated the hyperosmolar status of HHS. The “CO2 binding ability” could be regarded as the remnant of HCO3−. Thus, we also observed acidosis in DKA. The concentration of serum calcium was significantly reduced in DKA compared to T2D only, which was also a consequence of DKA and may thus transiently affect calcium homeostasis and bone turnover.40 Furthermore, we observed a significant decrease in phosphorus levels in patients with HHS, which may be attributed to malnutrition status in HHS. Hypophosphatemia may continue despite the restoration of bodily fluid by parenteral nutrition, a condition known as “refeeding syndrome”. Enteral nutrition through the digestive tract can potentially relieve this syndrome. In addition to the replacement of extracellular fluid with parenteral nutrition, enteral nutrition is essential for the management of patients with HHS.41 This discrepancy in the iron content indicates that HHS has a relative iron shortage. Magnesium levels were increased in both the DKA and HHS groups, which may have contributed to the decline in renal function.
We also investigated indicators of heart failure and cardiac injury. Notably, we detected significant changes in myocardial damage markers such as MYO, cTNI, CK, and CKMb, indicating that both acidosis and hyperosmolarity may affect cardiac perfusion and function. However, we did not find distinct heart failure, as evidenced by BNP levels, when compared to T2D only. Owing to the relative severity of fluid loss in patients with DKA and HHS, NT-ProBNP levels demonstrate renal hypoperfusion. In this study, a moderate increase in myocardial damage markers did not suggest acute coronary syndrome. However, physicians should be aware of the possibility of severe cardiac damage in patients with DKA and HHS.
Moreover, we explored the potential relationships between other critical parameters and tumor markers via correlational and multilinear regression analyses. We discovered that the hyperosmolar state, as measured by osmolar pressure, was a determinant of CEA elevation but was also associated with cardiac injury. This may indicate that hyperosmolarity is a risk factor for tumors and cardiovascular lesions.42,43 Regression analyses revealed that HbA1c levels were associated with CEA levels. Changes in MYO or CK may be an adaptive response to prevent the adverse consequences of oxidative stress or mitochondrial dysfunction in DKA or HHS.44 The ROC curve data revealed that osmolarity was a proper predictor of CEA levels in HHS. The appropriate cutoff for CEA in diabetic patients with malignancy was 5.0 ng/mL, as indicated in a previous study.45 The CEA cut-off for diabetic patients with other conventional diabetes complications, such as peripheral neuropathy, was 2.66–3.0 ng/mL.46,47 The mean value of the HHS group in the present study was 4.30±3.06ng/mL, which was lower than that of the malignancy group but higher than that of other diabetic complications.
Iron is essential for many human physiological processes and is required for the transport of oxygen in the blood, energy synthesis in the mitochondria, muscle function, and hematopoiesis and is a co-factor for many enzymes engaged in mitotic or detoxification processes.48 Systemic iron homeostasis is mainly maintained through the recycling of older erythrocytes by macrophages and storage in hepatocytes. Hepatocytes regulate iron homeostasis via secretion of the peptide hormone hepcidin, and high levels of iron cause hepcidin production and secretion in the blood.49 Iron protects cells from impairment caused by free radicals through its involvement of catalases and peroxidases. Iron protects cells from impairment caused by free radicals through its involvement of catalases and peroxidases. In addition, iron balance or homeostasis with its regulatory proteins, such as ferroportin, hepcidin, and STEAP3, have also been found to be associated with the incidence or existence of multiple cancers.50,51 The concentration of hepcidin, a regulator of iron efflux in hepatocytes, increases in many cancers, such as myeloma, Hodgkin’s disease, breast, prostate, thyroid, and non-small cell lung cancer (NSCLC), as well as in other solid tumors. Nonetheless, inflammation could also influence iron homeostasis, as studies have confirmed the simultaneous change in inflammatory molecules with hepcidin.52 The change in iron concentration was positively correlated with CEA and PSA levels in our study; therefore, re-examination of iron and tumor markers, as well as iron-related regulatory proteins such as ferritin and transferrin, could be potential risk predicting factors in HHS with higher CEA and PSA levels.
Although we observed that CA199 was associated with multiple metabolic parameters in DKA, such as pH, only globin and tCO2 were significant determinants of CA199 levels (Table 5). This suggests that normalization of the conditions may facilitate the release of CA199,53–55 This suggests that alterations in liver protein synthesis and the involvement of immune responses in infections, inflammation, or oxidative stress may require further investigation. tCO2 may be more effective in predicting changes in CA199 than pH value; however, it is also a marker that indicates the severity of acidosis. According to prior clinical investigations,54,55 the cutoff for CA199 in diabetic patients to differentiate pancreatic cancer is 75–98.4U/mL. However, in patients with conventional diabetic complications, a CA199 level that exceeded 10.83U/mL only indicates glucose impairment [56]. In the DKA group, the mean level of CA199 was 40.75±62.88U/mL, which is lower than that of pancreatic cancer but higher than that of other diabetic complications, according to the current study. No conspicuous tumors were observed in this group.
Conclusion
The present study demonstrated a significant increase in CA199 levels in patients with DKA, whereas CEA, PSA, and CPSA levels increased in patients with HHS. Furthermore, we examined the correlations between tumor markers and other critical clinical attributes in patients with DKA or HHS. A multilinear study indicated that increasing CEA in patients with HHS could be predicted by a variety of risk factors, whereas CA199 in DKA may be associated with multiple metabolic parameters in DKA. Additional research is necessary to better understand the mysteries of elevated CEA, CA199, and other tumor markers in diabetic patients with DKA or HHS.
Ethical Statement
The study, including sampling, examinations, and access to or utilization of the raw data, obtained ethical approval from the Shanghai Pudong Hospital (WZ-010). All participants were informed and volunteered provided informed consent prior to participating in the study. The guidelines were outlined and the procedures were conducted in accordance with the Declaration of Helsinki. All the data used in this study were anonymized before use.
Acknowledgments
We would like to thank the staff of the Shanghai Pudong Hospital for providing numerous invaluable contributions to this study.
Author Contributions
All authors made a significant contribution to the work reported, whether that is in the conception, study design, execution, acquisition of data, analysis, and interpretation, or in all these areas; took part in drafting, revising or critically reviewing the article; gave final approval of the version to be published; have agreed on the journal to which the article has been submitted; and agree to be accountable for all aspects of the work.
Funding
This work was supported by the Integrated Traditional Chinese and Western Medicine (YC-2023-0404), Fudan Zhangjiang Clinical Medicine Innovation Fund Project (KP0202118), Fudan Good Practice Program of Teaching and Learning (FD2023A227), Project of Key Medical Discipline of Pudong Hospital of Fudan University (Zdxk2020-11), Project of Key Medical Specialty and Treatment Center of Pudong Hospital of Fudan University (Zdzk2020-24), Integrative Medicine special fund of Shanghai Municipal Health Planning Committee (ZHYY- ZXYJHZX-2-201712), Special Department Fund of the Pudong New Area Health Planning Commission (PWZzk2017-03), Outstanding Leaders Training Program of Pudong Health Bureau of Shanghai (PWR12014-06), Pudong New Area Clinical Plateau Discipline Project (PWYgy-2021-03), the Natural Science Foundation of China (21675034), National Natural Science Foundation of China (81370932), Shanghai Natural Science Foundation (19ZR1447500), Pudong New Area Clinical Characteristic Discipline Project (PWYts2021-11), Pudong New Area Clinical Characteristic Discipline Project (PWYts2021-01), Wenzhou Medical University Education Grant (JG2021197).
Disclosure
The authors declare that there is no potential conflict of interest.
This paper has been uploaded to [SSRN] as a preprint: [https://papers.ssrn.com/sol3/papers.cfm?abstract_id=4732714].
References
1. Umpierrez G, Korytkowski M. Diabetic emergencies - ketoacidosis, hyperglycaemic hyperosmolar state and hypoglycaemia. Nat Rev Endocrinol. 2016;12(4):222–232. doi:10.1038/nrendo.2016.15
2. Dhatariya KK, Vellanki P. Treatment of Diabetic Ketoacidosis (DKA)/Hyperglycemic Hyperosmolar State (HHS): novel advances in the management of hyperglycemic crises (UK Versus USA). Curr Diab Rep. 2017;17(5):33. doi:10.1007/s11892-017-0857-4
3. Dhatariya KK, Glaser NS, Codner E, Umpierrez GE. Diabetic ketoacidosis. Nature Reviews Disease Primers. 2020;6(1):40. doi:10.1038/s41572-020-0165-1
4. Pasquel FJ, Umpierrez GE. Hyperosmolar hyperglycemic state: a historic review of the clinical presentation, diagnosis, and treatment. Diabetes Care. 2014;37(11):3124–3131. doi:10.2337/dc14-0984
5. Scott AR. Management of hyperosmolar hyperglycaemic state in adults with diabetes. Diabet med. 2015;32(6):714–724. doi:10.1111/dme.12757
6. Stratigou T, Vallianou N, Vlassopoulou B, et al. DKA cases over the last three years: has anything changed? Diabetol Metab Syndr. 2019;13(2):1639–1641. doi:10.1016/j.dsx.2019.03.022
7. Stoner GD. Hyperosmolar Hyperglycemic State. Am Family Phys. 2017;96(11):729–736.
8. Giovannucci E, Harlan DM, Archer MC, et al. Diabetes and cancer: a consensus report. Diabetes Care. 2010;33(7):1674–1685. doi:10.2337/dc10-0666
9. Supabphol S, Seubwai W, Wongkham S, Saengboonmee C. High glucose: an emerging association between diabetes mellitus and cancer progression. J Mol Med. 2021;99(9):1175–1193. doi:10.1007/s00109-021-02096-w
10. Shikata K, Ninomiya T, Kiyohara Y. Diabetes mellitus and cancer risk: review of the epidemiological evidence. Cancer Sci. 2013;104(1):9–14. doi:10.1111/cas.12043
11. Suh S, Kim KW. Diabetes and Cancer: cancer should be screened in routine diabetes assessment. Diabet Metabol J. 2019;43(6):733–743. doi:10.4093/dmj.2019.0177
12. Desai S, Guddati AK. Carcinoembryonic antigen, carbohydrate antigen 19-9, cancer antigen 125, prostate-specific antigen and other cancer markers: a primer on commonly used cancer markers. World J Surg Oncol. 2023;14(1):4–14. doi:10.14740/wjon1425
13. Abudawood M, Tabassum H, Almaarik B, Aljohi A. Interrelationship between oxidative stress, DNA damage and cancer risk in diabetes (Type 2) in Riyadh, KSA. Saudi J Biol Sci. 2020;27(1):177–183. doi:10.1016/j.sjbs.2019.06.015
14. Zhang D. Correlation between blood glucose control and levels of carbohydrate antigen 19-9 and carcinoembryonic antigen in patients with type-2 diabetes mellitus. Diabetes Metab Syndr Obes. 2022;15:
15. Du ZX, Liang MM, Sun J, Wang WJ, Liu YH, Yang JH. Clinical significance of serum CA-125, CA19-9 and CEA in pulmonary tuberculosis with and without type 2 diabetes. Tuberculosis. 2017;107:104–110. doi:10.1016/j.tube.2017.08.006
16. Liu XY. The high prevalence of short-term elevation of tumor markers due to hyperglycemia in diabetic patients. Diabetes Metab Syndr Obes. 2022;15:1113–1122. doi:10.2147/DMSO.S350599
17. Silsirivanit A. Glycosylation markers in cancer. Advances in Clinical Chemistry. 2019;89:189–213.
18. Abelev GI, Sell S. Tumor markers. Introduction. Semi Cancer Biol. 1999;9(2):61–65. doi:10.1006/scbi.1998.0088
19. ElSayed NA, Aleppo G, Aroda VR, et al. 2. Classification and diagnosis of diabetes: standards of care in diabetes-2023. Diabetes Care. 2023;46(Suppl 1):S19–s40.
20. Rosenthal NR, Barrett EJ. An assessment of insulin action in hyperosmolar hyperglycemic nonketotic diabetic patients. J Clin Endocrinol Metab. 1985;60(3):607–610. doi:10.1210/jcem-60-3-607
21. Shang X, Song C, Du X, Shao H, Xu D, Wang X. The serum levels of tumor marker CA19-9, CEA, CA72-4, and NSE in type 2 diabetes without malignancy and the relations to the metabolic control. Saudi Med J. 2017;38(2):204–208.
22. Shimojo N, Naka K, Nakajima C, et al. The effect of non-insulin-dependent diabetes on serum concentrations of tumor-associated carbohydrate antigens of CA19-9, CA-50, and sialyl SSEA-1 in association with the Lewis blood phenotype. Int j Clin Chem. 1990;190(3):283–289. doi:10.1016/0009-8981(90)90182-R
23. Illés D, Terzin V, Holzinger G, et al. New-onset type 2 diabetes mellitus--A high-risk group suitable for the screening of pancreatic cancer? Pancreatology. 2016;16(2):266–271. doi:10.1016/j.pan.2015.12.005
24. Uygur-Bayramicli O, Dabak R, Orbay E, et al. Type 2 diabetes mellitus and CA 19-9 levels. World J Gastroenterol. 2007;13(40):5357–5359. doi:10.3748/wjg.v13.i40.5357
25. Zayed AA, Beano AM, Amer FN, et al. SERUM LEVELS OF CARCINOEMBRYONIC ANTIGEN IN PATIENTS WITH TYPE 2 DIABETES. Endocr Pract. 2016;22(11):1310–1318.
26. Hsieh YS, Yeh MC, Lin YY, et al. Is the level of serum lactate dehydrogenase a potential biomarker for glucose monitoring with type 2 diabetes mellitus? Front Endocrinol. 2022;13:1099805.
27. Forkasiewicz A, Dorociak M, Stach K, Szelachowski P, Tabola R, Augoff K. The usefulness of lactate dehydrogenase measurements in current oncological practice. Cell Mol Biol Lett. 2020;25(1):35. doi:10.1186/s11658-020-00228-7
28. Iwamoto Y, Kimura T, Tatsumi F, et al. Effect of hyperglycemia-related acute metabolic disturbance on thyroid function parameters in adults. Front Endocrinol. 2022;13:869869. doi:10.3389/fendo.2022.869869
29. Fliers E, Boelen A. An update on non-thyroidal illness syndrome. J Endocrinol Invest. 2021;44(8):1597–1607.
30. Van den Berghe G. Non-thyroidal illness in the ICU: a syndrome with different faces. Thyroid. 2014;24(10):1456–1465. doi:10.1089/thy.2014.0201
31. Sciacchitano S, Capalbo C, Napoli C, et al. Nonthyroidal illness syndrome: to treat or not to treat? Have we answered the question? A review of meta analysis. Front Endocrinol. 2022;13:850328. doi:10.3389/fendo.2022.850328
32. Farwell AP. Thyroid hormone therapy is not indicated in the majority of patients with the sick euthyroid syndrome. Endocr Pract. 2008;14(9):1180–1187. doi:10.4158/EP.14.9.1180
33. DeGroot LJ. “Non-thyroidal illness syndrome” is functional central hypothyroidism, and if severe, hormone replacement is appropriate in light of present knowledge. J Endocrinol Invest. 2003;26(12):1163–1170. doi:10.1007/BF03349151
34. Weidman SW, Ragland JB, Fisher JN Jr, Kitabchi AE, Sabesin SM. Effects of insulin on plasma lipoproteins in diabetic ketoacidosis: evidence for a change in high density lipoprotein composition during treatment. J Lipid Res. 1982;23(1):171–182. doi:10.1016/S0022-2275(20)38186-4
35. Kitabchi AE, Umpierrez GE, Fisher JN, Murphy MB, Stentz FB. Thirty years of personal experience in hyperglycemic crises: diabetic ketoacidosis and hyperglycemic hyperosmolar state. J Clin Endocrinol Metab. 2008;93(5):1541–1552. doi:10.1210/jc.2007-2577
36. Gordon EE, Duga J. Experimental hyperosmolar diabetic syndrome. Ketogenic response to medium-chain triglycerides. Diabetes. 1975;24(3):301–306. doi:10.2337/diab.24.3.301
37. Nakatani T, Yasuda K, Ozawa K. Hyperglycemic hyperosmolar nonketotic dehydration in relation to blood ketone body ratio in partially hepatectomized rabbits. Am J Surg. 1988;155(4):559–563. doi:10.1016/S0002-9610(88)80410-0
38. Lefebvre P, Cariou B, Lien F, Kuipers F, Staels B. Role of bile acids and bile acid receptors in metabolic regulation. Physiol Rev. 2009;89(1):147–191. doi:10.1152/physrev.00010.2008
39. Lassus J, Harjola VP. Cystatin C: a step forward in assessing kidney function and cardiovascular risk. Heart Failure Reviews. 2012;17(2):251–261. doi:10.1007/s10741-011-9242-6
40. Xu C, Gong M, Wen S, Zhou M, Li Y, Zhou L. The comparative study on the status of bone metabolism and thyroid function in diabetic patients with or without ketosis or ketoacidosis. Diabetes Metab Syndr Obes. 2022;15:779–797. doi:10.2147/DMSO.S349769
41. Heuft L, Voigt J, Selig L, Stumvoll M, Schlögl H, Kaiser T. Refeeding Syndrome. Deutsches Arzteblatt International. 2023;120(7):107–114. doi:10.3238/arztebl.m2022.0381
42. Rossi S, Romoli M, Urbinati G, et al. Acute stroke-like deficits associated with nonketotic hyperglycemic hyperosmolar state: an illustrative case and systematic review of literature. Neurolo Sci. 2022;43(8):4671–4683.
43. Chang LH, Lin LY, Tsai MT, et al. Association between hyperglycaemic crisis and long-term major adverse cardiovascular events: a nationwide population-based, propensity score-matched, cohort study. BMJ open. 2016;6(8):e012233. doi:10.1136/bmjopen-2016-012233
44. Madonna R, Pieragostino D, Balistreri CR, et al. Diabetic macroangiopathy: pathogenetic insights and novel therapeutic approaches with focus on high glucose-mediated vascular damage. Vascr Pharmacol. 2018;107:27–34.
45. Taguchi M, Bouchi R, Fukuda T, et al. Clinical significance of tumor markers in patients with type 2 diabetes: a retrospective observational study. Diabetol int. 2023;14(1):40–50.
46. Wang CH, Yu C, Zhuang L, et al. High-normal serum carcinoembryonic antigen levels and increased risk of diabetic peripheral neuropathy in type 2 diabetes. Diabetol Metab Syndr. 2022;14(1):142. doi:10.1186/s13098-022-00909-7
47. Chang CH, Weng HH, Lin YC, Lin CN, Huang TJ, Chen MY. Association between serum carcinoembryonic antigen and cardiometabolic risks: implication for cardiometabolic prevention. Front Endocrinol. 2023;14:1113178. doi:10.3389/fendo.2023.1113178
48. Lelièvre P, Sancey L, Coll JL, Deniaud A, Busser B. Iron dysregulation in human cancer: altered metabolism, biomarkers for diagnosis, prognosis, monitoring and rationale for therapy. Cancers. 2020;12(12):3524. doi:10.3390/cancers12123524
49. Charlebois E, Pantopoulos K. Nutritional aspects of iron in health and disease. Nutrients. 2023;15(11):2441. doi:10.3390/nu15112441
50. Cardona CJ, Montgomery MR. Iron regulatory proteins: players or pawns in ferroptosis and cancer? Front Mol Biosci. 2023;10:1229710. doi:10.3389/fmolb.2023.1229710
51. Estêvão D, da Cruz-Ribeiro M, Cardoso AP, et al. Iron metabolism in colorectal cancer: a balancing act. Cell Oncol. 2023;46(6):1545–1558. doi:10.1007/s13402-023-00828-3
52. Wessling-Resnick M. Iron homeostasis and the inflammatory response. Annu Rev Nutr. 2010;30:105–122. doi:10.1146/annurev.nutr.012809.104804
53. Gul K, Nas S, Ozdemir D, Gumus M, Ersoy R, Cakir B. CA 19-9 level in patients with type 2 diabetes mellitus and its relation to the metabolic control and microvascular complications. Am J Med Sci. 2011;341(1):28–32. doi:10.1097/MAJ.0b013e3181f0e2a0
54. Cui L, Lv N, Li B, et al. Serum CA 19-9 level is correlated to the clinical characteristics and chronic complications of patients newly diagnosed with type 2 diabetes mellitus. Exp Clin Endocrinol Diabetes. 2021;129(8):581–586. doi:10.1055/a-0994-9970
55. Kim SH, Baek CO, Lee KA, Park TS, Baek HS, Jin HY. Clinical implication of elevated CA 19-9 level and the relationship with glucose control state in patients with type 2 diabetes. Endocrine. 2014;46(2):249–255. doi:10.1007/s12020-013-0058-0
 © 2024 The Author(s). This work is published and licensed by Dove Medical Press Limited. The
full terms of this license are available at https://www.dovepress.com/terms.php
and incorporate the Creative Commons Attribution
- Non Commercial (unported, 3.0) License.
By accessing the work you hereby accept the Terms. Non-commercial uses of the work are permitted
without any further permission from Dove Medical Press Limited, provided the work is properly
attributed. For permission for commercial use of this work, please see paragraphs 4.2 and 5 of our Terms.
© 2024 The Author(s). This work is published and licensed by Dove Medical Press Limited. The
full terms of this license are available at https://www.dovepress.com/terms.php
and incorporate the Creative Commons Attribution
- Non Commercial (unported, 3.0) License.
By accessing the work you hereby accept the Terms. Non-commercial uses of the work are permitted
without any further permission from Dove Medical Press Limited, provided the work is properly
attributed. For permission for commercial use of this work, please see paragraphs 4.2 and 5 of our Terms.