")
Back to Journals » Infection and Drug Resistance » Volume 18
The Role of L-Sorbose Metabolism in Enhancing Fitness and Virulence in Escherichia coli Under Acidic Conditions
Authors Qiu T, Chen X, Deng X, Zhang G, Wen S, Wu J, Sun D, Li T, Yan B, Dai M, Zhong LL , Tian GB
Received 27 March 2025
Accepted for publication 20 May 2025
Published 20 June 2025 Volume 2025:18 Pages 3071—3086
DOI https://doi.org/10.2147/IDR.S526664
Checked for plagiarism Yes
Review by Single anonymous peer review
Peer reviewer comments 2
Editor who approved publication: Professor Chi H. Lee
Tian Qiu,1,* Xudong Chen,1,* Xue Deng,2– 5 Guili Zhang,2– 5 Shu’an Wen,2– 5 Ji Wu,2– 5 Dandan Sun,6 Tong Li,2– 5 Bin Yan,2,7 Min Dai,1 Lan-Lan Zhong,2– 5 Guo-Bao Tian2– 5
1School of Laboratory Medicine, Chengdu Medical College, Chengdu, 610500, People’s Republic of China; 2Advanced Medical Technology Center, The First Affiliated Hospital, Zhongshan School of Medicine, Sun Yat-Sen University, Guangzhou, 510080, People’s Republic of China; 3State Key Laboratory of Oncology in South China, Sun Yat-Sen University Cancer Center, Guangzhou, 510060, People’s Republic of China; 4Department of Immunology, School of Medicine, Sun Yat-Sen University, Shenzhen, 518107, People’s Republic of China; 5Key Laboratory of Tropical Diseases Control (Sun Yat-Sen University), Ministry of Education, Guangzhou, 510080, People’s Republic of China; 6School of Medicine, Xizang Minzu University, Xianyang, 712082, People’s Republic of China; 7Department of Neonatal Surgery, Guangzhou Women and Children’s Medical Center, Guangzhou, 510080, People’s Republic of China
*These authors contributed equally to this work
Correspondence: Guo-Bao Tian, Department of Immunology, School of Medicine, Sun Yat-Sen University, Shenzhen, 518107, People’s Republic of China, Tel/Fax +86 20 87335387, Email [email protected] Lan-Lan Zhong, Department of Immunology, School of Medicine, Sun Yat-Sen University, Shenzhen, 518107, People’s Republic of China, Tel/Fax +86 20 87335387, Email [email protected]
Background: Pathogenic Escherichia coli (E. coli) causes a wide range of infections in humans and animals, imposing a significant global health burden. While metabolic flexibility is critical for E. coli fitness to host environments, the role of secondary carbon sources like L-Sorbose remains poorly characterized.
Methods: The functional importance of L-Sorbose metabolism in E. coli CFT073 was investigated under acidic conditions simulating gastrointestinal and urinary tract environments. A ΔsorD mutant, with deletion of a key gene in L-Sorbose catabolism, was generated, and its growth, viability, virulence factors, proton motive force (PMF), oxidative stress levels, and transcriptomic profiles under acidic pH (3.5– 5.5) were assessed. Virulence was further tested using a Galleria mellonella infection model.
Results: Deletion of sorD caused severe growth defects, loss of virulence factors (flagella and fimbriae), disrupted PMF, and oxidative stress accumulation under acidic conditions. Transcriptomic analysis revealed dysregulation of energy metabolism pathways and downregulation of virulence-associated genes in the ΔsorD mutant. Importantly, L-Sorbose metabolism deficiency significantly attenuated bacterial survival at pH 3.5 and reduced virulence in the G. mellonella model.
Conclusion: These findings demonstrate that L-Sorbose metabolism is essential for E. coli to maintain energy homeostasis, virulence, and acid resistance. Targeting this pathway may offer a novel therapeutic strategy against pathogenic E. coli infections.
Keywords: pathogenic Escherichia coli, virulence, fitness, L-Sorbose metabolism, acid tolerance, oxidative stress
Introduction
Escherichia coli (E. coli) is the predominant opportunistic pathogen in the human gut microbiome and exhibits both commensal and pathogenic potential.1 While commensal E. coli strains generally coexist harmlessly with their host, specific strains or serotypes have evolved distinct virulence factors that enable them to colonize new ecological niches and cause diseases such as enteric infections, urinary tract infections, sepsis, and meningitis.2 The rise of these pathogenic strains, coupled with increasing antibiotic resistance,3–5 has become a significant global health challenge, highlighting the urgent need for alternative therapeutic strategies beyond traditional antibiotics.
A key factor in the success of pathogenic E. coli is its ability to colonize the host gut6 as a foodborne bacterium, most E. coli strains, including enteropathogenic E. coli (EPEC) and uropathogenic E. coli (UPEC), rely on gut colonization to establish infection, except for enteroinvasive E. coli (EIEC), which can invade host cells directly.7,8 During colonization, E. coli encounters various complex environmental stressors in the host gastrointestinal (GI) tract, including gastric acid, bile salts, antimicrobial peptides, short-chain fatty acids, and nutrient limitations.9–11 Overcoming these challenges and outcompeting resident microbiota is crucial for successful colonization and persistence.
Pathogenic E. coli employs various strategies to gain competitive advantages, including inducing host inflammation and occupying unique ecological niches.12,13 Metabolic flexibility plays a pivotal role, enabling pathogenic strains to utilize secondary carbon sources like galactose, hexuronates, and ethanolamine, which commensal strains cannot metabolize.14,15 Additionally, pathogenic E. coli can modify siderophores to evade host iron restriction mechanisms, further enhancing its survival.16,17 Similar metabolic adaptation has been observed in in vitro studies.18 Under moderate acid stress (pH 5.0–5.7), E. coli upregulates genes involved in the transport and metabolism of secondary carbon sources, such as sorbitol and galactitol. These carbon sources produce fewer acidic byproducts than glucose, reducing extracellular acidification and benefiting acid-stressed cells. Notably, the small intestine environment typically maintains a pH range (pH 4.0–6.0), which is similar to moderate acid stress conditions due to organic acids produced by the resident microbiota.19 In addition to nutrient acquisition, E. coli must effectively adapt to this mildly acidic environment to establish a competitive advantage for successful colonization and persistent survival.20 These findings underscore the importance of specific metabolic pathways, particularly secondary carbon source utilization, in promoting E. coli survival and persistence in the gut environment, as well as the impact of mildly acidic conditions.
L-Sorbose is a rare sugar found in plants, feed, and dietetic foods, and it serves as a secondary carbon source frequently utilized by E. coli.21 Previous studies have demonstrated the widespread ability of pathogenic E. coli strains to metabolize L-Sorbose, as evidenced by comparative analyses of L-Sorbose utilization capabilities and transcriptional levels of the L-Sorbose metabolic operon (sor) among different pathotypes. Notably, most serotypes of EIEC are unable to utilize L-Sorbose, further underscoring the link between L-Sorbose metabolism and intestinal colonization.22 Additionally, computational simulations suggest that E. coli strains capable of metabolizing L-Sorbose possess a selective advantage within the human gut microbiota23 Furthermore, studies have shown that among two E. coli strains isolated from the same patient, the one with stronger fitness to the gut and urinary tract exhibits a greater ability to utilize L-sorbose.24 These findings imply that insights into the impact of L-Sorbose metabolic pathways on gut fitness could inform the development of novel therapeutic strategies targeting pathogenic E. coli infections. However, experimental evidence on the role of L-Sorbose metabolism in E. coli’s gut fitness and virulence remains limited.
This study demonstrates that L-Sorbose metabolism significantly enhances E. coli’s fitness and virulence under moderate acidic stress (pH 4–5.5), simulating environments such as the host gastrointestinal and urinary tract. Moreover, under more acidic conditions (pH 3.5), it improved E. coli’s survival ability.
Materials and Methods
Bacterial Strains and Culture Media
All studies were performed in the well characterized UPEC CFT07325 (with the ability to metabolize L-Sorbose), and derived isogenic deletion mutants. Bacteria were grown in Luria–Bertani (LB) broth, LBS (LB+2% L-Sorbose), LBG (LB+0.5% glucose), E minimal medium (0.8 mM MgSO4, 10 mM citric acid, 57.5 mM K2HPO4, 16.7 mM NaNH3HPO4, 0.5% glucose, 2% L-Sorbose),26 M9 minimal medium (M9+2%/4% L-Sorbose) or on LB agar at 37 °C. The medium pH was adjusted by the addition of hydrochloric acid (HCl) (The pH of LB medium without added HCl was approximately 6.5), Select the pH conditions based on experimental requirements and the availability of reagents. Antibiotics were used at the following final concentrations: ampicillin, 100 µg/mL; kanamycin, 50ug/mL; spectinomycin, 100ug/mL.
Strain Construction
The chromosomal gene sorD was deleted by CRISPR–Cas9-mediated genome editing in E. coli CFT073 as previously described, with appropriate modifications.27 Briefly, three 20-bp spacer fragments targeting sorD were digested with BsmBI (Thermo Scientific) and inserted into pgRNA (Addgene #44251). Primers Cri-sorD-up-homo-5F/Cri-sorD-up-homo-3R and Cri-sorD-down-homo-5F/Cri-sorD-down-homo-3R were used to clone two 500-bp homologous arms from the E. coli CFT073 genomic template. Two homologous arms were fused together using overlap PCR. For generating electrocompetent cells, bacterial cells were resuspended in 100 µL of 10% glycerol solution, and after electroporation (2500 V, 200 Ω, 25 μF, 5 ms pulse duration), they were incubated in LB medium for 3 hours at 30°C and then plated on LB agar plates containing 100 µg/mL spectinomycin and 100 µg/mL ampicillin. The initial validation of the mutant strain CFT073ΔsorD was performed using primers Validation-5F/Validation-3R, followed by confirmation through Sanger (DNA) sequencing.
To construct the complemented strain of CFT073ΔsorD, primers SORD-5F/SORD-3R were used to clone the sorD DNA fragment from the E. coli CFT073 genomic template. The pgRNA was linearized using primers pgRNA-SC-5F/pgRNA-SC-3R, and then seamlessly fused with the sorD DNA fragment using a seamless cloning kit (Beyotime). The pgRNA-sorD was then transformed into the CFT073ΔsorD recipient strain. After electroporation (2500 V, 200 Ω, 25 μF, 5 ms pulse duration), the bacterial cells were incubated in LB medium for 3 hours at 37°C, followed by plating on LB agar plates containing 100 µg/mL ampicillin. The complemented strain was confirmed by Sanger (DNA) sequencing.
The primer sequences used in the study are shown inSupplementary Table S1.
Growth Curve Assays
Strains were grown overnight in LB medium to mid-log phase. The cultures were centrifuged at 6000 rpm for 5 min and washed twice with 0.9% sodium chloride (NaCl). All samples were normalized to an OD600 of 1.0 in 0.9% NaCl. Fresh LBS medium was adjusted to pH 5.5, 4.5, and 4.0 using HCl. For the assay, 2 µL of culture was added to 198 µL of LBS medium (pH 6.5, 5.5, 4.5, 4.0) in a 96-well plate. When indicated, 20 µL of culture was added to 180 µL of M9 medium. Absorbance values were measured every 30 min using a BioTek microplate reader. Each strain was tested in triplicate (three independent biological replicates).
In vitro Competition Assays
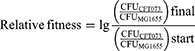
The relative fitness of E. coli CFT073, CFT073ΔsorD, and CFT073ΔsorD::sorD strains was determined using in vitro competition assays. Appropriate modifications were made to the previously described method.28 These strains were competed against E. coli MG1655, which carried the kanamycin-resistant plasmid pACYCD-J23119-sfGFP. Colony-forming unit (CFU) was counted on LB agar plates and kanamycin-resistant LB agar plates to assess changes in CFU during the competition. The assays were performed in triplicate (three independent biological replicates) in M9 medium adjusted to different pH levels with 2% L-Sorbose added. Overnight cultures were grown in LB medium with the appropriate antibiotics (ampicillin for CFT073ΔsorD::sorD and kanamycin for MG1655), then centrifuged at 6,000 rpm for 5 min, washed three times with 0.9% NaCl, and all samples were normalized to an OD600 of 1.0 in 0.9% NaCl. The CFT073, CFT073ΔsorD, and CFT073ΔsorD::sorD strains were mixed at a 1:1 ratio with MG1655, and 300 µL of the mixture was added to 2700 µL of M9 medium at different pH levels (pH 4.5, 5.5, 6.5). CFU counting was performed before competition to determine initial ratios. The mixtures were incubated at 37°C with shaking to start the competition. CFU counting was conducted at 24 and 48 h post-competition to determine the strain CFU ratios of the competing strains. The relative fitness was calculated using the appropriate formula.
Acid Tolerance Assays
Acid tolerance assays of logarithmic-phase cells were conducted with slight modifications to previously described methods.29 Briefly, overnight cultures were grown in LB medium with antibiotics as necessary (ampicillin for CFT073ΔsorD::sorD), then diluted 1:100 into 3 mL of fresh LB medium and incubated with shaking until mid-logarithmic-phase (OD600 of 0.7–0.8). After centrifugation at 6,000 rpm for 5 min, cells were washed twice with 0.9% NaCl.
To determine survival, all samples were normalized to an OD600 of 1.0 in 0.9% NaCl before serial dilution and spot-plating for CFU prior to acid exposure. Fresh LBS medium was adjusted to the target pH with HCl, and the bacterial suspension was diluted 1:50 into this acidic medium and incubated without shaking at 37°C for either 30 or 120 min. After incubation, 1.5 mL of acid-treated samples underwent serial dilution and CFU plating. Survival rates were calculated from three independent biological replicates by dividing CFU/mL after acid stress by CFU/mL from the initial sample.
Flow Cytometry-Based Bacterial Viability Assays
Bacterial viability following acid stress was quantified using the LIVE/DEAD® BacLight™ Bacterial Viability and Counting Kit (Thermo Fisher Scientific, MA, USA), which stains cells as red (dead), green (alive) or double staining (dying). The detailed experimental steps are as follows:
The acid-stressed sample (1 mL) was centrifuged with untreated E. coli CFT073 (for the live-cell suspension) at 10000 rpm for 5 min. The supernatant was discarded, and cells were resuspended in 1 mL of 0.9% NaCl. Another aliquot of untreated E. coli CFT073 was prepared and resuspended in 1 mL of 70% isopropanol after centrifugation (for the dead-cell suspension). The samples were incubated at room temperature for 30 min, mixing the suspension every 15 min. After incubation, all samples were centrifuged at 10000 rpm for 5 min, the supernatant was discarded, and cells were washed twice with 1 mL 0.9% NaCl. To the flow cytometry analysis tube, 977 µL of 0.9% NaCl was added. Then, 1.5 µL of 3.34 mM SYTO 9 nucleic acid stain and 1.5 µL of 30 mM propidium iodide were added to the flow cytometry tube. The bacterial suspension (10 µL) was added to the staining solution. The samples were incubated in the dark at room temperature for 15 min. The stained bacteria were analyzed using flow cytometry.
Testing Acid Resistance (AR) Systems
The test of AR1-3 has been appropriately modified based on the methods described in previous studies.30 For AR1, cultures were grown overnight at 37°C in LB medium at pH 5.5. The negative control samples were grown overnight at 37°C in EG medium at pH 7.0. The overnight cultures were centrifuged at 6,000 rpm for 5 min and washed twice with 0.9% NaCl before serial dilution and spot-plating for CFU prior to acid exposure. Cultures were then diluted 1:1000 into EG medium at pH 3.5 and pH 7.0, while the negative control was diluted 1:1000 into EG medium at pH 3.5. All diluted cultures were incubated at 37°C for 2 h, followed by CFU counting to determine survival rates.
For AR2 and AR3, cultures were grown overnight at 37°C in LBG medium at pH 6.5 (glucose represses the RpoS-dependent oxidative system). The overnight cultures were centrifuged at 6,000 rpm for 5 min to discard the medium and washed twice with 0.9% NaCl before serial dilution and spot-plating for CFU prior to acid exposure. Cultures were then diluted 1:1000 into EG medium at pH 3.5 (negative control) and EG medium at pH 3.5 supplemented with 1.5 mM glutamic acid (for AR3, 1 mM arginine was added instead). All diluted cultures were incubated at 37°C for 2 h, followed by CFU counting to determine survival rates.
Survival rates were calculated by dividing the CFU/mL after acid stress by the CFU/mL from the initial sample.
Quantitative RT-PCR
The relative mRNA levels of key virulence factor genes in E. coli CFTO73 were detected. These genes include type 1 fimbriae (fimH), P fimbriae (papG-II), hemolysin (hlyA), biofilm formation (csgA), capsular polysaccharide (kpsM, rcsA), enterotoxin A (entA), iron acquisition (iroN, chuA), and lipopolysaccharide (LPS) biosynthesis (lpxC, msbA). The general procedures are as follows: Total RNA was isolated from bacterial culture using Bacteria RNA Extraction Kit (Vazyme) according to the manufacturer’s instructions. Removal of genomic DNA and synthesis of cDNA was carried out using Evo M-MLV RT Mix Kit with gDNA Clean for qPCR Ver.2 (Accurate Biology). qRT-PCR was conducted using SYBR® Green Premix Pro Taq HS qPCR Kit II (Accurate Biology). Housekeeping gene rpoA was used as a reference control to normalize total RNA quantity of different samples. The relative difference of mRNA level was calculated using the ΔΔCt method.31 Each sample was subjected to three independent biological replicates for qRT-PCR analysis.
Galleria Mellonella Infection Model
The Galleria mellonella infection model was used to assess the in vivo virulence of CFT073, CFT073ΔsorD, and CFT073ΔsorD::sorD under neutral and weakly acidic conditions. G. mellonella larvae (Corn worm farm) were stored in the dark and used within three days of shipment. Prior to inoculation, all strains were treated for two hours at pH 6.5 and pH 5.5, following the acid tolerance assay protocol. Then, wash the bacterial suspension with sterile PBS and dilute it to 107 CFU/mL. A 10 μL volume of the bacterial suspension was injected into the hemocoel of each larva through the rear left pro-leg.32,33 Ten larvae per group were randomly selected for inoculation, and the experiment was repeated three times. After injection, the larvae were incubated at 37°C, and their survival was monitored daily for four days. Larvae were considered dead when they no longer responded to touch. Kaplan-Meier survival curves were used for data analysis. Three control groups were included in the experiment: Group 1, 10 larvae injected with 10 μL of sterile PBS; Group 2, a mock injection to ensure that larvae did not die from physical trauma; and Group 3, with no injection. No larval deaths were observed in the control groups.
Transcriptomic Analysis
Following the acid tolerance assay protocol, the samples were treated at pH 3.5 for 30 min, the RNA sequencing (RNA-seq) analysis of CFT073, CFT073ΔsorD, and CFT073ΔsorD::sorD were conducted. Raw data were filtered and trimmed using fastp.34 Clean reads from each sample were mapped to the reference genome using HISAT235 to identify the source genes of the reads, generating SAM files that stored the mapping information. SAM files were then converted to the binary BAM format using SAMtools,36 followed by sorting based on reference coordinates and index construction. Transcripts were assembled and quantified using StringTie,37 normalizing the data with Fragments Per Kilobase of transcript per Million mapped reads and Transcripts Per Million metrics. The raw counts of gene expression were calculated using prepDE.py.
For downstream analysis, differential gene expression (DEGs) between samples was assessed using the DESeq2 package, followed by clustering analysis and functional annotation.38 Gene Ontology (GO) and Kyoto Encyclopedia of Genes and Genomes (KEGG) pathway analyses were performed to identify enriched functions and pathways of the DEGs. Data visualization was carried out using the R package ggplot2. RNA-seq analysis was performed on three independent biological replicates for each strain.
ATP, Inorganic Phosphate and NAD+/NADH Level Detection
Following the acid tolerance assay protocol, E. coli samples were immediately placed on ice for pre-cooling. Subsequently, intracellular ATP and inorganic phosphate concentrations were quantified using the ATP assay kit (Beyotime) and malachite green phosphate assay kit (Cayman Chemical), respectively. Additionally, the NAD+/NADH ratio was determined following the manufacturer’s instructions provided with the assay kits (Beyotime). All measurements were performed in accordance with the standardized protocols outlined in the respective kit manuals. Each strain and condition was tested in triplicate, with three independent biological replicates.
Analysis of Bacterial Proton-Motive Force (PMF)
A flow cytometry-based assay was utilized to measure the proton motive force using the BacLight™ Bacterial Membrane Potential Kit (Invitrogen), as per manufacturer’s instructions. Briefly, all strains subjected to acid tolerance assays were diluted in phosphate-buffered saline (PBS) to a final concentration of approximately 106 cells/mL. Subsequently, 1 mL of each bacterial suspension was transferred to flow cytometry tubes. Two additional tubes containing 1 mL of CFT073 bacterial suspension were prepared as membrane potential disrupted and unstained controls. For the membrane potential disrupted control, 10 μL of 500 μM CCCP was added and mixed thoroughly. To all tubes except the unstained control, 10 μL of 3 mM DiOC2(3) was added and mixed thoroughly. The samples were incubated at room temperature for 30 min. The stained bacteria were analyzed using flow cytometry. The intracellular pH was determined using a fluorescence-based method as previously described in the literature.39 Briefly, following the acid tolerance assay protocol, 5 mM BCECF-AM (Beyotime) was added to the bacteria. The samples were then incubated in the dark at 37°C for 1 hour. The fluorescence intensity was measured using a BioTek microplate reader (excitation/emission wavelengths: 488/535 nm). Each strain and condition was tested in triplicate, with three independent biological replicates.
Flow Cytometry
Flow cytometric analysis was performed using a Gallios™ Flow Cytometer (Beckman Coulter Life Sciences) with excitation at 488 nm and emission detected in both the red (630 nm) and green (515 nm) channels. The data were analyzed using the Kaluza software (Beckman Coulter Life Sciences) and visualized with GraphPad Prism.
Scanning Electron Microscope (SEM) Analysis
SEM observation was performed according to previously published methods with slight modifications.40 In brief, after treatment of E. coli following the acid tolerance assay protocol, the bacterial suspensions were washed twice with sterile PBS. The samples were then fixed with 2.5% glutaraldehyde at 4°C overnight, followed by washing and dehydration through a graded ethanol series (30–100%). After critical point drying, the samples were sputter-coated with gold and examined using a scanning electron microscope.
Motility Assays
The motility assays were performed following the protocol described in previous studies.41 The swimming plates were prepared using 0.3% (w/v) LBS agar (supplemented with 2% L-Sorbose), and the pH was adjusted to the appropriate level by adding HCl. E. coli was grown overnight in fresh LB medium, centrifuged at 6,000 rpm for 5 min, and washed twice with 0.9% NaCl. The cultures were then normalized to an OD600 of 1.0 with 0.9% NaCl. Subsequently, 1 µL of the culture was inoculated onto the swimming plates by submerging pipette tips into the cultures and pricking the center of the plates. The plates were incubated for 18 h, and the swimming motility zone was measured. Each strain and condition was tested in triplicate, with three independent biological replicates.
Fluorescence Microscope Based ROS Detection
The fluorescence microscope was used to determine the levels of intracellular ROS using Reactive Oxygen Species Assay Kit (Beyotime) following the manufacturer’s instructions. Briefly, the different treatment groups were stained with 10 μmol/L H2DCFDA and incubated at 37°C for 20 min in a dark environment. Then, the bacteria were photographed using an upright microscope (Olympus BX63).
Sensitivity Assays
Following the instructed acid tolerance treatment, E. coli cultures were serially diluted. An 8 µL aliquot of each dilution was then spotted onto LB agar plates, as well as LB agar plates supplemented with specified concentrations of sodium dodecyl sulfate (SDS) and ethylenediaminetetraacetic acid (EDTA). The plates were incubated at 37°C for approximately 20 h.
Biofilm Assays
Biofilm formation was detected using the crystal violet staining method.42 All strains were grown overnight in LB medium. The cultures were then centrifuged at 6,000 rpm for 5 min, washed twice with 0.9% NaCl, and normalized to an OD600 of 1.0. Fresh LBS medium was adjusted to pH 5.5 and 4.5 using HCl. In a 96-well plate, 198 µL of LBS medium (pH 4.5, 5.5, 6.5) was inoculated with 2 µL of the adjusted culture and incubated statically at 37°C for 48 h. After incubation, the planktonic cells and medium were gently removed, followed by washing the wells three times with PBS. The adherent cells in each well were fixed with 100 µL of methanol for 15 min, after which the methanol was removed, and the wells were air-dried. Each well was then stained with 200 µL of 1% crystal violet solution for 20 min. The wells were then washed three times with PBS to remove unbound crystal violet and air-dried at room temperature. The crystal violet bound to the biofilm was solubilized with 200 µL of 95% ethanol, and absorbance was measured at 590 nm. Biofilm formation assays were performed in triplicate (three independent biological replicates) with three technical replicates per biological replicate.
Data Availability
RNA sequencing data obtained in this study are available at the NCBI Sequence Read Archive under accession PRJNA1183564.
Statistical Analysis
All statistical analyses were performed using GraphPad Prism (version 8.0.2; GraphPad Software). Statistical significance for comparisons between two groups was determined using Student’s t tests, while the log rank test was employed for multiple comparisons. The exact P-values and sample sizes are indicated in each figure legend. A P-value of ≤0.05 was considered statistically significant.
Results
Inhibiting L-Sorbose Metabolism Reduces the Adaptability and Survival Capacity of E. coli in Acidic Environments
To explore the role of L-Sorbose metabolism in E. coli, a sorD knockout strain (CFT073ΔsorD) and a complemented strain (CFT073ΔsorD::sorD) were generated and confirmed by growth on L-Sorbose as the sole carbon source (Figure S1A and B). Growth characteristics were then evaluated across a permissive pH range (4.0–6.5). At pH 6.5, CFT073 and CFT073ΔsorD exhibited comparable growth rates, whereas the complemented strain displayed mild growth retardation. This observed fitness cost likely stems from the metabolic burden associated with maintaining the plasmid carrying both the sorD gene and ampicillin resistance marker. Such growth impairment represents a well-documented phenomenon in plasmid-bearing strains, especially in the absence of antibiotic selection, as cellular resources are continuously allocated to plasmid maintenance and resistance gene expression.43 Progressive growth defects in CFT073ΔsorD were observed at pH 5.5–4.0 (Figure 1A). As acidity increased (pH 5.5–4.0), CFT073ΔsorD displayed progressively severe growth deficiencies compared to CFT073 and CFT073ΔsorD::sorD (Figure 1B–D). Competitive fitness under acidic conditions was assessed through in vitro competition assays against E. coli MG1655. At pH 6.5, CFT073 and CFT073ΔsorD showed no significant fitness differences. However, under acidic conditions (pH 5.5 and 4.5), CFT073 consistently demonstrated a significant fitness advantage over CFT073ΔsorD within 48 hours. Notably, at pH 4.5, CFT073ΔsorD::sorD surpassed CFT073ΔsorD in fitness after 48 hours (Figure 1E).
 |
Figure 1 Inhibiting L-Sorbose metabolism mediates survival and growth defects in E. coli under acidic conditions. (A–D) Growth of CFT073 (yellow), CFT073ΔsorD (green), and CFT073ΔsorD::sorD (purple) in LBS medium at pH 6.5 (A) 5.5 (B), 4.5 (C) and 4.0 (D) (E) Relative fitness for CFT073, CFT073ΔsorD, and CFT073ΔsorD::sorD in in vitro competition against MG1655 strain. (F and G) CFT073, CFT073ΔsorD, and CFT073ΔsorD::sorD were incubated in either LBS or LB medium at pH 3.5 for 30 min, followed by serial dilution on LB agar plates, and the bacteria were grown at 37°C, a representative result from three independent experiments is shown (F); percent survival in acid is calculated as the number of CFU after acid treatment, relative to the untreated control (G). (H) After staining with SYTO9 and propidium iodide, the survival rate was statistically analyzed and expressed as the percentage of SYTO9-positive (alive) cells. Data are presented as the mean ± SD of three biological replicates. Student’s t tests were performed to determine the statistical significance for two group comparisons (ns, no significance; *, P < 0.05; **, P < 0.01; ***, P < 0.001; ****, P < 0.0001). |
The impact of L-Sorbose metabolism on bacterial survival was further examined under extreme acidity (pH 3.5), where growth is unfeasible. CFT073ΔsorD exhibited significantly reduced survival at pH 3.5 compared to wild-type and complemented strains, with SYT09-PI staining confirming membrane damage (Figures 1F–H and S1C–E). Importantly, L-Sorbose metabolism’s protective effect under strong acidity was independent of the classic acid resistance systems (Figure S1F and G).
These results suggest that L-Sorbose metabolism can enhance the adaptability and survival of E. coli in acidic environments, independent of the classic acid resistance systems of the bacterium.
Inhibition of L-Sorbose Metabolism Results in Decreased Virulence of E. coli Under Acidic Conditions
The relationship between L-Sorbose metabolism and E. coli virulence was investigated by quantifying the relative mRNA levels of key virulence genes in CFT073ΔsorD under different pH conditions. While virulence gene expression in CFT073ΔsorD remained unchanged at pH 6.5, >50% of tested genes (eg, fimH, papG-II) were downregulated at pH ≤ 5.5, whereas biofilm-associated genes (csgA, rcsA) were upregulated (Figure 2A–D).
 |
Figure 2 Inhibition of L-Sorbose metabolism lead to a reduced virulence of E. coli under acidic conditions. (A–C) qRT-PCR analysis of the relative mRNA levels of virulence factor genes (fimH,papG-II, hlyA, csgA, kpsM, rcsA, entA, chuA, iroN, lpxC, and msbA) in CFT073, CFT073ΔsorD, and CFT073ΔsorD::sorD after 2 hours of treatment at pH 6.5 (A), pH 5.5 (B), and pH 3.5 (C). (D)Relative mRNA levels of virulence factors in CFT073ΔsorD after 2 hours of treatment at pH 6.5, pH 5.5, and pH 3.5. (E-F) Kaplan Meier curves showing the survival rates of G. mellonella infected with CFT073, CFT073ΔsorD, and CFT073ΔsorD::sorD over 96 hours. (E and F) Survival rates of G. mellonella infected with CFT073, CFT073ΔsorD, and CFT073ΔsorD::sorD after 2 hours of treatment at pH 6.5 (E); survival rates after 2 hours of treatment at pH 5.5 (F). Data (A–D) are presented as the mean ± SD of three biological replicates. Student’s t tests were performed to determine the statistical significance for two group comparisons; survival curves were plotted using the Kaplan-Meier method and statistical analysis was performed using the log rank test for multiple comparisons (ns, no significance; *, P<0.05; **, P < 0.01; ***, P < 0.001; ****, P < 0.0001). |
Further validation was performed using a Galleria mellonella infection model. After pretreatment at pH 6.5, larvae infected with CFT073ΔsorD had lower survival rates (20%) compared to the wild type CFT073 (60%) at 96 hours (Figure 2E). At pH 5.5, survival rates for CFT073ΔsorD (40%) were higher than the wild type (0%) (Figure 2F). Notably, the wild type exhibited higher virulence under acidic conditions (Figure 2E and F).
Overall, the deficiency in L-Sorbose metabolism leads to a significant reduction in E. coli virulence under weakly acidic conditions.
Abnormal Energy Metabolism, Oxidative Stress, and a General Downregulation of Virulence Factor Expression in E. coli with Deficient L-Sorbose Metabolism
Transcriptomic analysis was conducted to elucidate the impact of L-Sorbose metabolism on CFT073, CFT073ΔsorD, and CFT073ΔsorD::sorD under pH 3.5 acid stress. This approach allowed us to investigate the molecular mechanisms underlying the observed defects in acid adaptability and survival. KEGG and GO analyses were first employed to investigate pathways at the systemic level. KEGG pathway enrichment analysis for the L-Sorbose metabolism inhibition strain CFT073ΔsorD revealed significant impacts on oxidative phosphorylation, flagellar assembly, and bacterial chemotaxis pathways (Figure 3A). These pathways are all highly associated with energy metabolism. Similarly, GO analysis highlighted significant enrichment in carbohydrate metabolism and organic substance transport pathways, further emphasizing changes in energy metabolism. Oxidoreductase activity-related pathways were also significantly enriched (Figure 3B). At the gene level, respiratory chain and TCA cycle-related genes were upregulated (Figure 3C and D), while virulence factors (eg, fimH, papG-II) were downregulated (Figure 3F), consistent with qRT-PCR results. Concurrently, oxidative stress response genes exhibited elevated expression (Figure 3E). These transcriptomic data reveal the characteristics of metabolic dysregulation, oxidative stress, and weakened virulence in CFT073ΔsorD under acidic conditions.
 |
Figure 3 Inhibition of L-Sorbose metabolism results in transcriptional signatures of abnormal energy metabolism, oxidative stress, and reduced virulence in E. coli under acidic conditions. Transcriptome sequencing was performed on CFT073, CFT073ΔsorD, and CFT073ΔsorD::sorD after treatment at pH 3.5 for 30 min. (A) Top five enriched Kyoto Encyclopedia of Genes and Genomes (KEGG) pathways for all differentially expressed genes (DEGs). (B) Enriched Gene Ontology (GO) terms of upregulated genes. The x-axis represents the gene ratio, which indicates the proportion of DEGs associated with a specific pathway relative to the total number of DEGs in the dataset. The y-axis shows the negative log10 scale of the adjusted p-values [-log10 (adjusted p-value)], reflecting the significance level of the differential expression. (C–F) Upregulation and downregulation of genes involved in the respiratory chain (C), glycolysis and the tricarboxylic acid (TCA) cycle (D), oxidative stress and DNA repair (E), and key virulence factors (F). All transcriptomic heat maps display log2 fold changes. For data in (A) and (B), the significance was tested using the hypergeometric test, with correction using the Benjamini–Hochberg method. Source data are provided in the Source Data file. |
Inhibition of L-Sorbose Metabolism Leads to Abnormal Energy Metabolism and ROS Accumulation in E. coli Under Acidic Conditions
To extend our transcriptomic analysis of energy metabolism, intracellular ATP and Pi levels were measured in E. coli under pH 3.5–6.5. At pH 6.5, CFT073ΔsorD and the wild type showed no significant ATP differences. However, CFT073ΔsorD exhibited a sharp ATP drop below pH 5.5, with levels at pH 3.5 nearly tenfold lower than the wild type, and it is noteworthy that the survival of all strains under extreme acidic conditions is accompanied by ATP consumption (Figures 4A and S2). Intracellular Pi levels increased with decreasing pH, with CFT073ΔsorD showing significantly higher Pi levels below pH 6.5 compared to other strains (Figure 4B). PMF analysis showed stable membrane potential above pH 3.5 in all strains, while CFT073ΔsorD exhibited elevated ΔpH. Complete PMF disruption was observed in CFT073ΔsorD at pH 3.5 (Figures 4C–E and S3), coinciding with impaired ATP synthesis. Subsequent SEM examination showed intact membranes but complete absence of fimbriae and flagella in CFT073ΔsorD at pH 3.5 (Figure 4F), suggesting a loss of adhesion to host cells and a reduced chemotactic ability to chemicals. Motility assays confirmed weakened movement in CFT073ΔsorD at pH 4.5–5.5, with near-complete loss at pH 4.0 (Figures 4G and S4).
 |
Figure 4 Inhibition of L-Sorbose metabolism disrupts energy metabolism-related functions and induces ROS accumulation in E. coli under acidic conditions. (A–D) CFT073, CFT073ΔsorD, and CFT073ΔsorD::sorD were incubated for 30 min in LBS medium at pH 6.5, 5.5, 4.5, and 3.5. After incubation, multiple physiological parameters were assessed as described in the Materials and Methods section: intracellular ATP content (A), the increment of inorganic phosphate levels (B), ΔpH (C), and membrane potential alterations (D). (E) After staining with DiOC2(3), membrane potential of E. coli was assessed using flow cytometry following a 30 min incubation at pH 3.5. (F) Scanning electron microscopy (SEM) images of all strains exposed to pH 6.5 and 3.5 for 30 min. (G) The swimming diameters of the strains at pH 6.5, 5.5, and 4.5. (H) The NAD+/NADH ratios of all strains at pH 6.5, 5.5, 4.5, and 3.5. (I and J) ROS detection: Representative fluorescence images of H2DCFDA-stained cells at pH 4.5 and 4.0 (green indicates ROS-positive cells) (I); Quantitative analysis of fluorescence intensity (J). Data are presented as the mean ± SD of three biological replicates. Student’s t-tests were performed to determine the statistical significance for two-group comparisons (ns, no significance; *, P < 0.05; **, P < 0.01; ***, P < 0.001; ****, P < 0.0001). |
Consistent with upregulated TCA cycle genes in transcriptomic data, the NAD+/NADH ratio in CFT073ΔsorD significantly decreased at pH ≤ 4.5 (Figure 4H), indicating TCA cycle activation. This was accompanied by ROS accumulation. At a pH above 4.5, no fluorescence was detected in any strain. However, within the pH range of 4.5 to 4.0, all strains showed ROS-positive cells, with CFT073ΔsorD exhibiting a significantly higher number of ROS-positive cells and stronger fluorescence signals (Figure 4I and J). Increased detergent sensitivity in CFT073ΔsorD post-acid treatment confirmed ROS-induced outer membrane damage (Figure S5).
Biofilm formation, a critical bacterial survival strategy against environmental stress, is closely linked to various stress responses.44 Strikingly, CFT073ΔsorD exhibited significantly enhanced biofilm formation across all tested pH conditions compared to the wild type, with further augmentation under acidic conditions (pH 5.5 and 4.5). In contrast, both the wild type and complemented strains maintained relatively stable biofilm levels regardless of pH fluctuations (Figure S6).
In summary, under acidic conditions, CFT073ΔsorD exhibited dysregulated energy metabolism and hyperactive biofilm formation. While this may represent a compensatory survival strategy, it ultimately reduced bacterial fitness due to ROS accumulation and increased membrane permeability in host-relevant pH environments.
Discussion
UPEC distinguishes itself from intestinal pathogenic E. coli (IPEC) by colonizing diverse acidic host environments, including the gastrointestinal tract (pH 1.5–9),45 vagina (pH 3.8–5), and urinary tract (pH 5.5–7).29 Recent advances in microbial pathogenesis have highlighted metabolic flexibility as a cornerstone of bacterial survival and virulence, enabling pathogens to exploit niche-specific nutrients and outcompete commensal microbiota.46,47 While ethanolamine utilization (eut operon) and siderophore-mediated iron acquisition are well-characterized metabolic strategies in E. coli,17,48 the role of rare sugars like L-Sorbose remained unclear, despite evidence of its widespread utilization by pathogenic E. coli.22 This study demonstrates that L-Sorbose metabolism is indispensable for UPEC’s acid tolerance, virulence, and host colonization. Deletion of sorD, a key gene in L-Sorbose catabolism, severely impaired acid adaptation in UPEC. Under mild acidity (pH 4.0–5.5), CFT073ΔsorD exhibited severe growth retardation and a loss of competitive fitness, while exposure to extreme acidity (pH 3.5) resulted in catastrophic survival failure due to disrupted PMF and ATP depletion (Figures 1 and 4).
Acid stress in the sorD-deficient strain causes a breakdown in energy homeostasis—the balanced production and utilization of cellular energy (primarily ATP). This impairment may manifested through three interlinked mechanisms: (1) L-Sorbose functions as a secondary carbon source, feeding into glycolysis and the TCA cycle to support ATP production, (2) its metabolism mitigates intracellular acidification, thereby preserving the PMF essential for ATP synthase activity, (3) transcriptomic analysis revealed downregulation of oxidative phosphorylation genes in CFT073ΔsorD (Figure 3A) further exacerbating energy deficits. The consequent PMF collapse not only reduced ATP levels (Figure 4A) but also impaired protein export systems, leading to loss of flagella and fimbriae (Figure 4F and G). These metabolic and structural deficiencies collectively explain the strain’s colonization failure in acidic host environments, which is a prerequisite for UPEC pathogenicity.49,50
RT-qPCR analysis further revealed that, under acidic stress, the mutant exhibited significant downregulation of key virulence genes (eg, fimH, papG-II) and upregulation of biofilm-associated genes (csgA, rcsA) (Figure 2B–D). Although increased biofilm formation is confirmed phenotypically (Figure S6), it does not compensate for the observed virulence attenuation or loss of fitness. Notably, the complemented strain CFT073ΔsorD::sorD exhibited even higher csgA mRNA levels than the wild-type (Figure 2A and C), suggesting complex regulatory cross-talk between L-Sorbose metabolism and biofilm formation. This paradoxical increase may reflect compensatory adaptations to metabolic stress, as supported by three mechanistic insights: First, the metabolic burden associated with plasmid maintenance may activate the general stress response sigma factor RpoS, which is known to upregulate csgA expression, particularly under acidic conditions.51 Second, plasmid introduction and the associated metabolic perturbations may lead to increased intracellular levels of the secondary messenger c-di-GMP, a potent inducer of csgA transcription through several regulatory pathways.52 Third, the enhanced biofilm formation observed in the CFT073ΔsorD mutant implies that sorD negatively regulates biofilm-related genes; thus, in the complemented strain, the reintroduction of sorD may restore this repression, and the elevated csgA mRNA levels may reflect a transient transcriptional overshoot during regulatory rebalancing. These findings highlight the multifaceted role of L-Sorbose in bacterial survival and pathogenicity, aligning with emerging paradigms in microbial pathogenesis, where metabolism is increasingly recognized as a virulence determinant.15,53,54 The loss of flagella and fimbriae in CFT073ΔsorD, as observed by SEM (Figure 4F), further underscores this connection. These structures are critical for motility, chemotaxis, and host adherence, and their disappearance likely results from a triad of acid-induced defects: (1) energy deprivation due to PMF collapse and ATP depletion (Figure 4A), impairing the Type III secretion system required for flagellar assembly;55 (2) oxidative damage from accumulated ROS (Figure 4I and J) degrading structural proteins56 and (3) transcriptional repression of the FlhDC regulatory cascade.57 This contrasts with pathogens like Vibrio cholerae, where catabolism of other rare sugars directly fuels motility,53 emphasizing the unique role of L-Sorbose in maintaining UPEC’s structural integrity under stress. These findings extend current understanding by demonstrating that L-Sorbose metabolism is not only required for energy homeostasis and acid resistance but also contributes to oxidative stress mitigation (Figure 4). This positions L-Sorbose catabolism as a promising antimicrobial target in the treatment of UPEC infections.
Given the increasing prevalence of multidrug-resistant UPEC strains, new therapeutic strategies are urgently needed.3,58 Traditional therapies targeting virulence factors (eg, fimbriae, toxins) face challenges due to functional redundancy.2 In contrast, L-Sorbose metabolism offers a unique vulnerability: its essentiality in acidic host environments and conservation across UPEC isolates. Inhibiting SorD could simultaneously disrupt gut persistence (a reservoir for recurrent UTIs) and reduce urinary tract virulence.59 This strategy mirrors the success of metabolic inhibitors like the antifolate drug trimethoprim,60 but with enhanced specificity, as humans lack homologous L-Sorbose metabolic pathways. Unlike broad-spectrum antibiotics (eg, β-lactams, fluoroquinolones), which act on universally essential bacterial processes and thereby promote resistance,3,61 targeting L-Sorbose metabolism may reduce resistance risk. This is due to its non-essentiality under neutral pH, limiting selective pressure in non-acidic niches, and the absence of analogous pathways in host cells, minimizing off-target effects. Nevertheless, this strategy has inherent limitations: it would primarily affect UPEC and other L-Sorbose-utilizing pathogens (eg, Shigella strains),22 necessitating companion diagnostics for precise deployment. Additionally, compensatory mutations in other sugar utilization pathways (eg, sorbitol, galactitol)15 could theoretically restore fitness. Despite these challenges, the combination of L-Sorbose inhibitors with conventional antibiotics may offer synergistic effects by disrupting both basal viability and environment-specific virulence, thereby reducing the emergence of resistance.62
Conclusion
These findings establish L-Sorbose metabolism as a critical adaptive mechanism for UPEC, integrating energy production, oxidative balance, and virulence under acidic conditions. The elucidated pathway provides a foundation for developing targeted antimicrobials that selectively disrupt pathogen survival while preserving commensal microbiota. This represents a significant advancement in the fight against multidrug-resistant infections, offering a promising alternative to traditional antibiotic therapies.
Author Contributions
All authors made a significant contribution to the work reported, whether that is in the conception, study design, execution, acquisition of data, analysis and interpretation, or in all these areas; took part in drafting, revising or critically reviewing the article; gave final approval of the version to be published; have agreed on the journal to which the article has been submitted; and agree to be accountable for all aspects of the work. Tian Qiu and Xudong Chen share first authorship.
Funding
This work was supported by the National Natural Science Foundation of China (grant number 82102441 to L.-LZ.; 82325033 to G.-BT.), The Basic and Applied Basic Research Foundation of Guangzhou (grant number 2024A04J4466 to L.-LZ.; 202201020614 to B. Y.), National Key Research and Development Program (grant number 2023YFC2307102 to G.-BT.), The Fundamental Research Funds for the Central Universities, Sun Yat-sen University (grant number 23ykzy003 to G.-BT), the Innovation Team of Chinese Medicine Administration from Sichuan Province (grant number 2023ZD02 to G.-BT and M. D.).
Disclosure
The authors declare no conflicts of interest.
References
1. Denamur E, Clermont O, Bonacorsi S, Gordon D. The population genetics of pathogenic Escherichia coli. Nat Rev Microbiol. 2021;19(1):37–54. doi:10.1038/s41579-020-0416-x
2. Kaper JB, Nataro JP, Mobley HLT. Pathogenic Escherichia coli. Nat Rev Microbiol. 2004;2(2):123–140. doi:10.1038/nrmicro818
3. Klein RD, Hultgren SJ. Urinary tract infections: microbial pathogenesis, host-pathogen interactions and new treatment strategies. Nat Rev Microbiol. 2020;18(4):211–226. doi:10.1038/s41579-020-0324-0
4. Hussein NH, AL-Kadmy IMS, Taha BM, Hussein JD. Mobilized colistin resistance (mcr) genes from 1 to 10: a comprehensive review. Mol Biol Rep. 2021;48(3):2897–2907. doi:10.1007/s11033-021-06307-y
5. Naghavi M, Vollset SE, Ikuta KS, et al. Global burden of bacterial antimicrobial resistance 1990–2021: a systematic analysis with forecasts to 2050. Lancet. 2024;404(10459):1199–1226. doi:10.1016/S0140-6736(24)01867-1
6. Conway T, Cohen PS. Commensal and pathogenic Escherichia coli metabolism in the gut. Microbiol Spectr. 2015;3(3):10.1128/microbiolspec.MBP–0006–2014. doi:10.1128/microbiolspec.MBP-0006-2014
7. Croxen MA, Finlay BB. Molecular mechanisms of Escherichia coli pathogenicity. Nat Rev Microbiol. 2010;8(1):26–38. doi:10.1038/nrmicro2265
8. Dalmasso G, Beyrouthy R, Brugiroux S, et al. Genes mcr improve the intestinal fitness of pathogenic E. coli and balance their lifestyle to commensalism. Microbiome. 2023;11(1):12. doi:10.1186/s40168-022-01457-y
9. Donaldson GP, Lee SM, Mazmanian SK. Gut biogeography of the bacterial microbiota. Nat Rev Microbiol. 2016;14(1):20–32. doi:10.1038/nrmicro3552
10. Sheikh SW, Ali A, Ahsan A, Shakoor S, Shang F, Xue T. Insights into emergence of antibiotic resistance in acid-adapted enterohaemorrhagic Escherichia coli. Antibiotics. 2021;10(5):522. doi:10.3390/antibiotics10050522
11. Kamada N, Chen GY, Inohara N, Núñez G. Control of pathogens and pathobionts by the gut microbiota. Nat Immunol. 2013;14(7):685–690. doi:10.1038/ni.2608
12. Kamada N, Kim YG, Sham HP, et al. Regulated virulence controls the ability of a pathogen to compete with the gut microbiota. Science. 2012;336(6086):1325–1329. doi:10.1126/science.1222195
13. Lupp C, Robertson ML, Wickham ME, et al. Host-mediated inflammation disrupts the intestinal microbiota and promotes the overgrowth of Enterobacteriaceae. Cell Host Microbe. 2007;2(3):204. doi:10.1016/j.chom.2007.08.002
14. Chen Y, Xiao L, Zhou M, Zhang H. The microbiota: a crucial mediator in gut homeostasis and colonization resistance. Front Microbiol. 2024;15:1417864. doi:10.3389/fmicb.2024.1417864
15. Le Bouguénec C, Schouler C. Sugar metabolism, an additional virulence factor in enterobacteria. Int J Med Microbiol. 2011;301(1):1–6. doi:10.1016/j.ijmm.2010.04.021
16. Flo TH, Smith KD, Sato S, et al. Lipocalin 2 mediates an innate immune response to bacterial infection by sequestrating iron. Nature. 2004;432:7019):917–921. doi:10.1038/nature03104
17. Ellermann M, Arthur JC. Siderophore-mediated iron acquisition and modulation of host-bacterial interactions. Free Radic Biol Med. 2017;105:68–78. doi:10.1016/j.freeradbiomed.2016.10.489
18. Kanjee U, Houry WA. Mechanisms of acid resistance in Escherichia coli. Annu Rev Microbiol. 2013;67(1):65–81. doi:10.1146/annurev-micro-092412-155708
19. Lin J, Smith MP, Chapin KC, Baik HS, Bennett GN, Foster JW. Mechanisms of acid resistance in enterohemorrhagic Escherichia coli. Appl Environ Microbiol. 1996;62(9):3094–3100.
20. Xu Y, Zhao Z, Tong W, et al. An acid-tolerance response system protecting exponentially growing Escherichia coli. Nat Commun. 2020;11(1):1496. doi:10.1038/s41467-020-15350-5
21. Crichton PB, Old DC. A biotyping scheme for the subspecific discrimination of Escherichia coli. J Med Microbiol. 1982;15(2):233–242. doi:10.1099/00222615-15-2-233
22. Lehmacher A, Bockemühl J. l-Sorbose utilization by virulent Escherichia coli and Shigella: different metabolic adaptation of pathotypes. Int J Med Microbiol. 2007;297(4):245–254. doi:10.1016/j.ijmm.2007.01.007
23. Coleman ME, Dreesen DW, Wiegert RG. A simulation of microbial competition in the human colonic ecosystem. Appl Environ Microbiol. 1996;62(10):3632–3639.
24. Chen SL, Wu M, Henderson JP, et al. Genomic diversity and fitness of E. coli strains recovered from the intestinal and urinary tracts of women with recurrent urinary tract infection. Sci Transl Med. 2013;5(184). doi:10.1126/scitranslmed.3005497
25. Welch RA, Burland V, Plunkett G, et al. Extensive mosaic structure revealed by the complete genome sequence of uropathogenic Escherichia coli. Proc Natl Acad Sci USA. 2002;99(26):17020–17024. doi:10.1073/pnas.252529799
26. Vogel HJ, Bonner, DM. Acetylornithinase of Escherichia coli: partial purification and some properties. J Biol Chem. 1956;218(1):97–106.
27. Feng S, Liang W, Li J, et al. MCR-1-dependent lipid remodelling compromises the viability of gram-negative bacteria. Emerging Microbes Infect. 2022;11(1):1236–1249. doi:10.1080/22221751.2022.2065934
28. Yang Q, Li M, Spiller OB, et al. Balancing mcr-1 expression and bacterial survival is a delicate equilibrium between essential cellular defence mechanisms. Nat Commun. 2017;8(1):2054. doi:10.1038/s41467-017-02149-0
29. Wiebe MA, Brannon JR, Steiner BD, et al. Serine deamination is a new acid tolerance mechanism observed in uropathogenic Escherichia coli. mBio. 2022;13(6):e02963–22. doi:10.1128/mbio.02963-22
30. Castanie-Cornet MP, Penfound TA, Smith D, Elliott JF, Foster JW. Control of acid resistance in Escherichia coli. J Bacteriol. 1999;181(11):3525–3535. doi:10.1128/JB.181.11.3525-3535.1999
31. Livak KJ, Schmittgen TD. Analysis of relative gene expression data using real-time quantitative PCR and the 2−ΔΔCT method. Methods. 2001;25(4):402–408. doi:10.1006/meth.2001.1262
32. Peleg AY, Jara S, Monga D, Eliopoulos GM, Moellering RC, Mylonakis E. Galleria mellonella as a model system to study Acinetobacter baumannii pathogenesis and therapeutics. Antimicrob Agents Chemother. 2009;53(6):2605–2609. doi:10.1128/AAC.01533-08
33. Williamson DA, Mills G, Johnson JR, Porter S, Wiles S. In vivo correlates of molecularly inferred virulence among extraintestinal pathogenic Escherichia coli (ExPEC) in the wax moth Galleria mellonella model system. Virulence. 2014;5(3):388–393. doi:10.4161/viru.27912
34. Chen S, Zhou Y, Chen Y, Gu J. fastp: an ultra-fast all-in-one FASTQ preprocessor. Bioinformatics. 2018;34(17):i884–i890. doi:10.1093/bioinformatics/bty560
35. Kim D, Paggi JM, Park C, Bennett C, Salzberg SL. Graph-based genome alignment and genotyping with HISAT2 and HISAT-genotype. Nat Biotechnol. 2019;37(8):907–915. doi:10.1038/s41587-019-0201-4
36. Li H, Handsaker B, Wysoker A, et al. The sequence alignment/map format and SAMtools. Bioinformatics. 2009;25(16):2078–2079. doi:10.1093/bioinformatics/btp352
37. Pertea M, Pertea GM, Antonescu CM, Chang TC, Mendell JT, Salzberg SL. StringTie enables improved reconstruction of a transcriptome from RNA-seq reads. Nat Biotechnol. 2015;33(3):290–295. doi:10.1038/nbt.3122
38. Costa-Silva J, Domingues D, Lopes FM. RNA-Seq differential expression analysis: an extended review and a software tool. PLoS One. 2017;12(12):e0190152. doi:10.1371/journal.pone.0190152
39. Yao X, Gao J, Wang L, et al. Cananga oil inhibits Salmonella infection by mediating the homeostasis of purine metabolism and the TCA cycle. J Ethnopharmacol. 2024;325:117864. doi:10.1016/j.jep.2024.117864
40. Xicohtencatl-Cortes J, Monteiro-Neto V, Ledesma MA, et al. Intestinal adherence associated with type IV pili of enterohemorrhagic Escherichia coli O157:H7. J Clin Invest. 2007;117(11):3519–3529. doi:10.1172/JCI30727
41. Du C, Huo X, Gu H, Wu D, Hu Y. Acid resistance system CadBA is implicated in acid tolerance and biofilm formation and is identified as a new virulence factor of Edwardsiella tarda. Vet Res. 2021;52:117. doi:10.1186/s13567-021-00987-x
42. Shi YJ, Fang QJ, Huang HQ, Gong CG, Hu YH. HutZ is required for biofilm formation and contributes to the pathogenicity of Edwardsiella piscicida. Vet Res. 2019;50(1):76. doi:10.1186/s13567-019-0693-4
43. San Millan A, MacLean RC. Fitness costs of plasmids: a limit to plasmid transmission. Microbiol Spectr. 2017;5(5):
44. Flemming HC, Wingender J, Szewzyk U, Steinberg P, Rice SA, Kjelleberg S. Biofilms: an emergent form of bacterial life. Nat Rev Microbiol. 2016;14(9):563–575. doi:10.1038/nrmicro.2016.94
45. Li Z, Huang Z, Gu P. Response of Escherichia coli to acid stress: mechanisms and applications—a narrative review. Microorganisms. 2024;12(9):1774. doi:10.3390/microorganisms12091774
46. Fuchs TM, Eisenreich W, Heesemann J, Goebel W. Metabolic adaptation of human pathogenic and related nonpathogenic bacteria to extra- and intracellular habitats. FEMS Microbiol Rev. 2012;36(2):435–462. doi:10.1111/j.1574-6976.2011.00301.x
47. Olive AJ, Sassetti CM. Metabolic crosstalk between host and pathogen: sensing, adapting and competing. Nat Rev Microbiol. 2016;14(4):221–234. doi:10.1038/nrmicro.2016.12
48. Kendall MM, Sperandio V. What a dinner party! Mechanisms and functions of interkingdom signaling in host-pathogen associations. mBio. 2016;7(2):e01748–15. doi:10.1128/mBio.01748-15
49. Foroogh N, Rezvan M, Ahmad K, Mahmood S. Structural and functional characterization of the fimH adhesin of uropathogenic Escherichia coli and its novel applications. Microb Pathogenesis. 2021;161:105288. doi:10.1016/j.micpath.2021.105288
50. Bano R, Mears P, Golding I, Chemla YR. Flagellar dynamics reveal fluctuations and kinetic limit in the Escherichia coli chemotaxis network. Sci Rep. 2023;13:22891. doi:10.1038/s41598-023-49784-w
51. Hengge-Aronis R. Signal transduction and regulatory mechanisms involved in control of the σS S (RpoS) subunit of RNA polymerase. Microbiol Mol Biol Rev. 2002;66(3):373–95.
52. Römling U, Galperin MY, Gomelsky M. Cyclic di-GMP: the first 25 years of a universal bacterial second messenger. Microbiol Mol Biol Rev. 2013;77(1):1–52. doi:10.1128/MMBR.00043-12
53. Almagro-Moreno S, Boyd EF. Sialic acid catabolism confers a competitive advantage to pathogenic Vibrio cholerae in the mouse intestine. Infect Immun. 2009;77(9):3807–3816. doi:10.1128/IAI.00279-09
54. Rohmer L, Hocquet D, Miller SI. Are pathogenic bacteria just looking for food? Metabolism and microbial pathogenesis. Trend Microbiol. 2011;19(7):341–348. doi:10.1016/j.tim.2011.04.003
55. Chevance FFV, Hughes KT. Coordinating assembly of a bacterial macromolecular machine. Nat Rev Microbiol. 2008;6(6):455–465. doi:10.1038/nrmicro1887
56. Imlay JA. The molecular mechanisms and physiological consequences of oxidative stress: lessons from a model bacterium. Nat Rev Microbiol. 2013;11(7):443–454. doi:10.1038/nrmicro3032
57. Wang S, Fleming RT, Westbrook EM, Matsumura P, McKay DB. Structure of the Escherichia coli FlhDC complex, a prokaryotic heteromeric regulator of transcription. J Mol Biol. 2006;355(4):798–808. doi:10.1016/j.jmb.2005.11.020
58. Echols RM, Tosiello RL, Haverstock DC, Demographic TAD. Clinical, and treatment parameters influencing the outcome of acute cystitis. Clin Infect Dis. 1999;29(1):113–119. doi:10.1086/520138
59. Nielsen KL, Dynesen P, Larsen P, Frimodt-Møller N. Faecal Escherichia coli from patients with E. coli urinary tract infection and healthy controls who have never had a urinary tract infection. J Med Microbiol. 2014;63(4):582–589. doi:10.1099/jmm.0.068783-0
60. Quinlivan EP, McPartlin J, Weir DG, Scott J. Mechanism of the antimicrobial drug trimethoprim revisited. FASEB J. 2000;14(15):2519–2524. doi:10.1096/fj.99-1037com
61. Blair JMA, Webber MA, Baylay AJ, Ogbolu DO, Piddock LJV. Molecular mechanisms of antibiotic resistance. Nat Rev Microbiol. 2015;13(1):42–51. doi:10.1038/nrmicro3380
62. Tyers M, Wright GD. Drug combinations: a strategy to extend the life of antibiotics in the 21st century. Nat Rev Microbiol. 2019;17(3):141–155. doi:10.1038/s41579-018-0141-x
 © 2025 The Author(s). This work is published and licensed by Dove Medical Press Limited. The
full terms of this license are available at https://www.dovepress.com/terms.php
and incorporate the Creative Commons Attribution
- Non Commercial (unported, 4.0) License.
By accessing the work you hereby accept the Terms. Non-commercial uses of the work are permitted
without any further permission from Dove Medical Press Limited, provided the work is properly
attributed. For permission for commercial use of this work, please see paragraphs 4.2 and 5 of our Terms.
© 2025 The Author(s). This work is published and licensed by Dove Medical Press Limited. The
full terms of this license are available at https://www.dovepress.com/terms.php
and incorporate the Creative Commons Attribution
- Non Commercial (unported, 4.0) License.
By accessing the work you hereby accept the Terms. Non-commercial uses of the work are permitted
without any further permission from Dove Medical Press Limited, provided the work is properly
attributed. For permission for commercial use of this work, please see paragraphs 4.2 and 5 of our Terms.