")
Back to Journals » Diabetes, Metabolic Syndrome and Obesity » Volume 17
Trajectories of Remnant Cholesterol are Associated with Diabetic Foot Ulcer in Adult Patients with Type 2 Diabetes: A Retrospective Cohort Study
Authors Cao B, Li K, Ke J, Zhao D
Received 1 April 2024
Accepted for publication 3 July 2024
Published 16 August 2024 Volume 2024:17 Pages 3043—3051
DOI https://doi.org/10.2147/DMSO.S461330
Checked for plagiarism Yes
Review by Single anonymous peer review
Peer reviewer comments 6
Editor who approved publication: Prof. Dr. Juei-Tang Cheng
Bin Cao,1,2,* Kun Li,1,2,* Jing Ke,1,2 Dong Zhao1,2
1Center for Endocrine Metabolism and Immune Diseases, Beijing Luhe Hospital, Capital Medical University, Beijing, 101149, People’s Republic of China; 2Beijing Key Laboratory of Diabetes Research and Care, Beijing, 101149, People’s Republic of China
*These authors contributed equally to this work
Correspondence: Jing Ke; Dong Zhao, Email [email protected]; [email protected]
Objective: This study aimed to investigate the potential association between long-term variations in remnant cholesterol (RC) levels and the development of diabetic foot ulcers (DFU) in participants with type 2 diabetes (T2D).
Methods: This was a retrospective cohort study. Variation in RC was assessed by the following metrics: mean, standard deviation (SD), coefficient of variation (CV) and trajectories pattern of RC. To identify RC trajectories, we employed the latent class mixture model. The primary endpoint was the development of DFU, and the time-to-event data were analyzed using Cox regression.
Results: A total of 1874 patients with T2D were included, with a median follow-up duration of 4.7 years. Among them, 129 individuals (6.9%) developed DFU. The proportion of DFU was significantly higher in the U-shaped group compared to the median group (P for trend < 0.001). Upon adjustment for confounding variables, the U-shaped trajectory correlated with a higher risk of DFU, demonstrating a hazard ratio (HR) of 2.57 (95% CI, 1.54– 4.27). Subgroup analysis showed the U-shaped trajectory had a higher DFU risk regardless of gender (HR=2.40 and 2.81, respectively), glycemic control (HR=1.89 and 7.41, respectively), smoking (HR=2.36 and 2.93, respectively), or hypertension (HR=2.30 and 2.97, respectively). No association was found between mean, SD and CV of RC and DFU.
Conclusion: A U-shape trajectory of RC was independently associated with an elevated risk of DFU among patients with T2D.
Keywords: diabetic foot ulcer, remnant cholesterol, trajectories, type 2 diabetes
Introduction
Diabetic foot ulcer (DFU) is defined as the damage of the skin and deeper tissues of the foot in patients with diabetes, resulting from neuropathy and/or peripheral vascular disease. It is one of the most severe chronic complications of diabetes and has emerged as a significant global public health issue. Worldwide, approximately 18.6 million people with diabetes develop DFU each year.1 Notably, up to 34% of those with diabetes will experience DFU at some point in their lives.2
Even with optimal blood glucose management, patients with type 2 diabetes (T2D) still face the threat of complications.3 This is largely attributed to the dual metabolic perturbations of hyperglycemia and dyslipidemia in diabetes. Beyond the challenges posed by elevated glucose levels, aberrant lipid profiles are commonly observed in diabetic individuals.4,5
Dyslipidemia, characterized by elevated levels of low-density lipoprotein cholesterol (LDL-C) and low levels of high-density lipoprotein cholesterol (HDL-C), plays a crucial role in the development of atherosclerosis, significantly impacting overall cardiovascular disease.6 Although rigorous LDL-C management has been shown to reduce macrovascular complications in diabetes, those with even reduced LDL-C levels still face a significant risk for lingering cardiovascular issue.7,8 Remnant cholesterol (RC), encompassing the cholesterol in triglyceride-rich lipoproteins like chylomicron remnants and very low-density lipoprotein cholesterol, contributes to the pathogenesis of atherosclerosis and peripheral artery disease in patients with T2D,9,10 which are recognized as precursors to DFU. A recent study found that diabetic patients with infected foot ulcers exhibited improved lipid profiles compared to those without ulcers, except for lower HDL-C levels, suggesting that abnormal lipid profiles may be related to the occurrence of DFU.11 However, the relationship between RC and DFU remains unclear.
This study aims to bridge this gap by evaluating the association between RC fluctuations and DFU occurrence in T2D patients. By elucidating the role of RC in DFU development, clinicians can better target lipid management alongside glucose control, reducing the incidence of DFU, and ultimately improving the effectiveness of prevention.
Methods
Study Population
We conducted a retrospective collection of clinical data from individuals with T2D who had at least one medical visit per year at the Center for Endocrine Metabolism and Immune Diseases department of Beijing Luhe Hospital from January 1, 2012, to March 31, 2020. We confirmed the occurrence of DFU using electronic medical records. Participants were tracked until they developed a DFU or until June 30, 2023. Diabetic foot ulcer was defined as a full‐thickness wound involving the foot, distal to and including the ankle.
We excluded those younger than 18 years (n=62), with presence of any DFU at baseline (n=37), or with fewer than 4 measurements for TC, HDL-C, and LDL-C (n=1095). Those diagnosed with malignant tumors (n=28), or unable to manage daily activities independently (n=41), were also excluded. A history of DFU was not considered as an exclusion criterion in this study. Finally, 1874 participants were included in the study. The median number of measurements for TC, HDL-C, and LDL-C was 7, with an interquartile range (IQR) of 6 to 9. This study was approved by the Institutional Review Board of Luhe Hospital, Capital Medical University (No. 2023-LHKY-105-02). All procedures complied with the Helsinki Declaration for the investigation of human subjects, and all patients provided written informed consent.
Data Collection
Through electronic medical records, we gathered detailed data on participants’ demographic and lifestyle. Both smoking and drinking habits were categorized as “current” or “never/former”. Hypertension was defined as having a SBP of ≥ 140 mmHg, a DBP of ≥ 90 mmHg, or being prescribed at least one antihypertensive medication.12 We computed the estimated glomerular filtration rate (eGFR) employing the Asian-modified CKD-EPI equation. Chronic kidney disease (CKD) was defined as eGFR < 60mL/min per 1.73m2.13
Laboratory Measurement
The HbA1c levels were assayed utilizing high-performance liquid chromatography, employing the ADAMS A1c HA-8180 analyzer for accurate measurements. TG, TC, HDL-C, LDL-C, serum creatinine (Cr), and uric acid (UA) were quantified using a chemiluminescence immunoassay on an AU5800 analyzer. The RC level was determined by deducting LDL-C and HDL-C from the TC level.
Variation of RC During the Follow-Up
Variation of individual RC was assessed using the following four metrics: mean, standard deviation (SD), coefficient of variation (CV), and the trajectories. Additionally, the population was categorized into three groups, considering tertiles of mean, CV, and SD, as well as the pattern of trajectories respectively.
The latent class mixture model (LCMM) represents an analytical approach to trajectory analysis. This method employs finite mixture modeling to chart the progression of continuous variables over time. We utilized the “lcmm” package in R to perform this analysis.14 We examined models encompassing latent categories varying from 2 to 5. The optimal latent categories were determined based on the model with the lowest Bayesian information criterion (BIC). The trajectories were labeled according to the visually discernible patterns of RC change over time. For each participant, a posteriori prediction probability for each trajectory were computed, and participants were categorized based on the trajectory with the highest probability.
Statistical Analyses
Means ± standard deviation or median (IQR) were used to present continuous variables, while categorical variables were summarized through counts and percentages. Continuous variables were analyzed using either the t-test or the Mann–Whitney U-test.
Multivariate Cox proportional hazard regression with backward stepwise selection was utilized to assess the association between RC variation and DFU. The model was adjusted for risk factors such as age, gender, duration of diabetes, presence of hypertension or CKD, smoking and drinking habits, average HbA1c and UA. Subgroup analyses were conducted based on gender, average HbA1c levels, history of hypertension and smoking habits. Statistical analyses were performed using R 4.3.0 (http://www.r-project.org), employing a two-sided significance level of P < 0.05
Results
Clinical Characteristics of Participants
Demographic and clinical characteristics of the study population were presented in Table 1. A total of 1874 participants were included in the analysis. The mean age of participants was 50.52 ± 11.96 years, with males constituting 55.6% (n=1042). Out of the participants, 456 (24.3%) had been diagnosed with diabetes for over 10 years. The median follow-up was 4.7 years. During this period, 129 (6.9%) of the participants developed DFU.
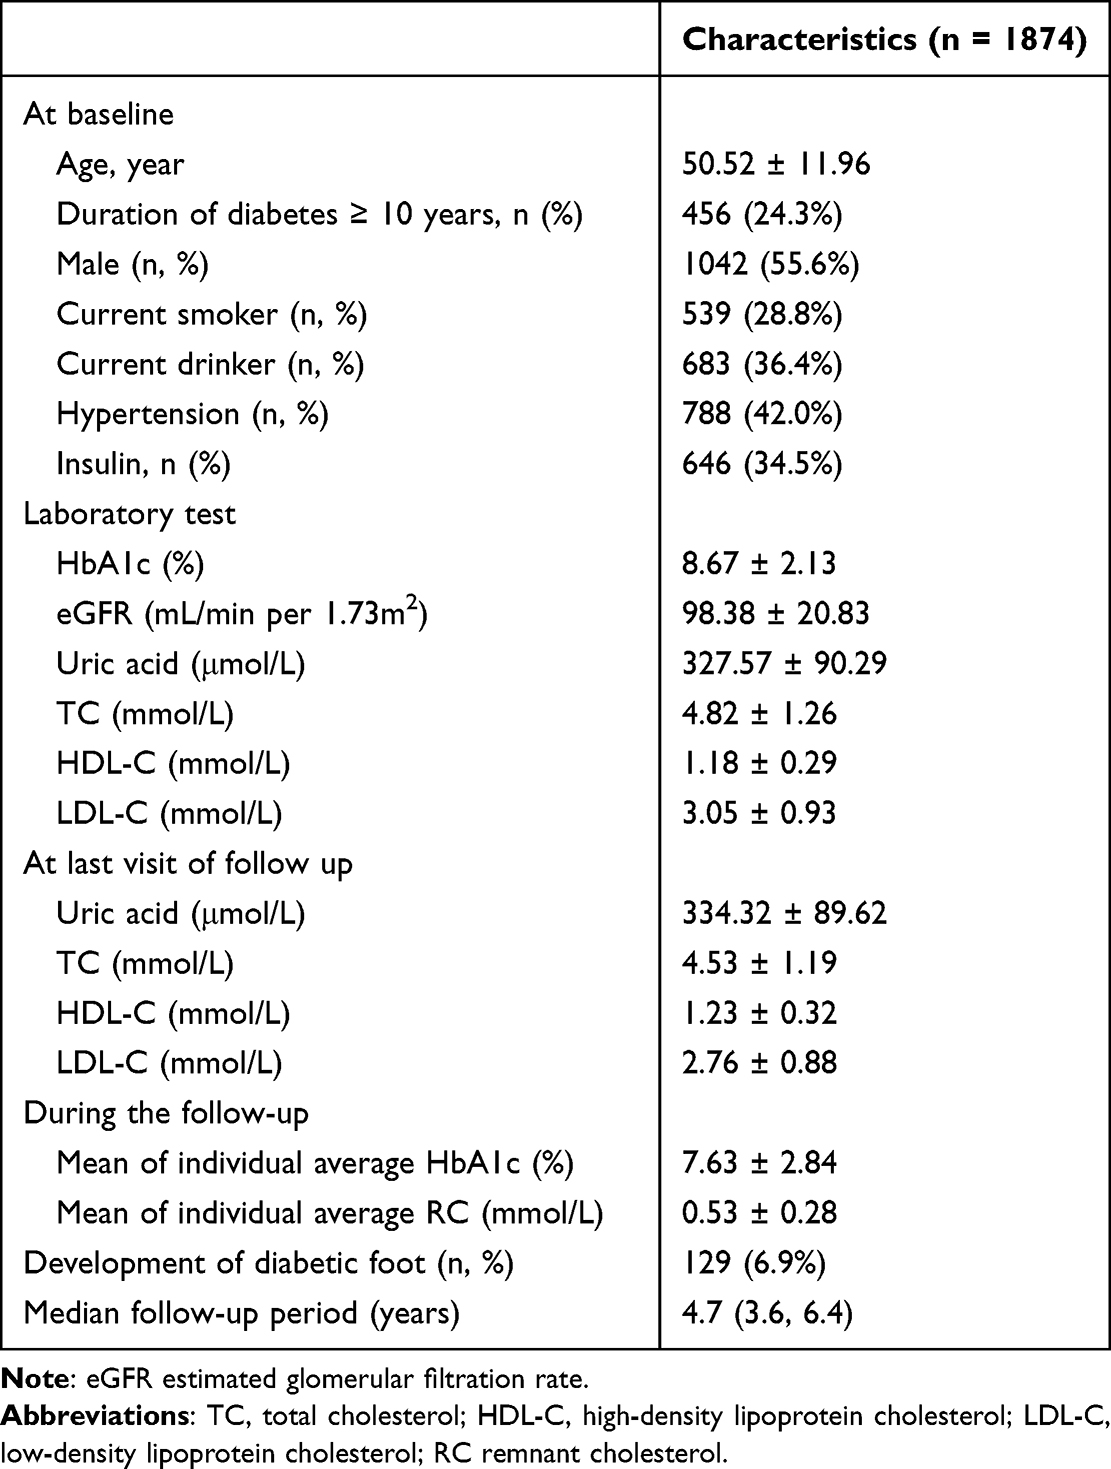 |
Table 1 Characteristics of Patients |
Trajectories of RC
Utilizing the LCMM approach, three distinct pattern of RC trajectories were identified based on the BIC. Firstly, the “median” trajectory (60.57%, n=1135) exhibited an initial mild increase, peaking around the 5 years, and then gradually regressed to its starting levels. Secondly, the “decreasing” trajectory (31.80%, n=596) consistently revealed a subtle decline over time. Lastly, the “U-shape” trajectory (7.63%, n=143) started with a dip, bottoming out around 4 years, before ascending again throughout the remainder of the observation period (Figure 1). Notably, the potential risk factors, including age, gender, duration of diabetes, presence of hypertension or CKD, smoking and drinking habits, average HbA1c and UA, did not present any statistically significant differences across these three trajectories (Table S1), implying that the varied DFU incidences among the groups was associated with their unique RC trajectories, rather than other underlying risk factors.
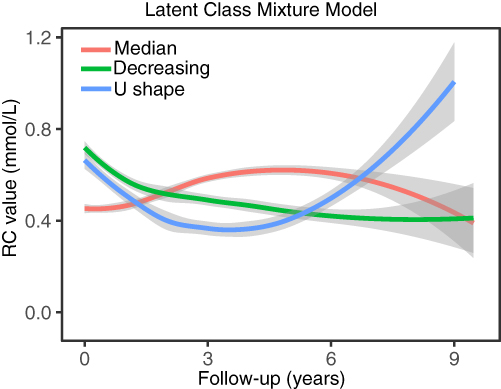 |
Figure 1 Trajectories of RC during follow-up. Solid lines show class-specific mean predicted levels (3-class latent class mixture model), shading around the lines represent confidence bands for the calculated trajectories. |
Impact of RC Variation on DFU
As illustrated in Figure 2, of the participants, 56 (4.9%), 51 (8.6%) and 22 (15.4%) developed DFU in the respective trajectories (p for trend < 0.001) (Figure 2A). However, no significant difference between incidence of DFU and tertiles of mean, CV and SD of RC (Figure 2B–D).
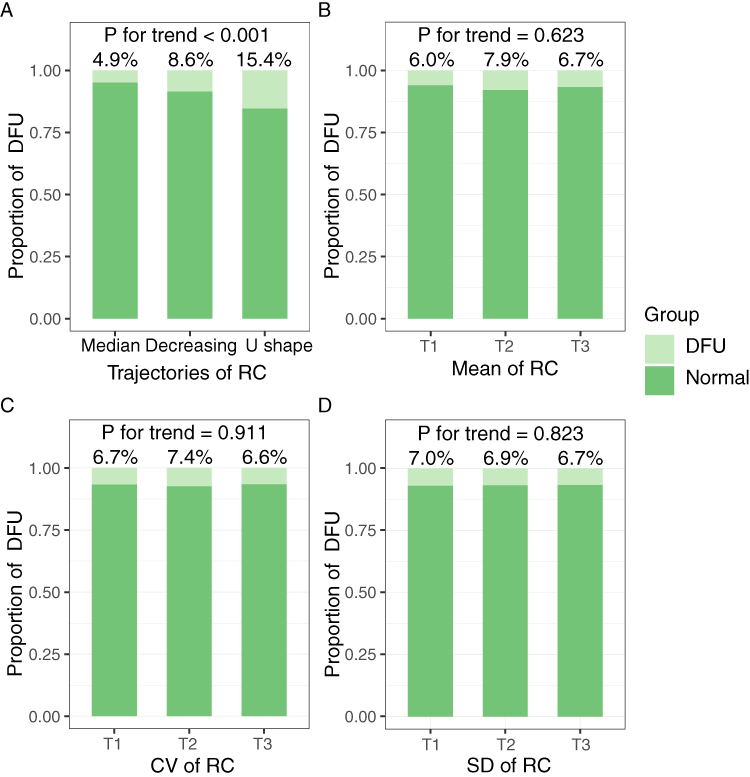 |
Figure 2 The occurrence of DFU during the follow-up. Incident of DFU was found an increase trend among the trajectories of RC (A). No significant difference in incidence of DFU among tertiles of mean, SD and CV of RC (B–D). |
As illustrated in Figure 3, univariate Cox regression revealed that among the different RC trajectories, compared to the “median” trajectory, the risk of developing DFU increased by 1.47-fold (95% CI:1.00–2.14, P = 0.049) for the “decreasing” trajectory and 2.17-fold (95% CI:1.32–3.56, P = 0.002) for the “U-shape” trajectory. Besides, the univariate Cox regression of confounding variables related to the risk of DFU was shown in Table S2.
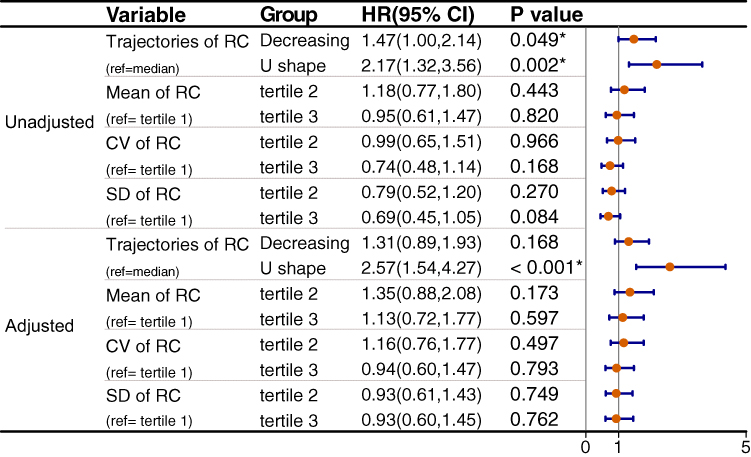 |
Figure 3 Univariate and multivariate COX regression of the association between DFU and variation of RC. The multivariate model was adjusted for age, gender, duration of diabetes, presence of hypertension or CKD, smoking and drinking habits, average HbA1c and UA. *P < 0.05. |
Even after adjusting for age, gender, duration of diabetes, presence of hypertension or CKD, smoking and drinking habits, average HbA1c and UA, the “U-shape” trajectory still exhibited a significant correlation with an elevated DFU risk, with a HR of 2.57 (95% CI: 1.54–4.27, P < 0.001). Both in the univariate and multivariate analysis, the tertiles based on the mean, SD, and CV of RC did not display a significant association with DFU.
Subgroup Analysis
The robustness of our conclusions, we undertook subgroup analyses, stratifying the participants by average HbA1c levels (either <7% or ≥7%) during the follow-up, smoking habits (either current smokers or non-smokers), presence of hypertension (either with or without), and gender (male or female) as presented in Figure 4.
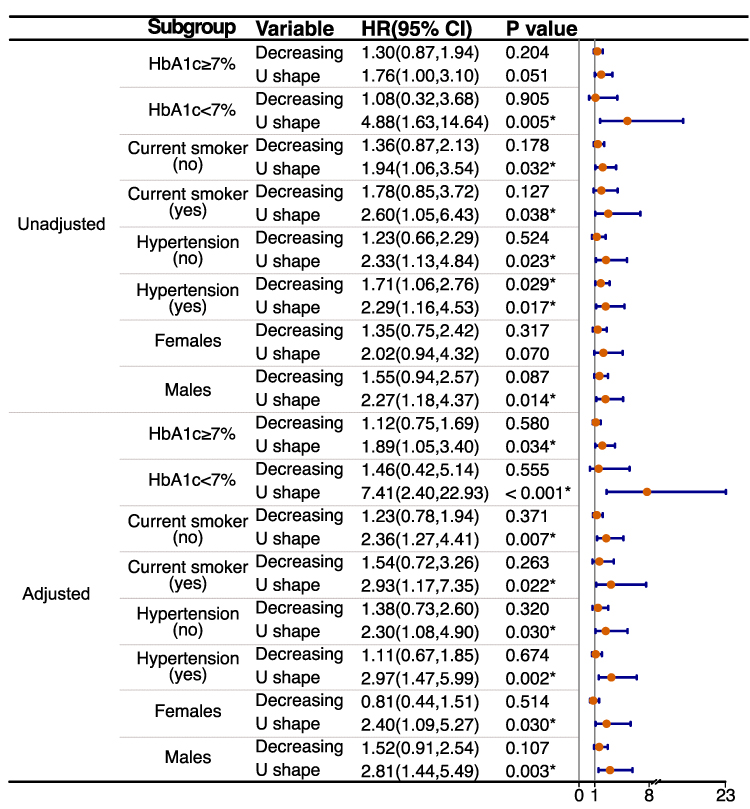 |
Figure 4 Multivariate COX regression for subgroup analysis. Participants were grouped based on average HbA1c (<7% and ≥7%), smoking habits, history of hypertension and gender. *P < 0.05. |
From the univariate COX analysis, when compared to the “median” trajectory, the “decreasing” trajectory did not exhibit a significant association with the risk of developing DFU across most subgroups, with the exception of the hypertension subgroup (HR=1.71, 95% CI: 1.06–2.76, P = 0.029). As for the “U-shape” trajectory, although the association was marginally significant in the subgroup of females or subgroup of average HbA1c≥7%, all other subgroups consistently showed a marked increase in the risk of DFU. In multivariate COX analysis, compared to the “median” trajectory, the “decreasing” trajectory did not show a significant association with the risk of DFU. Similarly, the “U-shape” trajectory consistently exhibited a significantly elevated risk of DFU across all subgroups.
Discussion
To our knowledge, this is the first longitudinal study to investigate on the relationship between variation of RC and the development of DFU. In our analysis, we explored the predictive value of trajectories of RC for DFU, independent of average HbA1c level and other traditional risk factors. We noted the following findings: 1. During the follow-up, participants with T2D can be classified into three distinct RC trajectories; 2. Among the metrics assessing variation, it is the trajectories, not the mean, SD, or CV, that holds predictive value for DFU; 3.U-shape trajectory is associated with DFU, and is a strong risk factor, even after adjusting for risk factors; 4. The predictive value of U-shape trajectory has been validated across different subgroups based on gender, glycemic control levels, smoking habits, and the presence of hypertension. These novel results suggest that the U-shaped trajectory of RC robustly correlates with an increased risk of DFU in patients with T2D.
RC encompasses the cholesterol content of triglyceride-rich lipoproteins (TRLs), including IDL and very low-density lipoprotein in a fasting state, as well as chylomicron remnants in a non-fasting state.15 These lipoproteins have the ability to penetrate and accumulate in the arterial wall, leading to foam cell formation, atherosclerosis, and low-grade inflammation.16,17 Prior research has demonstrated a strong association between RC and the occurrence of ischemic stroke, CVD, and mortality.18–20 Although dyslipidemia was related to lower limb amputation and DFU-related mortality,21–23 evidence supporting a direct association between RC and DFU is limited. Although our longitudinal cohort suggested long-time “U-shape” trajectory in RC was a risk factor of DFU, the precise mechanisms explaining the relationship between RC variability and DFU remain unclear.
Two elements are usually involved in DFU formation: obstructions in arteries and peripheral neuropathy. Diabetic-related lipid imbalances heighten the likelihood of peripheral vascular complications compared to non-diabetic individuals, given its pivotal contribution to the onset and progression of arterial stenosis.24–26 Similar to LDL molecules, RC particles can permeate the endothelium with ease, where they primarily remain due to their substantial size, contributing to the development of atherosclerosis as a consequence of cholesterol levels. Researches highlight that RC level is independent risk factor of atherosclerosis progression and major adverse cardiovascular events in T2D patients, independent of LDL cholesterol levels.9,27 Moreover, a study demonstrated that T2D patients with PAD had significantly higher levels of remnant cholesterol compared to those without PAD.28 Elevated continuous RC concentrations, along with significant fluctuations in RC, are individually associated to a higher prevalence of atherosclerosis, with their simultaneous presence resulting in notably elevated risks.29 The U-shaped trajectory represents a huge fluctuation in RC during the follow-up period. Although our study found that both higher SD and CV of RC were not associated with DFU, U-shaped trajectory is a novel form of fluctuation that is closely related to the occurrence of DFU. The U-shaped trajectory might lead to the occurrence of diabetic foot through its potential causation of lower extremity arterial disease (LEAD). This warrants further clinical investigations for validation.
Dyslipidemia is emerging as a crucial factor in peripheral neuropathy. Preclinical studies have revealed that physiological concentrations of the long-chain saturated fatty acid, palmitate, impaired mitochondrial trafficking in cultured dorsal root ganglions.30
Additionally, lipid-induced neuron damage resulting in demyelination has been proposed as a potential mechanism contributing to neuropathy onset due to dyslipidemia.31 Initial trials corroborated the findings from preclinical models, namely that glycemic control only offers limited protection against peripheral neuropathy.32 Dyslipidemia in a range of preclinical and clinical studies increase the risk of peripheral neuropathy, independent of glycemic control.33 This neuropathic compromise is even associated with the initial lipid profile of the patient with newly-diagnosed diabetes. In patients with type 2 diabetes, patients with high levels of RC often suffer from diabetic neuropathy, suggesting that elevated RC levels could exacerbate nerve damage in diabetic conditions.34,35 Although current research on RC and peripheral nerve damage is limited, a study has found that fluctuations in RC levels were associated with an increased risk of developing neuropathy.36 Therefore, high fluctuations in RC, represented by the U-shape, might be associated with both LEAD and peripheral nerve damage, leading to the occurrence of diabetic foot through these two mechanisms.
HbA1c level, male gender, presence of hypertension and smoking habits are established risk factors for DFU.37–39 These correlations may arise from the fact that sustained hyperglycemia, high blood pressure, and smoking expedite atherosclerotic and neural damages. Furthermore, men tend to take up smoking and develop hypertension earlier in life. In light of these factors, our subgroup analyses consistently found that regardless of categorization by HbA1c levels, gender, hypertension, or smoking habits, the primary conclusion holds: the U-shaped trajectory serves as a potent predictor for DFU onset.
In this study, while we made extensive adjustments for DFU risk factors, several limitations persist. To begin with, peripheral neuropathy is widely recognized as a contributing factor for the development of DFU. Yet, due to the retrospective design of our study, we could not retrieve details on peripheral neuropathy, other complications of diabetes or grading information of DFU from the medical archives. Additionally, we focused on patients who consistently followed up in our department. This meant that those not regularly follow-up at our institution were excluded, which might lead a selection bias. Lastly, treatment strategies, such as hypoglycemic treatments, statin therapies, and revascularization methods (whether surgical or endovascular), were not documented. This omission may affect the reliability of some risk evaluations.
Conclusion
In conclusion, “U-shape” trajectory of RC is independently associated with increased risk of DFU, beyond the influence of average HbA1c and other established risk factors.
In clinical practice, clinicians should aim to minimize RC fluctuation to further reduce the risk of developing DFU.
Acknowledgments
The authors appreciate the help and support from all participants who took part in the study.
Funding
This study was funded by the Science and Technology Committee of Tongzhou District (Number: KJ2023CX020).
Disclosure
The authors declare they have no conflicts of interest in this work.
References
1. Zhang Y, Lazzarini PA, McPhail SM, van Netten JJ, Armstrong DG, Pacella RE. Global disability burdens of diabetes-related lower-extremity complications in 1990 and 2016. Diabetes Care. 2020;43(5):964–974. doi:10.2337/dc19-1614
2. Armstrong DG, Boulton AJM, Bus SA, Ingelfinger JR. Diabetic foot ulcers and their recurrence. N Engl J Med. 2017;376(24):2367–2375. doi:10.1056/NEJMra1615439
3. Gerstein HC, Bosch J, Dagenais GR, et al.; ORIGIN Trial Investigators. Basal insulin and cardiovascular and other outcomes in dysglycemia. N Engl J Med. 2012;367:319–328. doi:10.1056/NEJMoa1203858
4. Chen N, Liu Y-H, Hu L-K, et al. Association of variability in metabolic parameters with the incidence of type 2 diabetes: evidence from a functional community cohort. Cardiovasc Diabetol. 2023;22(1):183. doi:10.1186/s12933-023-01922-4
5. Heidari Seyedmahalleh M, Montazer M, Ebrahimpour-Koujan S, Azadbakht L. The effect of zinc supplementation on lipid profiles in type-2 diabetes mellitus patients: a systematic review and dose-response meta-analysis of randomized clinical trials. Adv Nutr. 2023;S2161–S8313. doi:10.1016/j.advnut.2023.08.006
6. Gonna H, Ray KK. The importance of dyslipidaemia in the pathogenesis of cardiovascular disease in people with diabetes. Diabetes Obes Metab. 2019;21(Suppl 1):6–16. doi:10.1111/dom.13691
7. Hoogeveen RC, Ballantyne CM. Residual cardiovascular risk at low LDL: remnants, lipoprotein(a), and inflammation. Clin Chem. 2021;67(1):143–153. doi:10.1093/clinchem/hvaa252
8. Sandesara PB, Virani SS, Fazio S, Shapiro MD. The forgotten lipids: triglycerides, remnant cholesterol, and atherosclerotic cardiovascular disease risk. Endocr Rev. 2019;40:537–557. doi:10.1210/er.2018-00184
9. Wu Z, Wang J, Zhang H, et al. Longitudinal association of remnant cholesterol with joint arteriosclerosis and atherosclerosis progression beyond LDL cholesterol. BMC Med. 2023;21:42. doi:10.1186/s12916-023-02733-w
10. Wadström BN, Wulff AB, Pedersen KM, Jensen GB, Nordestgaard BG. Elevated remnant cholesterol increases the risk of peripheral artery disease, myocardial infarction, and ischaemic stroke: a cohort-based study. Eur Heart J. 2022;43:3258–3269. doi:10.1093/eurheartj/ehab705
11. Ardelean A, Neamtu -A-A, Balta D-F, et al. Lipid profile paradox: investigating improved lipid levels in diabetic mellitus patients with foot ulcer infections-a prospective descriptive study. Diagnostics. 2023;13:3531. doi:10.3390/diagnostics13233531
12. Zhu B, Wang J, Chen K, et al. A high triglyceride glucose index is more closely associated with hypertension than lipid or glycemic parameters in elderly individuals: a cross-sectional survey from the reaction study. Cardiovasc Diabetol. 2020;19:112. doi:10.1186/s12933-020-01077-6
13. Staplin N, Herrington WG, Murgia F, et al. Determining the relationship between blood pressure, kidney function, and chronic kidney disease: insights from genetic epidemiology. Hypertension. 2022;79:2671–2681. doi:10.1161/HYPERTENSIONAHA.122.19354
14. Proust-Lima C, Philipps V, Liquet B. Estimation of extended mixed models using latent classes and latent processes: the R package lcmm. J Stat Soft. 2017;78. doi:10.18637/jss.v078.i02
15. Varbo A, Nordestgaard BG. Remnant lipoproteins. Curr Opin Lipidol. 2017;28:300–307. doi:10.1097/MOL.0000000000000429
16. Bäck M, Yurdagul A, Tabas I, Öörni K, Kovanen PT. Inflammation and its resolution in atherosclerosis: mediators and therapeutic opportunities. Nat Rev Cardiol. 2019;16:389–406. doi:10.1038/s41569-019-0169-2
17. Chistiakov DA, Kashirskikh DA, Khotina VA, Grechko AV, Orekhov AN. Immune-inflammatory responses in atherosclerosis: the role of myeloid cells. J Clin Med. 2019;8:1798. doi:10.3390/jcm8111798
18. Li W, Huang Z, Fang W, et al. Remnant cholesterol variability and incident ischemic stroke in the general population. Stroke. 2022;53:1934–1941. doi:10.1161/STROKEAHA.121.037756
19. Yang XH, Zhang BL, Cheng Y, Fu SK, Jin HM. Association of remnant cholesterol with risk of cardiovascular disease events, stroke, and mortality: a systemic review and meta-analysis. Atherosclerosis. 2023;371:21–31. doi:10.1016/j.atherosclerosis.2023.03.012
20. Huh JH, Han K, Cho YK, et al. Remnant cholesterol and the risk of cardiovascular disease in type 2 diabetes: a nationwide longitudinal cohort study. Cardiovasc Diabetol. 2022;21:228. doi:10.1186/s12933-022-01667-6
21. Ulloque-Badaracco JR, Mosquera-Rojas MD, Hernandez-Bustamante EA, et al. Association between lipid profile and apolipoproteins with risk of diabetic foot ulcer: a systematic review and meta-analysis. Int J Clin Pract. 2022;2022:1–15. doi:10.1155/2022/5450173
22. Li X, Xiao T, Wang Y, et al. Incidence, risk factors for amputation among patients with diabetic foot ulcer in a Chinese tertiary hospital. Diabet Res Clin Pract. 2011;93:26–30. doi:10.1016/j.diabres.2011.03.014
23. Ikura K, Hanai K, Shinjyo T, Uchigata Y. HDL cholesterol as a predictor for the incidence of lower extremity amputation and wound-related death in patients with diabetic foot ulcers. Atherosclerosis. 2015;239:465–469. doi:10.1016/j.atherosclerosis.2015.02.006
24. Lewis EA, Muñiz-Anquela R, Redondo-Angulo I, González-Cintado L, Labrador-Cantarero V, Bentzon JF. Capacity for LDL (Low-Density Lipoprotein) retention predicts the course of atherogenesis in the murine aortic arch. Arterioscler Thromb Vasc Biol. 2023;43:637–649. doi:10.1161/ATVBAHA.122.318573
25. Wilkinson MJ, Lepor NE, Michos ED. Evolving management of low-density lipoprotein cholesterol: a personalized approach to preventing atherosclerotic cardiovascular disease across the risk continuum. J Am Heart Assoc. 2023;12:e028892. doi:10.1161/JAHA.122.028892
26. Higashi Y. Endothelial function in dyslipidemia: roles of LDL-cholesterol, HDL-cholesterol and triglycerides. Cells. 2023;12. doi:10.3390/cells12091293
27. Wang K, Ding Y, Wang R, Yang J, Liu X. Remnant cholesterol and the risk of coronary artery disease in patients with type 2 diabetes. Angiology. 2023;74:745–753. doi:10.1177/00033197221121008
28. Song Y, Zhao Y, Bai X, et al. Remnant cholesterol is independently associated with an increased risk of peripheral artery disease in type 2 diabetic patients. Front Endocrinol. 2023;14:1111152. doi:10.3389/fendo.2023.1111152
29. Wang J, Jin R, Wu Z, Zhang H. Separate and joint associations of remnant cholesterol accumulation and variability with carotid atherosclerosis: a prospective cohort study. JAHA. 2023;e029352. doi:10.1161/JAHA.122.029352
30. Rumora AE, Lentz SI, Hinder LM, et al. Dyslipidemia impairs mitochondrial trafficking and function in sensory neurons. FASEB J. 2018;32:195–207. doi:10.1096/fj.201700206R
31. Cai Z, Yang Y, Zhang J. A systematic review and meta-analysis of the serum lipid profile in prediction of diabetic neuropathy. Sci Rep. 2021;11:499. doi:10.1038/s41598-020-79276-0
32. Callaghan BC, Little AA, Feldman EL, Hughes RAC. Enhanced glucose control for preventing and treating diabetic neuropathy. Cochrane Database Syst Rev. 2012;6:CD007543. doi:10.1002/14651858.CD007543.pub2
33. Savelieff MG, Callaghan BC, Feldman EL. The emerging role of dyslipidemia in diabetic microvascular complications current opinion in endocrinology. Diabetes Obes. 2020;27:115–123. doi:10.1097/MED.0000000000000533
34. Andersen ST, Witte DR, Dalsgaard E-M, Andersen H, Nawroth P. Risk factors for incident diabetic polyneuropathy in a cohort with screen-detected type 2 diabetes followed for 13 years: ADDITION-Denmark. Diabetes Care. 2018;41:1068–1075. doi:10.2337/dc17-2062
35. Yu D, Wang Z, Zhang X, et al. Remnant cholesterol and cardiovascular mortality in patients with type 2 diabetes and incident diabetic nephropathy. J Clin Endocrinol Metab. 2021;106:3546–3554. doi:10.1210/clinem/dgab533
36. Hukportie DN, Li F-R, Zhou R, et al. Lipid variability and risk of microvascular complications in Action to Control Cardiovascular Risk in Diabetes (ACCORD) trial: a post hoc analysis. J Diabetes. 2022;14:365–376. doi:10.1111/1753-0407.13273
37. Bundó M, Vlacho B, Llussà J, et al. Prevalence and risk factors of diabetic foot disease among the people with type 2 diabetes using real-world practice data from Catalonia during 2018. Front Endocrinol. 2022;13:1024904. doi:10.3389/fendo.2022.1024904
38. Wang J, Xue T, Li H, Guo S. Nomogram prediction for the risk of diabetic foot in patients with type 2 diabetes mellitus. Front Endocrinol. 2022;13:890057. doi:10.3389/fendo.2022.890057
39. Chen D, Wang M, Shang X, Liu X, Ge T, Ren Q. Development and validation of an incidence risk prediction model for early foot ulcer in diabetes based on a high evidence systematic review and meta-analysis. Diabetes Res Clin Pract. 2021;180:109040. doi:10.1016/j.diabres.2021.109040
 © 2024 The Author(s). This work is published and licensed by Dove Medical Press Limited. The
full terms of this license are available at https://www.dovepress.com/terms.php
and incorporate the Creative Commons Attribution
- Non Commercial (unported, 3.0) License.
By accessing the work you hereby accept the Terms. Non-commercial uses of the work are permitted
without any further permission from Dove Medical Press Limited, provided the work is properly
attributed. For permission for commercial use of this work, please see paragraphs 4.2 and 5 of our Terms.
© 2024 The Author(s). This work is published and licensed by Dove Medical Press Limited. The
full terms of this license are available at https://www.dovepress.com/terms.php
and incorporate the Creative Commons Attribution
- Non Commercial (unported, 3.0) License.
By accessing the work you hereby accept the Terms. Non-commercial uses of the work are permitted
without any further permission from Dove Medical Press Limited, provided the work is properly
attributed. For permission for commercial use of this work, please see paragraphs 4.2 and 5 of our Terms.