")
Back to Journals » Patient Preference and Adherence » Volume 19
Treatment Patterns and Healthcare Resource Utilization by Gender and Migraine Frequency in Adult Patients Receiving Galcanezumab Versus Standard of Care Preventive Medications Over 24 months: A United States Retrospective Claims Study
Authors Varnado OJ, Vu M, Buysman EK, Kim G, Allenback G , Hoyt M, Trenz H, Cao F, Viktrup L
Received 10 October 2024
Accepted for publication 12 February 2025
Published 1 March 2025 Volume 2025:19 Pages 543—567
DOI https://doi.org/10.2147/PPA.S492300
Checked for plagiarism Yes
Review by Single anonymous peer review
Peer reviewer comments 2
Editor who approved publication: Professor Qizhi (Cathy) Yao
Oralee J Varnado,1 Michelle Vu,2 Erin K Buysman,2 Gilwan Kim,1 Gayle Allenback,2 Margaret Hoyt,1 Helen Trenz,2 Feng Cao,2 Lars Viktrup1
1Eli Lilly and Company, Indianapolis, IN, USA; 2Optum Life Sciences, HEOR, Eden Prairie, MN, USA
Correspondence: Oralee J Varnado, Value, Evidence, and Outcomes, Eli Lilly and Company, Lilly Corporate Center, 893 Delaware Street, Indianapolis, IN, 46285, USA, Tel +1 317-277-0599, Email [email protected]
Objective: To describe 24-month treatment patterns, healthcare resource utilization (HCRU), and direct costs of patients initiating galcanezumab (GMB) versus standard of care migraine preventive medications (SOC), stratified by gender and migraine type.
Methods: This retrospective cohort study used Optum’s® de-identified Market Clarity database (September 2018−March 2020) and included adults with migraine with ≥ 1 claim for GMB or SOC. Patients in the GMB cohort were stratified by gender (female/male) and migraine type (CM/EM), and propensity score matched 1:1 to patients in the SOC cohort. Treatment patterns, all-cause and migraine-related HCRU, and direct costs for GMB versus SOC cohorts were compared using a Z-test and reported over 24 months.
Results: Following stratification and matching, the GMB and SOC cohorts included the following patient pairs: 2015-female, 292-male, 1024-CM, and 1282-EM. Treatment adherence, measured by proportion of days covered, and median time to treatment discontinuation were significantly greater in those initiating GMB compared with SOC in females, males, patients with CM, and patients with EM (all p < 0.001). Over 24 months, reduction in migraine-related ambulatory visits, office visits, and medical costs were significantly higher in GMB versus SOC cohorts in females and patients with CM. Increases in HCRU associated with preventive migraine medication counts and migraine-related total and pharmacy costs were significantly higher in GMB versus SOC cohorts in all subgroups.
Conclusion: While direct costs over 24 months were higher in patients initiating GMB for migraine prevention, better adherence and longer treatment duration with GMB regardless of gender or migraine type support the use of GMB compared with SOC.
Plain Language Summary: What was known before?The risk of migraine is about two to three times higher for women than for men.Migraine is broadly classified into episodic migraine (EM, 14 or fewer migraine headache days per month) and chronic migraine (CM, at least 15 migraine headache days per month for at least 3 months) based on frequency of monthly migraine headache days. Individuals with CM appear to have higher rates of comorbid conditions than those with EM.Traditional standard of care migraine preventive medications (SOC) were not specifically developed for migraine treatment, and more than half of patients stop using oral medications prematurely.Calcitonin gene-related peptide monoclonal antibodies such as galcanezumab (GMB), fremanezumab, erenumab, and eptinezumab provide migraine-specific preventive treatment.Previous studies with 6-, 12-, and 24-month follow-ups have described the treatment patterns and healthcare resource utilization (HCRU) after initiation of GMB versus SOC.
What does this study add?In this 24-month study, we divided a population of patients starting GMB or SOC for migraine prevention 1) based on their gender (female or male) and 2) based on the type of migraine they reported (CM or EM), and compared treatment patterns, HCRU, and direct costs.Irrespective of gender and migraine type, patients who started GMB used their medicine as prescribed for a longer period of time than those who started SOC.Irrespective of gender and migraine type, following initiation of GMB, all-cause and migraine-related total costs increased, with the increase primarily driven by increased pharmacy costs.
InterpretationPatients with migraine initiating GMB as their preventive treatment are more likely to continue using it for a longer duration compared with those initiating SOC, based on better adherence and persistence rates. While total costs were higher in patients initiating GMB compared with those initiating SOC, some reductions were observed in HCRU.Treatment patterns, HCRU, and direct costs were generally consistent between females and males as well as those with CM and EM.
Keywords: CGRP mAbs, treatment patterns, direct costs, healthcare resource utilization, migraine prevention
Introduction
Migraine is a neurological disorder that is associated with moderate-to-severe headaches which are often accompanied by nausea, vomiting, photophobia, and phonophobia.1,2 Migraine is broadly classified into episodic migraine (EM) and chronic migraine (CM) based on the frequency of headaches; EM is characterized by ≤14 migraine headache days/month, while CM is characterized by ≥15 migraine headache days/month for ≥3 months with the features of migraine on ≥8 days/month.1 A study reported that most individuals in the United States with migraine had EM (93.3%) as opposed to CM (7.7%).3 In general, more individuals with CM have comorbid conditions compared with those with EM.4–6
The risk of migraine in some studies is about 3.25 times higher for females than males.7 In 2018, the age-adjusted prevalence of migraine and severe headaches across the adult population in the United States was 15.9%. In addition, the prevalence rates were higher for women (21.0%) than men (10.7%).8 The healthcare resource and cost burden associated with migraine is high, with migraine-related headaches accounting for approximately 3% of emergency department visits and higher annual direct healthcare costs compared with the general population ($22,364 vs $15,697 in 2019 US$).8,9 In addition, headache-related direct and indirect costs are significantly greater among individuals with CM than with EM in the United States.10,11 In 2015, the mean (standard deviation) total annual cost of headaches among people with CM ($8243 [$10,646]) was over three times that of EM ($2649 [$4634]; p <0.001).10
Current medications for migraine are categorized into acute medications (for symptomatic relief) and preventive medications (to reduce attack frequency, severity, duration, and disability).12 However, most of the standard of care preventive medications (SOC) recommended by the American Academy of Neurology (AAN), including antiepileptics, beta-blockers, antidepressants, angiotensin-converting enzyme inhibitors, angiotensin receptor blockers, and α-agonists, are not specifically developed for migraine prevention.13 Our understanding of migraine and the unique pharmacological property of calcitonin gene-related peptide (CGRP) and its receptors in the trigeminovascular system located outside the brain-blood barrier has evolved over the last several decades.2,14 An abundance of preclinical and clinical data has supported targeting CGRP or its receptors with antibodies or small molecules, resulting in a paradigm shift away from older treatment modalities.15,16
In 2018, the United States Food and Drug Administration approved the first CGRP monoclonal antibodies (mAbs), including galcanezumab (GMB).17 These mAbs have shown promising results,16,18 and with the recently approved gepants, CGRP-targeting therapies are recommended as first-line migraine prevention therapies by The American Headache Society (AHS).15 Initiation of CGRP-targeting therapies should not require trial and failure of nonspecific migraine preventive medication.15
With the introduction of these novel therapeutics, it is important to understand the real-world treatment pattern of prophylactic therapies used for migraine over time in clinical settings. CM is associated with a greater impact on quality of life4–6 and is difficult to treat compared with EM.19–21 Previous studies with 6-, 12-, and 24-month follow-ups have described the treatment patterns22–24 and healthcare resource utilization (HCRU)25 after initiation of GMB versus SOC. In our previous study in adults with migraine, patients receiving GMB had lower all-cause and migraine-related office visits over a 24-month follow-up period than patients receiving SOC, while total all-cause and migraine-related costs were also higher for patients receiving GMB.26
Very little health outcomes data are available on treatment patterns and HCRU/cost with a focus on gender and migraine frequency. As migraine is predominantly prevalent in females, important information could have been hidden in the much smaller male subpopulation with migraine.27 Similarly, there is an imbalance in the prevalence of EM and CM in the US (~9:1).3 The different acute and preventive medications used for EM versus CM impact not only treatment patterns but also HCRU and cost.2,28,29 We hypothesized that treatment patterns, HCRU, and cost in people treated with GMB or SOC could be different across genders and migraine types and dissimilar to those in the general migraine population. In the current study, we aimed to describe long-term (24-month) treatment patterns, HCRU, and costs by gender and migraine type in adults with migraine initiating GMB versus SOC using administrative claims data.
Materials and Methods
Study Design and Patient Population
This retrospective, observational cohort study used de-identified data from the Optum® Market Clarity database (September 1, 2017−March 31, 2022) in adult patients with migraine who were treated with GMB or SOC in the United States.30 The Optum de-identified Market Clarity dataset deterministically links medical and pharmacy claims with electronic health record data from providers across the continuum of care. Details of study design, patient selection, and medications included in SOC have been previously published.24 As this is an observational study that uses data previously collected and does not impose any form of intervention, the data have been de-identified to protect participant privacy. Therefore, a formal Consent to Release Information form was not required. This study was conducted in accordance with the ethical principles that have their origin in the Declaration of Helsinki and that are consistent with Good Pharmacoepidemiology Practices (GPPs) and applicable laws and regulations of the United States.
The date of a first claim for GMB or SOC during the identification period was set as the index date, and the medication on the index date was identified as the index drug. The study included adults (aged ≥18 years) diagnosed with migraine (ICD-10-CM diagnosis code for migraine in any position on the claim) and initiating either GMB or SOC from September 2018 to March 2020 (identification period). Detailed inclusion and exclusion criteria have been previously described in detail elsewhere.24 For patients identified with an index date for a SOC who had overlapping days’ supply with a subsequent claim for GMB, the first date of the GMB claim was set as the index date.
The study comprised two cohorts: GMB and SOC. The GMB cohort included all patients with GMB as the index drug, whereas the SOC cohort included all patients initiating drugs with established efficacy or probable efficacy in migraine prevention (as described in the AHS consensus statement 2021), as well as other preventive migraine medications, as the index drug (Supplementary Table 1). The patients in the GMB cohort were further stratified by gender (female or male) and migraine type (CM or EM), and then propensity score matched in a 1:1 ratio to patients in the SOC cohort (Figure 1). Results are presented under each of the four subgroups (female, male, patients with CM, and patients with EM) for the GMB versus SOC cohorts.
 |
Figure 1 Patient selection flow chart. Conventional preventive treatments for migraine in the SOC cohort included level A drugs (antiepileptic drugs [divalproex sodium, sodium valproate, or topiramate], beta-blockers [metoprolol, propranolol, or timolol]), level B drugs (tricyclic antidepressants [amitriptyline or venlafaxine], beta-blockers [atenolol or nadolol]), and other nonspecific drug (onabotulinumtoxinA). Abbreviations: CM, chronic migraine; EM, episodic migraine; GMB, galcanezumab; N, number of patients remaining at each step; SOC, standard of care preventive migraine medications. |
Outcome Measures
Baseline Demographics and Clinical Characteristics
All baseline demographics and clinical characteristics previously reported in Varnado et al were also reported in the current study for the respective cohorts.24 The preventive and acute migraine medications analyzed during baseline and follow-up were based on the AAN guidelines, 2012, and the AHS consensus statement, 2021.13,28 Medication overuse was estimated by computing the total days’ supply for each of the acute medication classes over the baseline and follow-up periods.31,32
Treatment Patterns
Treatment pattern measures included treatment adherence as measured by the proportion of days covered (PDC), persistence, discontinuation, restart of index drug after discontinuation, and switching to a non-index drug after discontinuation.24 Detailed descriptions of outcome measures are provided in Supplementary Table 2.
HCRU and Direct Costs
In this study, all-cause and migraine-related HCRU, and direct healthcare costs were assessed. Utilization and costs were defined as migraine-related if a medical claim had an International Classification of Diseases, 10th Revision, Clinical Modification (ICD-10-CM) code for migraine in any position or a pharmacy claim was for a migraine treatment (preventive CGRP, SOC, or acute treatment). All-cause and migraine-related HCRU included ambulatory visits (physician office and outpatient visits), emergency room visits, inpatient admissions, and other medical visits. In addition, migraine-related HCRU and direct costs included acute and preventive migraine medication counts/fills and costs, respectively (Supplementary Table 2).26 All measures were annualized to per patient per year (PPPY) measures.
Statistical Analysis
Propensity Score Matching
As this was an observational study, propensity score matching was utilized to address selection bias and confounders. Unconditional logistic regression was used to estimate the scores. “Receiving GMB” was the dependent variable and the independent variables are listed in detail elsewhere.24,33,34 Patients were matched (1:1) with a caliper of ±0.01.35 Cohorts were considered balanced on covariates with a standardized difference of ≤10% in absolute value. Patients were hard matched on gender and migraine type (CM or EM). Female or male patients with migraine receiving GMB were compared with those receiving SOC. Similarly, patients with EM or CM receiving GMB were compared with those with EM or CM receiving SOC.
Significance Level, Hypotheses Testing, and Multiplicity Adjustment
Descriptive analyses were performed before and after matching using frequency (number of patients with percentage, n [%]) and mean with standard deviation). Following matching, continuous and categorical variables were statistically compared using a Z-test with robust standard errors in an ordinary least-squares regression and Rao-Scott test, respectively. All analyses were planned, and significance level was set at two-sided α of 0.05 a priori. No multiplicity adjustments were performed. All costs were adjusted to 2022 US$ levels using the Medical Care Component of the Consumer Price Index. Analyses were conducted using SAS Software, Version 9.4 (SAS Institute Inc).
Results
Baseline characteristics, treatment patterns, HCRU, and direct costs of the overall population have been previously described in detail.24 Across all patients (2307 patient pairs), compared with patients who used SOC, those who used GMB showed greater treatment adherence and persistence during the 24-month follow-up.24 Patients receiving GMB had lower annualized counts of all-cause and migraine-related office visits and associated costs, and higher total all-cause and migraine-related costs compared with those receiving SOC.
Patient Sample and Baseline characteristics—stratified by Gender
The GMB cohort included 2058 female and 305 male patients, while the SOC cohort included 50,449 female and 11,127 male patients before matching. Following stratified propensity score matching, 2015 female patient pairs and 292 male patient pairs were identified in the GMB and SOC cohorts (Figure 1). Most baseline characteristics of female and male patients were numerically similar to the overall population and balanced between the GMB and SOC cohorts (Table 1).
 |
Table 1 Baseline Patient Demographics After Matching the GMB and SOC Cohorts Stratified by Gender |
Similar proportions of patients in the GMB and SOC cohorts used any preventive or acute migraine medications in the female and male subgroups in the baseline period (Figure 2 and 3). During the follow-up, significantly more female patients in the GMB cohort used fremanezumab (5.9% vs 3.7%, p =0.001) and significantly fewer used tricyclic antidepressants (11.3% vs 34.3%, p <0.001), anticonvulsants (15.0% vs 44.3%, p <0.001), beta-blockers (13.5% vs 34.6%, p <0.001), or onabotulinumtoxinA (12.4% vs 25.3%, p <0.001), compared with the SOC cohort (Figure 2). A significantly greater proportion of female patients in the GMB cohort used oral CGRP antagonists (gepants) (20.6% vs 10.8%, p <0.001) and serotonin 5-HTF receptor agonists (1.4% vs 0.7%, p =0.016) as acute treatments compared with the SOC cohort. In the male subgroup, a significantly smaller number of patients in the GMB cohort used tricyclic antidepressants (11.6% vs 33.2%, p <0.001), anticonvulsants (12.7% vs 42.8%, p <0.001), beta-blockers (12.7% vs 37.7%, p <0.001), or onabotulinumtoxinA (7.9% vs 18.2%, p <0.001), as well as nonsteroidal anti-inflammatory drugs (34.3% vs 46.2%, p =0.003) as an acute treatment compared with the SOC cohort (Figure 3). A significantly higher proportion of male patients in the GMB cohort used gepants (16.1% vs 4.1%, p <0.001) as an acute treatment compared with SOC.
 |
Figure 2 Medications used during the 12-month (baseline) and 24-month (follow-up) periods in the matched GMB and SOC cohorts within the female subgroup. Temporal comparisons were not conducted. Any result that included less than 12 patients was not reported due to re-identification risk. Proportions of patients were compared using the Rao-Scott test for categorical variables. *p < 0.05 between GMB and SOC. Abbreviations: CGRP, calcitonin gene-related peptide; DHE, dihydroergotamine; GMB, galcanezumab; mAb, monoclonal antibody; SOC, standard of care preventive migraine medications. |
 |
Figure 3 Medications used during the 12-month (baseline) and 24-month (follow-up) periods in the matched GMB and SOC cohorts within the male subgroup.Temporal comparisons were not conducted. Any result that included less than 12 patients was not reported due to re-identification risk. Proportions of patients were compared using the Rao-Scott test for categorical variables. *p < 0.05 between GMB and SOC. Abbreviations: CGRP, calcitonin gene-related peptide; DHE, dihydroergotamine; GMB, galcanezumab; mAb, monoclonal antibody; SOC, standard of care preventive migraine medications. |
Treatment Patterns in Patients Receiving GMB Versus Those Receiving SOC—stratified by Gender
Index Drug Refill
During the follow-up, female patients in the GMB cohort had twice the number of prescription fills for their index drug as in the SOC cohort (mean number of fills: 12.0 vs 6.8; p <0.001; Table 2). Similar to females, male patients in the GMB cohort had twice the number of prescription fills for their index drug than in the SOC cohort (11.7 vs 5.7; p <0.001) (Table 2).
 |
Table 2 Treatment Patterns During 24-month Follow-up in Patients With Migraine Prescribed an Index Treatment of GMB or SOC Stratified by Gender |
Treatment Adherence
Significantly greater treatment adherence was observed among female patients who initiated GMB than those who initiated SOC medications as measured by PDC (mean: 48% vs 39%; p <0.001, Table 2). Female patients in the GMB cohort were considered significantly more treatment adherent than those in the SOC cohort as measured by PDC ≥80% (26.9% vs 21.3%; p <0.001).
During the follow-up, male patients who initiated GMB showed significantly greater treatment adherence than those who initiated SOC (mean PDC: 46% vs 32%; p <0.001, Table 2). Significantly more male patients in the GMB cohort were considered treatment adherent, as measured by PDC ≥80% than those in the SOC cohort (24.7% vs 16.4%; p =0.016).
Persistence and Discontinuation of Index Treatment
Persistence and discontinuation results excluded the patients who were censored at the end of the 24-month period from the respective cohorts: n=68 (GMB) and n=56 (SOC). A significantly greater number of days with persistent use of the index treatment (allowing for <60-day gaps) was observed in female patients in the GMB cohort than in the SOC cohort (mean: 324.4 vs 241.3 days; p <0.001). Significantly fewer female patients in the GMB cohort discontinued treatment during follow-up compared with those in the SOC cohort (79.8% vs 84.1%; p <0.001). Likewise, female patients in the GMB cohort who discontinued had a longer mean treatment duration before discontinuation than patients in the SOC cohort (mean: 221.8 vs 149.1 days; p <0.001) (Table 2). Kaplan-Meier analysis showed that a significantly lower proportion (censoring-adjusted) of female patients who initiated GMB discontinued the index treatment at 24 months compared with those who initiated SOC (77.3% vs 81.8%; p <0.001) and had a longer median time to discontinuation (Figure 4).
Similar persistence and discontinuation were observed in the male subgroup, where six and seven censored male patients were excluded from the GMB and SOC cohorts, respectively. Days of persistent use were 306.3 and 202.9 days, p <0.001, in the GMB and SOC cohorts, respectively (Table 2). Kaplan-Meier analysis showed that a significantly lower percentage (censoring-adjusted) of male patients who initiated GMB discontinued their index treatment during follow-up compared with those who initiated SOC (80.6% vs 86.3%; p <0.001) (Figure 5).
Restart of Index Drug and Switch to Non-Index Drug After Discontinuation
Significantly fewer female patients in the GMB cohort who discontinued their index treatment during the follow-up period (GMB: n=1554; SOC: n=1648) restarted the index drug compared with those in the SOC cohort (27.5% vs 33.6%; p <0.001) (Table 2). Among female patients who restarted, those in the GMB cohort had a significantly shorter mean time from discontinuation to the first restart of their index drug (160.6 vs 201.8 days; p <0.001). A similar number of female patients switched to a non-index preventive treatment. Among female patients who switched, the GMB cohort had a longer mean time from the index date to their first switch (356.0 vs 323.1 days; p =0.002) versus the SOC cohort. Among those who switched, a significantly greater proportion of patients who initiated GMB versus SOC switched to fremanezumab (11.8% vs 5.2%; p <0.001). Non-index medications switched to are presented in Figure 6.
Contrary to female patients, among male patients who discontinued their index treatment during the follow-up period (GMB: n=235; SOC: n=252), significantly more patients in the GMB cohort restarted the index drug compared with those in the SOC cohort (31.1% vs 22.6%; p =0.032) (Table 2). Mean time from discontinuation to the first restart of their index drug was similar among male patients in the two cohorts. Among male patients who switched (GMB: n=79; SOC: n=80) the GMB cohort had a longer mean time from the index date to their first switch (355.0 vs 274.1 days; p =0.014) versus the SOC cohort (Table 2).
HCRU and Direct Costs in Patients Receiving GMB Versus Those Receiving SOC—stratified by Gender
All-Cause HCRU and Costs
No significant differences were observed between the cohorts from baseline to follow-up in mean change in all-cause HCRU (Figure 7).
For female patients, the mean change in PPPY total all-cause costs from baseline to follow-up was significantly higher in the GMB cohort than in the SOC cohort ($5641 vs $2249; p =0.003) (Figure 8), which was primarily due to a greater change in pharmacy costs ($5317 vs $514; p <0.001). Costs related to office visits were lower in the GMB versus SOC cohort ($52 vs $669; p =0.002). Similarly, in the male subgroup, the greater mean change from baseline in PPPY total all-cause costs ($5512 vs $286; p =0.007) in the GMB cohort compared with the SOC cohort was primarily due to a greater change in pharmacy costs ($4819 vs $1157; p <0.001).
Migraine-Related HCRU and Costs
Female patients in the GMB cohort showed significantly greater change from baseline to the follow-up in PPPY migraine-related ambulatory visits (−0.5 vs −0.1; p =0.004), office visits (−0.5 vs −0.1; p =0.004), and preventive migraine medication count (7.4 vs 4.8; p <0.001) compared with the SOC cohort (Figure 9).
Mean change in PPPY migraine-related total costs from baseline to follow-up was significantly higher in the GMB cohort than in the SOC cohort for females ($4815 vs $1589; p <0.001), likely due to a greater change in pharmacy costs ($48,694 vs $789; p <0.001), which included preventive and acute migraine medication costs (Figure 10). However, the increase in PPPY medical costs was significantly higher in the SOC cohort compared with the GMB cohort (p =0.039).
The GMB cohort showed significantly greater changes from baseline to the follow-up in preventive migraine medication count (7.1 vs 4.1; p <0.001) and in total costs ($4491 vs $758; p <0.001) in the male subgroup compared with the SOC cohort (Figure 9 and 10). Change in pharmacy costs for the GMB and SOC cohorts were $4359 and $675, p <0.001, respectively.
Patient Sample and Baseline characteristics—stratified by Migraine Type
After stratified propensity score matching, 1024 patient pairs with CM and 1282 patient pairs with EM were identified in the GMB and SOC cohorts (Figure 1). After matching, GMB and SOC cohorts were generally well balanced in both the CM and EM subgroups (Table 3).
 |
Table 3 Baseline Patient Demographics After Matching the GMB and SOC Cohorts Stratified by Migraine Type |
During the baseline period, significantly more patients used anticonvulsants and beta-blockers compared with the SOC cohort in the CM subgroup (Figure 11). During follow-up, significantly more patients with CM in the GMB cohort used fremanezumab (7.5% vs 5.2%, p =0.013) compared with the SOC cohort, and significantly less patients used tricyclic antidepressants (12.0% vs 30.6%, p <0.001), anticonvulsants (14.2% vs 39.0%, p <0.001), beta-blockers (14.7% vs 30.8%, p <0.001), onabotulinumtoxinA (17.2% vs 44.5%, p <0.001), or erenumab (11.0% vs 14.0, p = 0.044) (Figure 11). A significantly greater proportion of CM patients in the GMB cohort used gepants (23.8% vs 13.9%, p <0.001) as an acute treatment compared with the SOC cohort. During baseline, no significant differences were observed between GMB and SOC cohorts in the EM subgroup (Figure 12). During follow-up, in the EM subgroup, significantly more patients in the GMB cohort used fremanezumab (4.1% vs 2.6%, p = 0.037) compared with the SOC cohort, and significantly less patients used tricyclic antidepressants (10.8% vs 37.0%, p <0.001), anticonvulsants (15.1% vs 48.2%, p <0.001), and beta-blockers (12.3% vs 38.5%, p <0.001) (Figure 12). During follow-up, acute medication use in the EM subgroup was similar to that of the CM subgroup.
 |
Figure 4 Proportion of patients that discontinued the index drug during the 24-month follow-up period within the female subgroup. The Wald chi-squared test using robust standard errors in a proportional hazard model was used for assessing the equality of hazard rates. Abbreviations: GMB, galcanezumab; SOC, standard of care preventive migraine medications. |
 |
Figure 5 Proportion of patients that discontinued the index drug during the 24-month follow-up period within the male subgroup. The Wald chi-squared test using robust standard errors in a proportional hazard model was used for assessing the equality of hazard rates. Abbreviations: GMB, galcanezumab; SOC, standard of care preventive migraine medications. |
 |
Figure 6 Switch to non-index preventive migraine drug class among patients who switched treatment in the GMB versus SOC cohorts during the 24-month follow-up period within the subgroup of (a) females, (b) males, (c) patients with CM, and (d) patients with EM. Treatment switch could have occurred within the calcitonin gene-related peptide class or between different SOC drug classes. Proportions of patients were compared using the Rao-Scott test for categorical variables. Any result that included less than 12 patients was not reported due to re-identification risk. *p < 0.05 between GMB and SOC. Abbreviations: CM, chronic migraine; EM, episodic migraine; GMB, galcanezumab; N, number of patients who switched to a non-index drug; SOC, standard of care preventive migraine medications. |
 |
Figure 7 Change in all-cause (non-inpatient) PPPY HCRU for the GMB versus SOC cohorts, from baseline to follow-up.Office visits is a subcategory of ambulatory visits.*p < 0.05 between GMB and SOC. Abbreviations: CM, chronic migraine; EM, episodic migraine; ER, emergency room; GMB, galcanezumab; HCRU, healthcare resource utilization; PPPY, per patient per year; SOC, standard of care preventive migraine medications. |
Treatment Patterns in Patients Receiving GMB Versus Those Receiving SOC—stratified by Migraine Type
Index Drug Refill
Patients in the GMB cohort had twice the number of prescription fills for their index drug as the SOC cohort in both CM (mean number of fills: 11.9 vs 6.2; p <0.001) and EM (11.9 vs 6.9; p <0.001) subgroups (Table 4).
 |
Table 4 Treatment Patterns During 24-month Follow-up in Patients With Migraine Prescribed an Index Treatment of GMB or SOC Stratified by Migraine Type |
Treatment Adherence
Using PDC, the study found a significantly higher rate of adherence in patients who initiated GMB than those who initiated SOC in the CM subgroup (mean: 48% vs 40%; p <0.001) (Table 4). Similar trends were observed in the EM subgroup. As measured by PDC ≥80%, a significantly greater proportion of patients with EM in the GMB cohort were considered treatment adherent than in the SOC cohort (27.5% vs 19.2%; p <0.001) (Table 4).
Persistence and Discontinuation of Index Treatment
Persistence and discontinuation results excluded the censored 31 patients with CM from the GMB cohort and 27 patients with CM from the SOC cohort at the end of the follow-up period (Table 4). Patients in the GMB cohort who discontinued had a longer mean treatment duration before discontinuation than patients in the SOC cohort (all p <0.001) (Table 4). Kaplan-Meier analysis showed that a significantly lower percentage of patients with CM who initiated GMB discontinued their index treatment during follow-up versus those who initiated SOC and patients initiating GMB had a longer median time to discontinuation (both p <0.001) (Figure 13).
 |
Figure 8 Change in all-cause (non-inpatient) PPPY direct costs for the GMB versus SOC cohorts, from baseline to follow-up.Total costs include medical and pharmacy costs. *p < 0.05 between GMB and SOC. Abbreviations: CM, chronic migraine; EM, episodic migraine; GMB, galcanezumab; HCRU, healthcare resource utilization; PPPY, per patient per year; SOC, standard of care preventive migraine medications. |
Persistence and discontinuation results in the EM subgroup excluded the censored 43 and 36 patients from the GMB and SOC cohorts, respectively. Days of persistent use were 321.7 and 224.5, p <0.001, in the GMB and SOC cohorts, respectively (Table 4). The censoring-adjusted percentage of patients with EM who discontinued their index treatment at 24 months was significantly lower in the GMB cohort compared with the SOC cohort (77.2% vs 83.1%; p <0.001) (Figure 14).
 |
Figure 9 Change in migraine-related PPPY HCRU for the GMB versus SOC cohorts, from baseline to 24-month follow-up. Office visits is a subcategory of ambulatory visits. *p < 0.05 between GMB and SOC. Abbreviations: CM, chronic migraine; EM, episodic migraine; ER, emergency room; GMB, galcanezumab; PPPY, per patient per year; SOC, standard of care preventive migraine medications. |
Restart of Index Drug and Switch to Non-Index Drug After Discontinuation
Similar proportions of patients with CM restarted their index drug or switched to a non-index preventive treatment in both cohorts (Table 4). Among patients with CM who switched (GMB: n=386; SOC: n=396), those in the GMB cohort had a longer mean time from the index date to their first switch (CM: 355.1 vs 312.3 days; p =0.002) versus the SOC cohort. Among those who switched, significantly more patients in the GMB cohort switched to fremanezumab compared with the SOC cohort (13.5% vs 6.6%; p =0.001) (Figure 6).
 |
Figure 10 Change in migraine-related PPPY direct costs for the GMB versus SOC cohorts, from baseline to 24-month follow-up: (a) change in migraine-related HCRU. Total costs include medical and pharmacy costs. *p < 0.05 between GMB and SOC. Abbreviations: CM, chronic migraine; EM, episodic migraine; GMB, galcanezumab; PPPY, per patient per year; SOC, standard of care preventive migraine medications. |
Among those who discontinued their index treatment during the follow-up period in the EM subgroup, significantly fewer patients in the GMB cohort restarted the index drug (p =0.033) and had a significantly shorter mean time from discontinuation to first restart (p <0.001) compared with the SOC cohort (Table 4). Patients with EM who switched in the GMB cohort had a longer mean time from the index date to their first switch (p =0.026) versus the SOC cohort. (Table 4). Among those who switched, significantly more patients in the GMB cohort switched to fremanezumab (9.1% vs 3.9%; p =0.006) and to onabotulinumtoxinA (13.6% vs 8.2%; p =0.019) compared with the SOC cohort (Figure 6).
HCRU and Direct Costs in Patients Receiving GMB Versus Those Receiving SOC—stratified by Migraine Type
All-Cause HCRU and Costs
No significant differences were observed between cohorts in mean change from baseline to follow-up in all-cause HCRU (Figure 7).
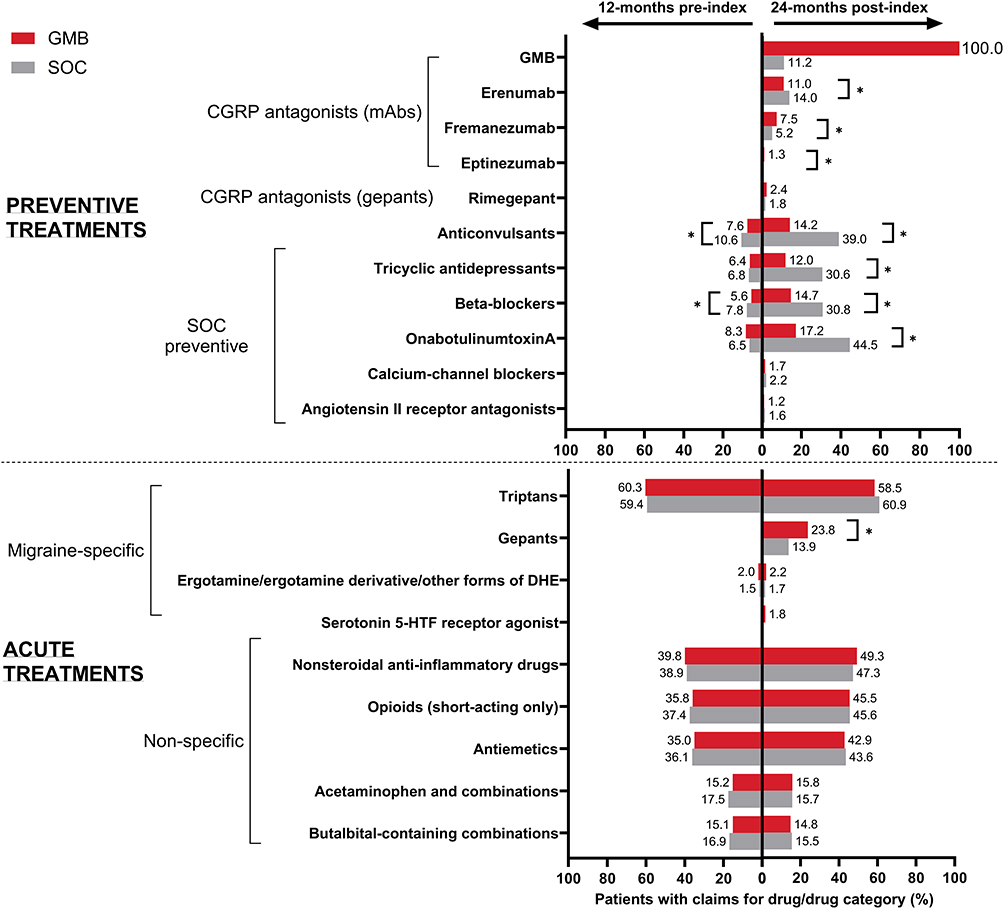 |
Figure 11 Medications used during the 12-month (baseline) and 24-month (follow-up) periods in the matched GMB and SOC cohorts within the CM subgroup.Temporal comparisons were not conducted. Any result that included less than 12 patients was not reported due to re-identification risk. Proportions of patients were compared using the Rao-Scott test for categorical variables. *p < 0.05 between GMB and SOC. Abbreviations: CGRP, calcitonin gene-related peptide; CM, chronic migraine; DHE, dihydroergotamine; GMB, galcanezumab; mAb, monoclonal antibody; SOC, standard of care preventive migraine medications. |
For patients with CM, the mean change in PPPY all-cause total costs from baseline to follow-up was significantly higher in the GMB cohort than in the SOC cohort ($5646 vs $1558; p =0.044) (Figure 8) which was primarily due to a greater change in pharmacy costs ($5273 vs -$138; p <0.001).
 |
Figure 12 Medications used during the 12-month (baseline) and 24-month (follow-up) periods in the matched GMB and SOC cohorts within the CM subgroup.Temporal comparisons were not conducted. Any result that included less than 12 patients was not reported due to re-identification risk. Proportions of patients were compared using the Rao-Scott test for categorical variables. *p < 0.05 between GMB and SOC. Abbreviations. CGRP, calcitonin gene-related peptide; DHE, dihydroergotamine; EM, episodic migraine; GMB, galcanezumab; mAb, monoclonal antibody; SOC, standard of care preventive migraine medications. |
For patients with EM, change from baseline to follow-up was similar across the cohorts in all-cause events except office visits (GMB: −1.49 vs SOC: −0.10; p =0.019 (Figure 7). Over the follow-up, in patients with EM, mean change in PPPY all-cause total costs was greater in the GMB cohort than in the SOC cohort ($5597 vs $2353; p <0.001), which was again primarily due to a large change in pharmacy costs ($5231 vs $1182; p <0.001) (Figure 8).
Migraine-Related HCRU and Costs
The GMB cohort showed significantly greater change from baseline to the follow-up in PPPY migraine-related ambulatory visits (−0.7 vs −0.1; p =0.003), office visits (−0.6 vs 0; p =0.003), and preventive migraine medication count (7.6 vs 4.8; p <0.001) in the CM subgroup (Figure 9). In the CM subgroup, the mean change in PPPY migraine-related total costs from baseline to follow-up was significantly higher in the GMB cohort than in the SOC cohort ($4532 vs $2479; p =0.003), due to a greater change in pharmacy costs ($4868 vs $916; p <0.001) (Figure 10). Over the follow-up, change in PPPY medical costs was statistically different between the GMB and SOC cohorts (-$336 vs $1564; p <0.001).
 |
Figure 13 Proportion of patients that discontinued the index drug during the 24-month follow-up period within the CM subgroup. The Wald chi-squared test using robust standard errors in a proportional hazard model was used for assessing the equality of hazard rates. Abbreviations: CM, chronic migraine; GMB, galcanezumab; SOC, standard of care preventive migraine medications. |
 |
Figure 14 Proportion of patients that discontinued the index drug during the 24-month follow-up period within the EM subgroup. The Wald chi-squared test using robust standard errors in a proportional hazard model was used for assessing the equality of hazard rates. Abbreviations: EM, episodic migraine; GMB, galcanezumab; SOC, standard of care preventive migraine medications. |
The GMB cohort showed significantly greater change from baseline to the follow-up in PPPY migraine-related preventive migraine medication count (7.2 vs 4.6; p <0.001) in the EM subgroup (Figure 9). Mean change in PPPY migraine-related total costs from baseline to follow-up was significantly higher in the GMB cohort than in the SOC cohort ($4965 vs $690; p <0.001), which was due to a greater change in pharmacy costs ($4477 vs $663; p <0.001).
Discussion
This study compared real-world treatment patterns and HCRU of migraine patients treated with GMB versus SOC over 24 months stratified by gender and migraine type. Our findings demonstrated that, irrespective of gender and migraine type, patients who initiated GMB in general were significantly more adherent and persistent to the index drug than those who initiated SOC. These findings in the respective subgroups, as well as other treatment patterns including discontinuation, restart of index medication, switching to a non-index preventive treatment, and the type of non-index medication switched to were consistent with those of the overall population.24 In general, irrespective of gender and migraine type, mean changes in PPPY total all-cause and migraine-related costs were significantly higher in the GMB cohort than in the SOC cohort, which was driven by increased pharmacy costs.
After propensity score matching, female and male subgroups and CM and EM subgroups in the GMB and SOC cohorts were well balanced. Minimal differences were observed in baseline medications taken by patients in the different subgroups. Consistent with results from previous studies,23,36–38 the most commonly initiated class of SOC in the current study was anticonvulsants followed by beta-blockers, and tricyclic antidepressants. While prescribing patterns can depend on individual factors such as the frequency and severity of migraines, the presence of other medical conditions, and the patient’s response to previous treatments,39 recommendations do not state gender itself as a sole determinant and results in this study are consistent with this. While some patients with EM can be managed with effective acute therapy and without preventive treatment, patients with CM invariably require preventive treatment.40,41 However, based on treatment patterns seen in our study, prescribing patterns seem generally similar in patients with CM or EM.
Significantly more female patients in the GMB cohort used fremanezumab as a preventive treatment compared with the SOC cohort and significantly less female and male patients used tricyclic antidepressants, anticonvulsants, beta-blockers, or onabotulinumtoxinA. This was not surprising as many patients in the SOC cohort were required to have used these medications to be in their cohort. In general, irrespective of the patients’ gender or type of migraine, treatment patterns observed in this study were consistent with results from the overall population24 as well as shorter term (6- and 12-month) follow-up studies.23 These observations establish greater treatment adherence and persistence with GMB with fewer discontinuations and switches than with SOC.
This study adds to the existing body of evidence on HCRU and direct costs data,25,26 in which the GMB cohort had a significantly lower mean number of PPPY all-cause and migraine-related office visits as well as lower costs associated with those visits. Studies showing gender and migraine type differences in HCRU among patients receiving GMB versus SOC are not available. It is worthwhile to document observations regarding the migraine-related HCRU and costs in the current study. When stratified by gender, female patients in the GMB cohort showed significantly greater change from baseline to the follow-up in PPPY migraine-related ambulatory visits and office visits compared with the SOC cohort, which was not observed in males. Previous studies have shown that female gender was associated with the initiation of preventive medication (odds ratio: 1.181; 95% confidence interval: 1.144, 1.218) and more females sought treatment at a headache center and professional medical care for managing migraine.42,43 When stratified by migraine type, for patients with EM, change from baseline to follow-up was similar across the cohorts in all-cause HCRU except office visits. In addition, the GMB cohort showed significantly greater change from baseline to the follow-up in PPPY migraine-related ambulatory visits and office visits relative to SOC, in the CM subgroup. These differences were not observed in the EM cohorts and were not surprising as previous studies have shown that CM is more difficult to treat and is associated with higher HCRU than EM.4–6,44,45
In the current study, mean change in PPPY total all-cause and migraine-related costs were significantly higher in the GMB cohort than in the SOC cohort. Interestingly, females in the GMB cohort had a significantly lower increase in migraine-related medical costs compared with SOC, whereas this was not observed in males. A previous study showed that a greater proportion of women seek professional medical care for managing migraine than men (65.7% vs 72.4%) (p =0.003; odds ratio: 0.71; 95% confidence interval: 0.57, 0.89).43 In addition, our study showed that the change from baseline to follow-up in PPPY migraine-related medical costs in patients with CM was significantly different between GMB and SOC cohorts; however, this was not observed in those with EM. CM is associated with significantly higher economic burden when compared with EM. Previous studies estimated that patients with CM had 2.1 to 4.8 times higher medical costs than patients with EM.10,11,46 Despite similar treatment patterns, a lower increase compared with SOC for migraine-related medical costs in patients with CM corroborates earlier studies showing CM as being more difficult to treat than EM.19–21
In the current study, in all four subgroups, the higher increase in pharmacy costs led to a higher increase in total all-cause and migraine-related costs in the GMB cohort. However, although GMB has a higher initial cost, its efficacy and reduced adverse effects may render it more economical over time, particularly for patients with chronic migraine who have not had adequate relief with SOC.47 Additionally, according to NICE guidance, GMB has been considered cost-effective in patients with inadequate response to ≥3 preventive treatments.48
These outcomes may help payers, providers, and patients consider the patients’ gender and migraine type to evaluate the value and place in therapy for novel migraine preventive therapies, ultimately improving outcomes and patient satisfaction. Improved adherence to migraine medications is important for effective migraine management and ultimately leads to better quality of life.39,49 Future studies may help characterize the association between changes in costs and treatment utilization patterns, as well as help in understanding differences observed in gender and migraine type subgroups. Surveys conducted among patients and providers can aid in addressing the burden associated with preventive treatment among migraine patients, benefiting not only patients and providers but also policymakers, payers, and other stakeholders. To improve treatment compliance and decrease the burden due to migraine preventive therapies, future studies and surveys exploring indirect costs and reasons for continuing, switching, and discontinuing migraine preventive treatments in hard-matched populations are needed. Increasing numbers of real-world evidence studies support the use of CGRP mAbs and the paradigm shift away from older migraine therapies.50 This involves initiating preventive treatment with CGRP mAbs in the early stages of the disease.29 The European multicenter study observed close to 6000 patients with high-frequency EM or CM for 6 months and reported more than 50% of patients being good responders and more than 25% of them being excellent responders. Gender did not affect the outcome.
Strengths and Limitations
This study is one among the few real-world long-term follow-up studies examining treatment patterns, as well as HCRU and costs with GMB. This study of stratified populations adds reliability to the existing data from 6-, 12-, and 24-month real-world follow-up studies comparing the treatment patterns and direct costs of GMB and SOC. Moreover, this study tackles the inherent selection or confounding bias present in observational studies by employing propensity score matching to achieve balance among the cohorts. Propensity score methods allow one to transparently design and analyze observational studies, and propensity score matching can yield unbiased estimations of treatment effect even in the case of small study samples by paying attention to the choice of variables to be included in the propensity score model.51 In the SOC cohort, the study encompassed index drugs with well-documented evidence of efficacy, thus guaranteeing meaningful comparisons. This approach avoids potential distortions in results that could arise from including drugs with inconsistent or inadequate efficacy. HCRU and direct cost outcomes should be interpreted considering propensity matching. In the absence of well-balanced cohorts with similar patient baseline characteristics, greater differences in economic outcomes between GMB and SOC initiators may be observed from baseline to follow-up. Stratification ensured that the important characteristics of the population affected by migraine were properly represented in the sample which, in turn, helped with the generalizability and validity of the study, and helped avoid under-representation bias.
The study has certain limitations. The sample sizes for males and patients with CM were small; hence, statistical significance must be interpreted carefully. The study sample predominantly represents those commercially enrolled in medical and pharmacy benefits; therefore, findings may not be generalizable to patients not covered under the above. The data source provided only limited clinical information regarding severity, and there was a possibility of misclassification of demographic and clinical data due to errors in data coding and/or entry. Since the study relied on claims databases, filled prescriptions might not accurately reflect actual patient medication intake; prescriptions that were issued but not filled were not accounted for. Additionally, the calculation of treatment adherence or estimates of patients experiencing medication overuse may have been complicated by the lack of data on over-the-counter medications. This study examined the treatment patterns of preventive and acute medications in accordance with the AHS consensus statement from 2021, however, the most recent AHS position statement from 2024 now recognizes CGRP mAbs as a primary approach for migraine prevention, alongside previous first-line treatments, without necessitating prior failure of other classes of migraine preventive treatment. Furthermore, outcomes related to monthly migraine days were out of scope, therefore are not reported in the current manuscript. Lastly, certain medications possess both on- and off-label indications, making it challenging to ascertain the precise indication for which they were prescribed. This ambiguity could potentially influence follow-up medication usage and switching outcomes.
Conclusion
Treatment patterns, including adherence and persistence rates, support the utilization of GMB in improving migraine care regardless of gender or migraine type. In general, while total costs associated with the use of GMB were higher over 24 months, there were some reductions in HCRU. Despite similar treatment patterns, females in the GMB cohort had a significantly lower increase compared with SOC in migraine-related medical costs which was not observed in males. In addition, the change in PPPY migraine-related medical costs from baseline to follow-up was significantly different between the GMB and SOC cohorts in patients with CM, however, this was not seen in the EM cohort.
Data Sharing Statement
The study findings were supported by the data provided by Optum. Access to these data is restricted, as they were used under license for this specific study and are not publicly available. For inquiries regarding data availability and licensing, requests may be directed to Optum.
Acknowledgments
The authors express their gratitude to Sarah Hague from Optum Life Sciences HEOR for project management support, Randall Gerdes from Optum Life Sciences HEOR for verifying programming, and Keerthana Muthiah and Amit Kumar Koushik from Eli Lilly Services India Private Limited for their support in medical writing.
Author Contributions
All authors made a significant contribution to the work reported, whether in the conception, design, and execution of the study, acquisition, analysis, and interpretation of data, or in all these areas; took part in drafting, revising, or critically reviewing the article; gave final approval of the version to be published; agreed on the journal to which the article has been submitted; and agreed to be accountable for all aspects of the work.
Funding
This work was supported by Eli Lilly and Company.
Disclosure
OJV, LV, MH, and GK are employees and hold minor stock interests in Eli Lilly and Company. MV, EB, and FC are affiliated with Optum Life Sciences (a business unit from UnitedHealth Group) as employees; Optum received funding to conduct the study. GA and HT were associated with Optum Life Sciences as employees at the time of the study. The authors report no other conflicts of interest in this work.
References
1. Scotton WJ, Botfield HF, Westgate CS, et.al. Headache classification committee of the International Headache Society (IHS) the international classification of headache disorders. Cephalalgia. 2018;38(1):1–211. doi:10.1177/0333102417738202
2. Raggi A, Leonardi M, Arruda M, et al. Hallmarks of primary headache: part 1 – migraine. J Headache Pain. 2024;25(1):189. doi:10.1186/s10194-024-01889-x
3. Buse DC, Manack AN, Fanning KM, et al. Chronic migraine prevalence, disability, and sociodemographic factors: results from the American Migraine Prevalence and Prevention Study. Headache. 2012;52(10):1456–1470. doi:10.1111/j.1526-4610.2012.02223.x
4. Buse DC, Manack A, Serrano D, Turkel C, Lipton RB. Sociodemographic and comorbidity profiles of chronic migraine and episodic migraine sufferers. J Neurol Neurosurg Psychiatry. 2010;81(4):428–432. doi:10.1136/jnnp.2009.192492
5. Buse DC, Silberstein SD, Manack AN, Papapetropoulos S, Lipton RB. Psychiatric comorbidities of episodic and chronic migraine. J Neurol. 2013;260(8):1960–1969. doi:10.1007/s00415-012-6725-x
6. Manack AN, Buse DC, Lipton RB. Chronic migraine: epidemiology and disease burden. Curr Pain Headache Rep. 2011;15(1):70–78. doi:10.1007/s11916-010-0157-z
7. Buse DC, Loder EW, Gorman JA, et al. Sex differences in the prevalence, symptoms, and associated features of migraine, probable migraine and other severe headache: results of the American Migraine Prevalence and Prevention (AMPP) study. Headache. 2013;53(8):1278–1299. doi:10.1111/head.12150
8. Burch R, Rizzoli P, Loder E. The prevalence and impact of migraine and severe headache in the United States: updated age, sex, and socioeconomic-specific estimates from government health surveys. Headache. 2021;61(1):60–68. doi:10.1111/head.14024
9. Yucel A, Thach A, Kumar S, Loden C, Bensink M, Goldfarb N. Estimating the economic burden of migraine on US employers. Am J Manag Care. 2020;26(12):e403–e408. doi:10.37765/ajmc.2020.88547
10. Messali A, Sanderson JC, Blumenfeld AM, et al. Direct and indirect costs of chronic and episodic migraine in the United States: a Web-Based Survey. Headache. 2016;56(2):306–322. doi:10.1111/head.12755
11. Stokes M, Becker WJ, Lipton RB, et al. Cost of health care among patients with chronic and episodic migraine in Canada and the USA: results from the International Burden of Migraine Study (IBMS). Headache. 2011;51(7):1058–1077. doi:10.1111/j.1526-4610.2011.01945.x
12. The American Headache Society Position Statement On Integrating New Migraine Treatments Into Clinical Practice. Headache. 2019;59(1):1–18. doi:10.1111/head.13456
13. Silberstein SD, Holland S, Freitag F, Dodick DW, Argoff C, Ashman E. Evidence-based guideline update: pharmacologic treatment for episodic migraine prevention in adults: report of the quality standards subcommittee of the American Academy of neurology and the American Headache Society. Neurology. 2012;78(17):1337–1345. doi:10.1212/WNL.0b013e3182535d20
14. Ashina M, Hansen JM, Do TP, Melo-Carrillo A, Burstein R, Moskowitz MA. Migraine and the trigeminovascular system-40 years and counting. Lancet Neurol. 2019;18(8):795–804. doi:10.1016/s1474-4422(19)30185-1
15. Charles AC, Digre KB, Goadsby PJ, Robbins MS, Hershey A, American Headache S. Calcitonin gene-related peptide-targeting therapies are a first-line option for the prevention of migraine: an American Headache Society position statement update. Headache. 2024;64:333–341. doi:10.1111/head.14692
16. Waliszewska-Prosół M, Raffaelli B, Straburzyński M, Martelletti P. Understanding the efficacy and tolerability of migraine treatment: a deep dive into CGRP antagonists. Expert Rev Clin Pharmacol. 2024;17(11):1039–1051. doi:10.1080/17512433.2024.2417655
17. Administration UFaD. Approval package for galcanezumab. Available from: https://www.accessdata.fda.gov/drugsatfda_docs/nda/2018/761063Orig1s000TOC.cfm.
18. Vandervorst F, Van Deun L, Van Dycke A, et al. CGRP monoclonal antibodies in migraine: an efficacy and tolerability comparison with standard prophylactic drugs. J Headache Pain. 2021;22(1):128. doi:10.1186/s10194-021-01335-2
19. Aurora SK, Brin MF. Chronic migraine: an update on physiology, imaging, and the mechanism of action of two available pharmacologic therapies. Headache. 2017;57(1):109–125. doi:10.1111/head.12999
20. Kish T. Emerging therapies for patients with difficult-to-treat migraine. P t. 2018;43(10):616–621. doi:10.15585/mmwr.mm6624a8
21. Young NP, Philpot LM, Vierkant RA, et al. Episodic and chronic migraine in primary care. Headache. 2019;59(7):1042–1051. doi:10.1111/head.13543
22. Mavridis T, Deligianni CI, Karagiorgis G, Daponte A, Breza M, Mitsikostas DD. Monoclonal antibodies targeting CGRP: from clinical studies to real-world evidence-what do we know so far? Pharmaceuticals. 2021;14(7):700. doi:10.3390/ph14070700
23. Varnado OJ, Manjelievskaia J, Ye W, Perry A, Schuh K, Wenzel R. Treatment patterns for calcitonin gene-related peptide monoclonal antibodies including galcanezumab versus conventional preventive treatments for migraine: a retrospective US claims study. Patient Prefer Adherence. 2022;16:821–839. doi:10.2147/ppa.S346660
24. Varnado OJ, Vu M, Buysman EK, et al. Treatment patterns of galcanezumab versus standard of care preventive migraine medications over 24 months: a US retrospective claims study. Curr Med Res Opin. 2024:1–12. doi:10.1080/03007995.2024.2316864
25. Varnado OJ, Manjelievskaia J, Ye W, Perry A, Schuh K, Wenzel R. Health care resource utilization and costs associated with treatment among patients initiating calcitonin gene-related peptide inhibitors vs other preventive migraine treatments in the United States. J Manag Care Spec Pharm. 2022;28(8):818–829. doi:10.18553/jmcp.2022.28.8.818
26. Armstrong AW, McConaha JL. Poster abstracts - academy of managed care pharmacy 2023. J Manag Care Spec Pharm. 2023;29(10–a Suppl):S1–S138. doi:10.18553/jmcp.2023.29.10-a.s1
27. Ornello R, Baraldi C, Guerzoni S, et al. Gender differences in 3-month outcomes of erenumab treatment—study on efficacy and safety of treatment with erenumab in men brief research report. Front Neurol. 2021;12. doi:10.3389/fneur.2021.774341
28. Ailani J, Burch RC, Robbins MS. The American Headache Society Consensus Statement: update on integrating new migraine treatments into clinical practice. Headache. 2021;61(7):1021–1039. doi:10.1111/head.14153
29. Caronna E, Gallardo VJ, Egeo G, et al. Redefining migraine prevention: early treatment with anti-CGRP monoclonal antibodies enhances response in the real world. J Neurol Neurosurg. 2024;95(10):927–937. doi:10.1136/jnnp-2023-333295
30. Optum. Market Clarity Data. (2007-2022). Available from: https://www.optum.com/business/life-sciences/real-world-data/market-clarity-data.html.
31. Bigal ME, Lipton RB. Excessive acute migraine medication use and migraine progression. Neurology. 2008;71(22):1821–1828. doi:10.1212/01.wnl.0000335946.53860.1d
32. Silberstein SD, Olesen J, Bousser MG, et al. The international classification of headache disorders, 2nd edition (ICHD-II)--revision of criteria for 8.2 medication-overuse headache. Cephalalgia. 2005;25(6):460–465. doi:10.1111/j.1468-2982.2005.00878.x
33. Measure overview and rationale: Migraine Preventive Therapy (MPT). Available from: https://www.pqaalliance.org/assets/docs/PQA_MPT_Rationale.pdf.
34. One new health plan performance measure and two new pharmacy measures recommended for endorsement. Available from: https://www.pqaalliance.org/assets/docs/PQA_Summary-KeyPoints_Endorse_MPT_SP-TAT_PDC-CMP-PH.pdf.
35. Austin PC. Optimal caliper widths for propensity-score matching when estimating differences in means and differences in proportions in observational studies. Pharm Stat. 2011;10(2):150–161. doi:10.1002/pst.433
36. Ferreira A, Marques SR, Lopes S, et al. Preventive oral treatment in migraine: efficacy and dropout rates observed at a tertiary headache center. SN Compreh Clin Med. 2022;5(1):38. doi:10.1007/s42399-022-01369-w
37. Blumenfeld AM, Bloudek LM, Becker WJ, et al. Patterns of use and reasons for discontinuation of prophylactic medications for episodic migraine and chronic migraine: results from the second international burden of migraine study (IBMS-II). Headache. 2013;53(4):644–655. doi:10.1111/head.12055
38. Parikh SK, Silberstein SD. Current status of antiepileptic drugs as preventive migraine therapy. Curr Treat Options Neurol. 2019;21(4):16. doi:10.1007/s11940-019-0558-1
39. Silberstein SD. Preventive migraine treatment. Continuum. 2015;21(4 headache):973–989. doi:10.1212/con.0000000000000199
40. Lipton RB, Silberstein SD. Episodic and chronic migraine headache: breaking down barriers to optimal treatment and prevention. Headache. 2015;55(Suppl2):103–22;quiz123–6. doi:10.1111/head.12505_2
41. Weatherall MW. The diagnosis and treatment of chronic migraine. Ther Adv Chronic Dis. 2015;6(3):115–123. doi:10.1177/2040622315579627
42. Ford JH, Schroeder K, Buse DC, et al. Predicting initiation of preventive migraine medications: exploratory study in a large U.S. medical claims database. Curr Med Res Opin. 2020;36(1):51–61. doi:10.1080/03007995.2019.1657716
43. Brusa P, Allais G, Rolando S, et al. Migraine attacks in the pharmacy: a gender subanalysis on treatment preferences. Neurol Sci. 2015;36(Suppl 1):93–95. doi:10.1007/s10072-015-2156-7
44. Blumenfeld AM, Varon SF, Wilcox TK, et al. Disability, HRQoL and resource use among chronic and episodic migraineurs: results from the International Burden of Migraine Study (IBMS). Cephalalgia. 2011;31(3):301–315. doi:10.1177/0333102410381145
45. Lanteri-Minet M. Economic burden and costs of chronic migraine. Curr Pain Headache Rep. 2014;18(1):385. doi:10.1007/s11916-013-0385-0
46. Negro A, Sciattella P, Rossi D, Guglielmetti M, Martelletti P, Mennini FS. Cost of chronic and episodic migraine patients in continuous treatment for two years in a tertiary level headache Centre. J Headache Pain. 2019;20(1):120. doi:10.1186/s10194-019-1068-y
47. Khanal S, Underwood M, Naghdi S, et al. A systematic review of economic evaluations of pharmacological treatments for adults with chronic migraine. J Headache Pain. 2022;23(1):122. doi:10.1186/s10194-022-01492-y
48. Galcanezumab for preventing migraine. (2020) NICE technology appraisal guidance TA659.
49. Seng EK, Rains JA, Nicholson RA, Lipton RB. Improving medication adherence in migraine treatment. Curr Pain Headache Rep. 2015;19(6):24. doi:10.1007/s11916-015-0498-8
50. Murray AM, Stern JI, Robertson CE, Chiang CC. Real-world patient experience of CGRP-targeting therapy for migraine: a narrative review. Curr Pain Headache Rep. 2022;26(10):783–794. doi:10.1007/s11916-022-01077-z
51. Pirracchio R, Resche-Rigon M, Chevret S. Evaluation of the Propensity score methods for estimating marginal odds ratios in case of small sample size. BMC Med Res Method. 2012;12(1):70. doi:10.1186/1471-2288-12-70
 © 2025 The Author(s). This work is published and licensed by Dove Medical Press Limited. The
full terms of this license are available at https://www.dovepress.com/terms.php
and incorporate the Creative Commons Attribution
- Non Commercial (unported, 3.0) License.
By accessing the work you hereby accept the Terms. Non-commercial uses of the work are permitted
without any further permission from Dove Medical Press Limited, provided the work is properly
attributed. For permission for commercial use of this work, please see paragraphs 4.2 and 5 of our Terms.
© 2025 The Author(s). This work is published and licensed by Dove Medical Press Limited. The
full terms of this license are available at https://www.dovepress.com/terms.php
and incorporate the Creative Commons Attribution
- Non Commercial (unported, 3.0) License.
By accessing the work you hereby accept the Terms. Non-commercial uses of the work are permitted
without any further permission from Dove Medical Press Limited, provided the work is properly
attributed. For permission for commercial use of this work, please see paragraphs 4.2 and 5 of our Terms.
Recommended articles
Holistic View of Autografting Patients by Percentage of Total Body Surface Area Burned: Medical Record Abstraction Integrated with Administrative Claims
Hahn H, Yu TC, Teng CC, Tan H
ClinicoEconomics and Outcomes Research 2023, 15:251-267
Published Date: 8 April 2023
Treatment Patterns and Healthcare Resource Use in Medicare Beneficiaries with Parkinson’s Disease
Song Y, E JY, Guo T, Sasane R, Arcona S, Keshava N, Wu E
ClinicoEconomics and Outcomes Research 2023, 15:631-643
Published Date: 2 August 2023