")
Back to Journals » Patient Related Outcome Measures » Volume 15
Ultra-Low Frequency Transmitted Ultrasound Breast Imaging vs DBT (Digital Breast Tomosynthesis): A Patient-Reported Outcome Study
Authors Iuanow E , Pickup EA, Malik B, Doehrmann J, Huyke FA, Ducker R , Klock J
Received 24 August 2023
Accepted for publication 2 August 2024
Published 28 August 2024 Volume 2024:15 Pages 219—240
DOI https://doi.org/10.2147/PROM.S423380
Checked for plagiarism Yes
Review by Single anonymous peer review
Peer reviewer comments 2
Editor who approved publication: Dr Robert Howland
Elaine Iuanow,1 Emily A Pickup,2 Bilal Malik,1 Julie Doehrmann,2 Fernando A Huyke,3 Rachel Ducker,1 John Klock1
1QT Imaging Inc, Novato, CA, USA; 2CODE Technology, Minneapolis, MN, USA; 3TRIA Orthopedics, Minneapolis, MN, USA
Correspondence: Elaine Iuanow, Email [email protected]
Purpose: Breast cancer screening remains a challenge in the United States. Many women do not get a mammogram because of pain associated with the exam, radiation exposure, false-positive results, and additional costs. Others who may benefit from annual screening do not qualify because of young age and radiation risk. We hypothesize that a novel volumetric transmitted breast ultrasound, Quantitative Transmission (QT) Scan may encourage more women to have annual breast cancer screening. Assessing results from patient-reported outcomes (PROs) may predict the value of newer, more desirable screening technologies.
Participants and Methods: Pre- and post-menopausal women who qualified for breast cancer screening were enrolled in a prospective trial of Quantitative Transmission (QT Scan) vs traditional mammography via Digital Breast Tomosynthesis (DBT) Clinical Trials.gov NCT 03052166. These women completed questionnaires to assess their experiences with QT Scan and DBT. Associations between QT Scan or DBT and differences in PRO scores were examined.
Results: A total of 430 subjects completed the PRO instrument analyzed. A total of 36 questions were asked, 34 were paired for both QT and DBT and two were asked regarding exclusively the QT Scan. Physical discomfort, perceptions of safety and low efficacy, false-positive results and additional out-of-pocket expenses were concerns identified as highest risk for opting out of screening mammography (differences between 2.1 and 2.9 indicate significant differences between means and standard deviations using the Cohen’s d statistic). Student’s T-test shows a significance level of < 10 − 10. Statistically significant differences in PROs between QT Scan and DBT were observed by 14 of the 17 paired experience questions (p< 0.001).
Conclusion: Significant differences in PROs were found between QT scan and DBT, indicating women have significantly more negative experiences with traditional mammography via DBT and are less inclined to undergo screening mammography. Identification of PRO differences could be used to help identify a more desirable breast cancer screening modality.
Keywords: breast screening, transmission ultrasound, patient-related outcomes
Introduction
Breast cancer screening of all eligible women in the United States is an ongoing challenge. According to a study from Massachusetts Institute of Technology (MIT) in 2020, only 35% of women get screened every year from 40 years old and onward.1 Additionally, it has been recently noted that women who are at the greatest risk for developing breast cancer are not being screened. Various reasons exist for the low screening numbers, including concerns about radiation exposure, pain and discomfort associated with mammography, concerns about false-positive exams resulting in unnecessary treatment2 and associated out-of-pocket costs, particularly for women with dense breasts. The lack of imaging technology for young, high-risk women less than 40, and underserved women with access and economic issues, or even women with dense breasts who are concerned by the limitations of current technology such as false-positive findings and added costs leaves tens of thousands of women with no viable breast screening options.
In women with dense breasts, the current standard recommendation for breast cancer screening includes Digital Mammography (DM) and Digital Breast Tomosynthesis (DBT). This combination is suboptimal for breast cancer detection in dense breasts since cancer, which is white on mammography, is difficult to see on a background of white dense breast fibro-glandular tissue. In young women with dense breasts, the lack of safe, accurate and accessible breast imaging, especially for those women too young to be screened with mammography and those women with dense breasts remains a significant challenge.2
More than half of all women of screening age have dense breasts, making it more difficult to detect breast cancer on a screening mammogram. These women are also at a slightly higher risk for developing breast cancer due to breast density. About two-thirds of states in the United States have passed laws requiring a woman be notified when her mammogram shows dense breasts, and because of this, women are now more likely to be aware of breast density and its relationship to cancer risk than in the past. Primary care physicians, in states that have passed such laws, often feel poorly prepared to counsel women regarding further screening recommendations, if any, for a woman with dense breasts and a normal mammogram.
Secondary screening methods such as B-mode reflection breast ultrasound and breast MRI have been studied in high-risk women, but data regarding how many ultrasound and MRI-diagnosed women would have eventually presented clinically, the morbidity and mortality of those tumors and whether earlier treatment of the clinically important tumors was more likely to result in cure, is difficult to find due to difficulties randomizing women in studies due to ethical concerns. The high false-positive rates with secondary screening modalities3 means that millions more US women undergoing secondary ultrasound and MRI screening will not know if it is truly helpful or harmful.
A natural desire to help women who want or need to be screened due to risk factors and breast density concerns is driving the push for new technology, especially for women whose breast cancers are missed by mammography. Women with dense breasts who get their mammography results in a letter stating “Your mammogram shows that your breast tissue is dense. Dense breast tissue is common and is not abnormal”; however, the letter does not offer specific guidance about what the woman should do. Currently, mammography centers offer various adjunctive imaging options such as Hand Held Ultrasound (HHUS), Automated Breast Ultrasound (ABUS) or breast MRI when the patient is at moderate or high risk, but given the high false-positive rates associated with current imaging, increased costs, and anxiety resulting from unnecessary procedures, none has been found to be ideal to accurately diagnose clinically relevant lesions that could affect morbidity and mortality outcomes for women. More comfortable, accurate, less expensive, and safe breast imaging could alter the outcomes for women by reducing the false-negative rates from mammography and reducing the false-positive rates for HHUS, ABUS and MRI. The primary obstacles to identifying better breast imaging technologies are the lack of effective outcome trials for women.
The overall purpose of the QT Breast Scan technology is to improve breast health care for women by providing a comfortable breast imaging technology, and at the same time reducing the cost and inconvenience of false-negative and false-positive results under the current breast imaging paradigm of screening mammography, supplemental HHUS and breast MRI. Very importantly, QT Breast Scan provides a safe imaging option for women that currently have no options for screening due to their young age, lack of access or other factors limiting the effectiveness of current breast screening technology. Testing, validating and ultimately adopting the most effective, high performing technologies for breast imaging that women are comfortable with is a key discipline that needs to be undertaken to improve women’s breast health.
Opting Out of Mammography
Despite much effort to encourage women to get regular mammographic breast cancer screening, data from multiple research and clinical practice settings show that failure to begin or discontinuation of x-ray mammography is common, ranging from 30% to 70%.4 Although reasons for early discontinuation are multifactorial, data suggest that up to 30% of patients do not undergo screening mammography because of adverse symptoms or outcomes, most commonly concerns about risk and effectiveness, including false-positive and false-negative results. Multiple studies have explored predictors of non-adherence to screening mammography such as baseline demographic and/or clinicopathologic features; however, inconsistent results between studies have made it difficult for clinicians to accurately predict which patients are at greatest risk for non-adherence or discontinuation. Studies on non-adherence to mammography demonstrate multiple variables are associated with non-adherence or discontinuation.5 This latter observation suggests that changes in perception and education about suitable alternatives for screening early in the woman’s life could be a helpful approach that may allow for more successful screening interventions.
Ultra-Low Frequency Transmitted Ultrasound Breast Imaging
The QT Imaging BR15 trial (clinicaltrials.gov NCT 03052166) represents a prospective case collection and blinded reader study performed to investigate the sensitivity and specificity of the QT Breast Scan vs DBT and the effects on recall rates.6 The study also included prospective patient-reported outcome (PRO) measures throughout the study and post-study periods. Measures included assessment of overall quality of their experience, discomfort, concerns, mood, perception of accuracy, recall experiences and multiple symptoms, including a comparison of their experience with both the QT Breast Scan and DBT. We recently reported a statistically significant difference in sensitivity, specificity, and recall rates between the QT Breast Scan and DBT7 in a similar cohort. These results confirm that the QT Breast Scan is non-inferior to mammography and these data will inform decisions about whether this newer, comfortable, and accurate technology without radiation will be used by more women.
Materials and Methods
Study Participants
We selected participants from a recent prospective, multi-center case collection study of breast imaging examinations from up to 1200 asymptomatic women comparing the non-inferiority of QT Breast Scan compared to DBT in the evaluation of sensitivity, specificity, positive predictive value (PPV) and call-back rates. Pre- and postmenopausal women were eligible for enrollment in the trial. Details of the trial have been previously published (ClinicalTrials.gov NCT03052166). All subjects were female, age 25 or older, willing to receive a QT Breast Scan, eligible for routine screening mammography as per the American College of Radiology (ACR) guidelines, willing and able to provide written, signed Informed Consent Form (ICF) after the nature of the study was explained, all questions answered prior to any research-related procedure(s) and willing and able to submit or complete at the clinical site a DM with DBT exam (to include Craniocaudal (CC) and Mediolateral Oblique (MLO) views for one or both breasts, within 3 months, before or after, their QT Breast Scan. The institutional review boards for all participating sites (Marin Breast Health Trial Center, Novato CA, George Washington University Hospital, Washington DC, Elizabeth Wende Cancer Center, Rochester, NY and Long Beach Memorial Hospital, Long Beach, CA) approved the clinical trial. Subjects were required to provide written informed consent before undergoing a QT Breast Scan. This research protocol presented minimal risk to subjects, investigators, and study personnel. Ultrasound has been demonstrated to be safe and well tolerated over the more than 50 years it has been used in clinical diagnostic medicine. The FDA Cleared8 QT Ultrasound system, like commercially available ultrasound systems, has a very low-risk profile for both the operator performing the acquisitions and the subject. The QT Breast Scan aims to improve conventional handheld ultrasound technology and does not utilize radiation, compression of the breast, nor does it require intravenous injections of contrast agents or radiopharmaceuticals.
Primary Objective
The primary objective was to assess and compare the overall quality of women’s experiences (discomfort, concerns, mood, perception of accuracy, follow-ups and multiple symptoms) between having a QT Breast Scan and a DBT.
Secondary Objective
The secondary objective was to determine whether early changes in Patient-Related Outcome (PRO) measures can influence a decision for failure to undergo mammography or early discontinuation of mammography screening. Also, we explored the differences between PRO scores and various behavioral factors to see if differences in PRO scores could be used as an indication of subjects’ decisions to continue traditional mammography screening. Standard call-back rates in this study reflect the standard mammography benchmarks which will be used to compare the two modalities.
The Null Hypotheses
For both of these objectives, on the basis of previous data from responses from over 15,000 women imaged with QT, the null hypotheses were as follows: (a) there would be no significant difference in PRO Scores between QT and DBT, (b) there would be no significant difference in subject experiences between QT and DBT that would predict early discontinuation of DBT as indicated by comparative question analysis, and (c) higher recall rates would be not associated with greater negative experiences.
Subject Enrollment
Eligible subjects from QT Imaging that had previously received a QT Breast Scan were identified by QT Imaging and a list of 1200 eligible subjects’ contact information (email and phone numbers) were securely transferred to CODE Technology through CODE’s HIPAA-compliant web application. CODE Technology assigned a participant ID to each enrolled patient and distributed Email communications to the eligible subjects (see attached Email language in Appendix A). If participants responded by Email declining participation, the Email responses were linked to the participant ID. By completing the survey, participants consented to their responses being used for research purposes in a confidential manner. Surveys that were completed by participants were assigned a unique survey ID. At the completion of data collection, all participant information was de-identified. All survey responses and Email replies were securely archived. Data analysis was performed using de-identified aggregate survey responses.
Subject Consent
No separate consent document was utilized for PROs survey administration, and no subject signatures were acquired as the Email communications performed the informed consent process. Participants consented to their responses used for research by nature of completing the survey. Email communications that contained frequently asked questions and answers section informed participants of the following: purpose of the study, participation was voluntary, a description of participant confidentiality, the involvement criteria, who to contact for additional questions, and that responses would be used for research purposes with submission to the FDA. For reference, the E-mail message is seen in Appendix A. The frequently asked questions and answers that were linked within the Email script for patients to access can be found in Appendix B.
Study Procedures for Mammography
All mammograms were performed as part of routine clinical screening at MQSA certified and ACR certified facilities. These facilities are regulated and inspected by the ACR for the FDA.9 The MQSA standards require certification of the equipment, procedures, technician and radiology training and safety monitoring for each mammography facility operating in the US Subjects received standard CC and MLO views of both breasts, as well as the standard DBT exams, and the results were interpreted by MQSA-certified radiologists as per standard interpretation protocols.
Study Procedures for the QT Scan
Once the subject was properly positioned on the QT Imaging Scanner, the Application Specialist entered a sequentially assigned de-identifying subject number and simple demographic information into the user interface and started the scanning process by pushing the start button which initiates data collection. The transmitter and receiver assembly moved around the suspended breast to record data from successive sub-volumes of the targeted tissues as the ultrasound was propagated through the water bath. The data was collected throughout the scanning process and once completed, processed using proprietary algorithms developed by QT Imaging Inc. The resulting output included two co-registered sets of images from both transmission and reflection ultrasound. The scan took approximately 8–16 minutes per breast.
PRO Questionnaire
The PRO instrument, enrollment activities, acquisition of all participant PHI and data acquisition, storage and security were done by a PRO contractor, CODE Technology, Minneapolis Minnesota https://www.codetechnology.com/. Statistical significance testing was performed by a separately contracted data scientist. Validated tools for analysis were used. The PRO instrument administered by CODE Technology was created with input from both subjects, staff and physicians who have used the QT Scanning technology for over 10 years in more than 15,000 subjects. The 36 questions were developed to address the concerns expressed by subjects who had the QT Breast Scan. More than 90% of these 15,000 subjects also had a mammogram at some time in their lives. For inclusion in the PRO study, the subjects must have received both a QT Breast Scan and a mammogram within the same 12-month period.
The PRO Instrument questions can be found in Appendix C. Scores for level of discomfort or anxiety ranged from 0 (no discomfort) to 10 (worst imaginable discomfort), and agreement scores were scored on a 5-point Likert scale, ranging from Strongly Agree (5), Agree, Neutral, Disagree, to Strongly Disagree (1). Scores for call-back experiences ranged from 1) Not Applicable (N/A) – No callback was done, 2) the call-back resulted in unremarkable or benign findings recommending routine follow-up, 3) probable benign findings recommending short-term follow-up, 4) suspicious findings recommending additional imaging and/or biopsy, 5) technical imaging issues recommending re-imaging at the present time. Other questions addressed issues of safety and adverse events, call-back events, out-of-pocket expenses, false-positive imaging results, perception of accuracy and overall satisfaction with the QT Breast scan.
PRO Questionnaire Distribution
The PRO instrument was distributed by CODE Technology staff via e-mail (Appendix A) to a list of 1200 subjects provided by QT Imaging as having had a QT Breast Scan. All persons contacted had been part of one or more clinical trials involving the QT scanning technology sponsored by QT Imaging Inc. When the subject received the initial e-mail communication, the informed consent process was presented via a statement “by completing this survey you are agreeing to your responses being utilized for research” (see Appendix A). If there was no initial response from the potential subject, a second e-mail communication was sent. Over 96% of the potential subjects contacted agreed to participate in the study.
Statistical Analysis
In this analysis, the first objective was to compare differences in PRO mean scores between QT Breast Scan and DBT. Of the 36 questions on the PRO survey, 17 questions were paired experience questions (question asked first in relation to the QT Breast Scan, then asked in relation to the DBT, for a total of 34 questions), and 2 additional questions were asked in relation to the QT Scan only.
Before performing group comparisons, Cronbach’s alpha was calculated for both the QT scan and the mammogram. This was done to assess the scale’s internal consistency and reliability. This is usually done when multiple Likert questions are used in a survey/questionnaire that form a scale and the user wants to determine if the scale is reliable. Additionally, the data was also tested for normality using the Shapiro–Wilk test, to determine if the p-value for differences should be calculated using parametric or non-parametric testing. In addition to testing for significant difference between the groups, we used Cohen’s D to compare clinical significance of the two PRO results: DBT vs QT Scan. While the t-test (parametric) or Wilcoxon signed rank test (non-parametric) indicate if there is a significant difference between the two compared groups, Cohen’s d offers additional insight of quantifying the effect size associated with the difference between the groups.
CODE Technology acted as an unbiased third-party for data collection and data analysis. CODE was unaware of the primary goals of this study or the null hypotheses. To determine the effect size associated with the meaningful difference between the paired experience questions, a Cohen’s d analysis was performed to compare the average scores on the QT Breast Scan PRO questions to the average scores on the DBT PRO questions. Cohen’s d was calculated using the pooled standard variance model, given that the number of applicable participant answers for each paired patient experience question were not always equal (for example, when asked about level of discomfort when receiving a mammogram, participants that answered “N/A, I have not yet received a mammogram” were not counted in the comparative analysis).
To calculate Cohen’s d via pooled standard deviation (sp):

where:
- x1, x2: mean of sample 1 and sample 2, respectively
- s12, s22: variance of sample 1 and sample 2, respectively
Using this formula, here is how we interpreted Cohen’s d:
- A d of 0.5 indicates that the two groups differ by 0.5 standard deviations.
- A d of 1 indicates that the group means differ by 1 standard deviation.
- A d of 2 indicates that the group means differ by 2 standard deviations.
Alternatively, another way to interpret Cohen’s d: An effect size of 0.5 means the value of the average person in group 1 is 0.5 standard deviations above the average person in group 2. Each question was modeled as continuous variables. Multiple comparisons were not controlled for. Statistical analyses were conducted using SAS v9.3 (SAS Institute, Inc, Cary, NC, http://www.sas.com).
Assessing Scale Reliability
Cronbach’s alpha was calculated for both the QT scan and the mammogram to assess scale internal consistency and reliability. The Cronbach’s alpha coefficient was evaluated using the guidelines suggested by George and Mallery (2018) where >0.90 excellent, >0.80 good, >0.70 acceptable, >0.60 questionable, >0.50 poor, and ≤0.50 unacceptable Variables that did not correlate were reverse coded in attempts to interpret the Cronbach’s alpha more accurately. The Cronbach’s alpha for QT scan was 0.82 [95% CI: 0.78, 0.86]. For mammogram, Cronbach’s alpha was 0.87 [0.85, 0.90]. Both of these results indicate good reliability.
Assessing Significant Differences
The Shapiro–Wilk test was conducted to determine whether the differences in QT scan and mammogram scores for each respective survey item could have been produced by a normal distribution (Razali & Wah, 2011). With an alpha-value of 0.05, all score distributions for all questions were non-normal with p-values <0.05. These results suggest the differences in QT scan and mammogram scores for each survey item are unlikely to have been produced by a normal distribution, indicating the normality assumption is violated. Because the assumption of normality was violated for all survey questions, Wilcoxon Signed Rank Tests rather than paired Student’s t-tests were conducted to assess for significant differences in the data.
Results
Subject Characteristics
Four hundred and thirty of 1200 subjects in the potential study pool agreed to participate in the study. No patients withdrew from study participation.
Demographics
Site for their QT breast scan and participant demographic characteristics are shown in Table 1.
 |
Table 1 Demographic Characteristics (n = 430) |
Average age of subject was 57 years of age (range was 29 to 89 years) and 100% identified as female. The percentage of subjects who completed their trial enrollments are also shown in Table 1.
The study schema (Figure 1) is a flow diagram indicating a patient’s eligibility for the PRO study. If the patient had a QT scan with or without a mammogram and consented to the survey regarding the QT scan, then the patient was eligible for the study.
 |
Figure 1 Study schema. The study schema to determine participant eligibility. |
Statistical Analysis to Determine Scale Reliability and Normality
Assessing Scale Reliability
Cronbach’s alpha was calculated for both the QT scan and the mammogram to assess scale internal consistency and reliability. The Cronbach’s alpha coefficient was evaluated using the guidelines suggested by George and Mallery (2018) where >0.90 excellent, >0.80 good, >0.70 acceptable, >0.60 questionable, >0.50 poor, and ≤0.50 unacceptable Variables that did not correlate were reverse coded in attempts to interpret the Cronbach’s alpha more accurately. The Cronbach’s alpha for QT scan was 0.82 [95% CI: 0.78, 0.86]. For mammogram, Cronbach’s alpha was 0.87 [0.85, 0.90]. Both of these results indicate good reliability.
Assessing Significant Differences
The Shapiro–Wilk test was conducted to determine whether the differences in QT scan and mammogram scores for each respective survey item could have been produced by a normal distribution (Razali & Wah, 2011). With an alpha-value of 0.05, all score distributions for all questions were non-normal with p-values <0.05. These results suggest the differences in QT scan and mammogram scores for each survey item are unlikely to have been produced by a normal distribution, indicating the normality assumption is violated.
Because the assumption of normality was violated for all survey questions, Wilcoxon Signed Rank Tests rather than paired Student’s t-tests were conducted to assess for significant differences in the data. Details on all questions are shown below in Tables 2 and 3.
 |
Table 2 Assessment Question and Comparative Statistical Analysis for the PRO Tool; Number of Subjects (N), Mean and Standard Deviation (SD) for QT Scan, DBT, Wilcoxon Signed Rank Tests, Z-Score, p-values and Cohen’s D Scores Below |
 |
Table 3 Chi-Square Tests for Differences in Categorical Data. Chi-Square Tests Were Conducted to Assess Differences for Questions with Categorical Data. These are Reported Below |
Chi-square tests were also performed and are shown in Table 3.
Overall Scoring – The PRO survey consisted of 36 questions (34 paired experience questions—17 for experiences related to the QT Scan and 17 of the same questions for experiences related to DBT; in addition to two other questions). Each survey answer option was assigned a point value. The QT Breast Scan Score was created from the sum of all odd questions (1–35) in addition to question 36 for a total possible QT Breast Scan Score ranging from 0 to 100. The Mammogram Score was created from the sum of all even questions (2–36) in addition to question 13 for a total possible Mammogram Score ranging from 0 to 100. Lower overall scores were associated with more negative experiences, while higher overall scores were associated with more positive experiences.
The overall summary scores are included at the end of Table 2, with score distributions displayed in Figure 2. Differences in PRO scores for QT compared to DBT showed a Cohen d score of 2.8 (highly significant). When the d statistic is converted to the student’s t-test, it shows a significance level of <10 −10. Lower overall scores were associated with more negative experiences, while higher overall scores were associated with more positive experiences. The results indicate significant differences between the overall experience with the QT Breast Scan (mean score of 90.04 out of 100) compared to a Mammogram (mean score of 43.56 out of 100) (p<0.001).
 |
Figure 2 PRO tool score distributions. A total point value was assigned for each answer option on the PRO tool. Questions related to patients’ experience with the QT Breast Scan were added to create a QT Breast Scan Score from 0–100 for each participant. Questions related to patients’ experiences with a Mammogram were added to create a Mammogram Score from 0–100. Reflects the average QT Breast Scan PRO Score distribution compared to the average Mammogram PRO Score Distribution. Lower overall scores were associated with more negative experiences, while higher overall scores were associated with more positive experiences. The results indicate significant differences between the overall experience with the QT Breast Scan compared to a Mammogram (Cohen D 2.84; p<0.001). |
The summary scores and histograms for all 36 questions and their answer distributions are shown in Figures 2–21.
 |
Figure 3 Questions and answer distribution for “Rate your level of discomfort during the (QT Breast Scan vs Mammogram)”. For questions #1-2 “Rate your level of discomfort during the QT Breast Scan vs the Mammogram” with a score of 0=no discomfort and a score of 10= worst imaginable discomfort. There was a significant difference in the level of discomfort between the two modalities with QT scan giving a mean score of 0.79 and the mammogram a mean score of 5.95 (Cohen d of −2.43; p<0.001). |
 |
Figure 4 Questions and answer distribution for “Rate your level of anxiety during the (QT Breast Scan vs Mammogram)”. For questions #3 and 4 “Rate your level of anxiety during the QT Breast Scan vs the Mammogram” with a score of 0 = no discomfort and a score of 10 = worst imaginable discomfort. There was a significant difference in the level of discomfort between the two modalities with QT scan giving a mean score of 0.70 and the mammogram a mean score of 5.1 (Cohen d of −0.72; p<0.001). |
 |
Figure 5 Questions and answer distribution for “I will dread having another procedure (QT Breast Scan vs Mammogram)”. For questions #5 and 6 “I will dread having another procedure:” Rate your level of agreement for the QT Breast Scan vs the Mammogram from strongly agree (5 points) to strongly disagree (1 point). There was a significant difference in the level of agreement between the two modalities with QT scan giving answers of strongly disagree vs the mammogram (Cohen d of −2.53; p<0.001). |
 |
Figure 6 Questions and answer distribution for “Having the procedure (QT Breast Scan vs Mammogram) made me feel uneasy or embarrassed”. For questions #7 and 8 “Having the procedure made me feel embarrassed or uneasy”. Rate your level of agreement for the QT Breast Scan vs the Mammogram from strongly agree (5 points) to strongly disagree (1 point). There was a significant difference in the level of agreement between the two modalities with QT scan giving answers of strongly disagree vs the mammogram (Cohen d of −1.78; p<0.001). |
 |
Figure 7 Questions and answer distribution for “I am concerned that my procedure (QT Breast Scan vs Mammogram) will cause breast cancer”. For questions #9 and #10 “I am concerned that the breast scan will cause breast cancer”. Rate your level of agreement for the QT Breast Scan vs the Mammogram from strongly agree (5 points) to strongly disagree (1 point). There was a significant difference in the level of agreement between the two modalities with QT scan giving answers of strongly disagree vs the mammogram (Cohen d of −2.16; p<0.001). |
 |
Figure 8 Questions and answer distribution for “I am concerned that I received radiation from my procedure (QT Breast Scan vs Mammogram)”. For questions #11 and #12 “I am concerned that I received radiation from my procedure (QT Scan vs Mammogram)”. Rate your level of agreement from strongly agree (5 points) to strongly disagree (1 point). There was a significant difference in the level of agreement between the two modalities (Cohen d of −2.9; p<0.001). |
 |
Figure 9 Questions and answer distribution for “I am confident that I can receive multiple QT Breast Scans without additional radiation exposure”. For question #13 “I am confident that I can have multiple QT Breast Scans without additional radiation exposure”. Rate your level of agreement from strongly agree (5 points) to strongly disagree (1 point). |
 |
Figure 10 Questions and answer distribution for “After my procedure I had bruising, skin irritation, or soreness on or around my breast”. For questions #14 and #15 “After my procedure, I had bruising, skin irritation, or soreness on or around my breast”. Rate your level of agreement for the QT Breast Scan vs the Mammogram from strongly agree (5 points) to strongly disagree (1 point). There was more than 90% level of agreement with QT scan giving answers of disagree or strongly disagree and 64% of subjects agreed that mammograms had resulting bruising, skin irritation or soreness on or around my breast (Cohen d of −1.6; p<0.001). |
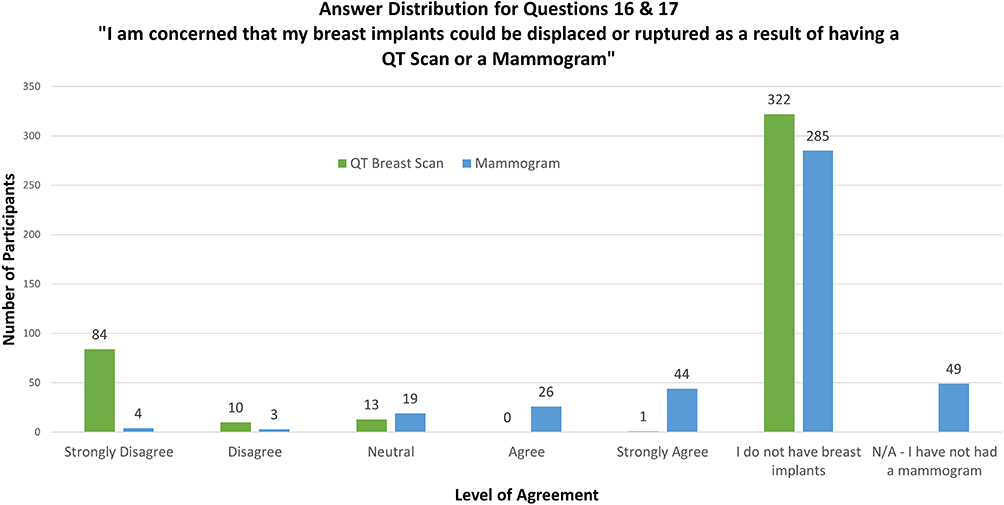 |
Figure 11 Questions and answer distribution for “I am concerned that my breast implants could be displaced or ruptured as a result of having a (QT Scan vs Mammogram)”. For questions #16 and #17 “I am concerned that my breast implants could be displaced or ruptured as a result of having a QT Breast Scan or a mammogram”. Rate your level of agreement for the QT Breast Scan vs the Mammogram from strongly agree (5 points) to strongly disagree (1 point). There was more than 91% level of agreement with QT scan giving answers of disagree or strongly disagree and 64% of subjects agreed that their breast implants could be displaced or ruptured because of having a mammogram (Cohen d of −3.1; p<0.001). |
 |
Figure 12 Questions and answer distribution for “I believe the (QT Scan vs Mammogram) results are accurate”. For questions #18 and #19 “I believe the QT Scan or mammogram I had gives accurate results”. Rate your level of agreement for the QT Breast Scan vs the Mammogram with a level of agreement from strongly agree (5 points) to strongly disagree (1 point). There was more than 88% level of agreement with QT scan giving answers of agree or strongly agree and 37% agreement with mammograms giving answers of agree or strongly agree (Cohen d of 1.31; p<0.001). |
 |
Figure 13 Questions and answer distribution for “I am more confident of my breast health after having a (QT Scan vs Mammogram)”. For questions #20 and #21 “I am more confident of my breast health after having a QT Breast Scan vs a mammogram”. Rate your level of agreement for the QT Breast Scan vs the Mammogram from strongly agree (5 points) to strongly disagree (1 point). There was more than 89% level of agreement with QT scan giving answers of agree or strongly agree and 37% agreement with mammograms giving answers of agree or strongly agree (Cohen d of 1.38; p<0.001). |
 |
Figure 14 Questions and answer distribution for “Because I have dense breasts, I am more confident after having a (QT Scan vs Mammogram)”. For questions #22 and #23 “Because I have dense breasts, I am more confident after having a QT Breast Scan or a mammogram”. Rate your level of agreement for the QT Breast Scan vs the Mammogram from strongly agree (5 points) to strongly disagree (1 point). There was more than 91% level of agreement with QT scan giving answers of agree or strongly agree, and 37% agreement with mammograms giving answers of agree or strongly agree (Cohen d of 2.3; p<0.001). |
 |
Figure 15 Questions and answer distribution for “The results of my procedure were…” For questions #24 and #25 “The results of my procedure were”. Describe the results according to the choices below. The answer distributions are displayed in the histogram and the breakdown or percentages are displayed in the table (Cohen d of −0.49; p<0.001). |
 |
Figure 16 Questions and answer distribution for “Were you asked to have a follow-up (QT Scan vs Mammogram) for an abnormality after your initial procedure?” For questions #26 and #27 “Were you asked to have a follow-up (QT Scan vs Mammogram) for an abnormality after your initial procedure?”. The answer distributions are displayed in the histogram and the breakdown or percentages are displayed in the table (Cohen d of 0.52; p<0.001). |
 |
Figure 17 Questions and answer distribution for “Have you had a false-positive finding (a finding that turned out to be nothing)?”. For questions #28 and #29 “Have you had a false-positive finding that turned out to be nothing?” Significant differences were found between groups: the false-positive rate was 2.5% for the QT Scan and 32.5% for the mammogram (p<0.001). |
 |
Figure 18 Questions and answer distribution for “I had additional out-of-pocket expenses because my results were false-positive (a finding that turned out to be nothing)”. For questions #30 and #31 “I had additional out-of-pocket expenses because my imaging procedure results were false-positive (a finding that turned out to be nothing). Significant differences were found between groups: the rate for additional false-positive costs was 1.2% for the QT Scan and 21.2% for the mammogram (p<0.001). |
 |
Figure 19 Questions and answer distribution for “Overall, my experience with (QT Breast Scan vs Mammogram) has been very satisfactory”. For questions #32 and #33 “Overall, my scan experience with my breast imaging procedure has been very satisfactory”. Rate your level of agreement for the QT Breast Scan vs the Mammogram from strongly (5 points) agree to strongly disagree (1 point). The agree and strongly agree rate for the QT Scan was 93% and the agree or strongly agree rate for the mammogram was 23% (Cohen d of 2.03; p<0.001). |
 |
Figure 20 Questions and answer distribution for “I would recommend a (QT Breast Scan vs Mammogram) to friends and family”. For questions #34 and #35 “I would recommend a QT Breast Scan vs a mammogram to friends and family”. Rate your level of agreement for the QT Breast Scan vs the Mammogram. Scores ranged from 0= Very Likely to Recommend to 10= Very Unlikely to Recommend. The Very Likely rate for the QT Breast Scan was 74% vs 14% for the mammogram (Cohen d of −1.45; p<0.001). |
 |
Figure 21 Question and answer distribution for “Compared to my experience with a mammogram, my experience with the QT Breast Scan was…” For question #36 “Compared to my experience with a mammogram my experience with the QT Breast Scan was as expected, better than expected or much better than expected”. The As Expected, Better than Expected or Much Better than Expected rate was 77%. |
Discussion
The PRO instrument questions were developed over many years after receiving input from participants and staff during the process of performing over 15,000 QT breast scans between 2012 and 2022. A total of 430 participants completed the PRO instrument for this study. The methodology was used in multiple PRO studies performed by CODE Technology. CODE Technology received input from QT Imaging physicians for all subject communications, consent forms, e-mail communications and hosted the online PRO completions. CODE Technology independently performed all the data collection, data tracking, archiving, and analysis of clinical significance using Cohen’s d effect size calculations. Statistical significance testing was performed by a separately contracted data scientist.
The 36 questions in the PRO instrument addressed 19 different outcomes, and 17 of the 19 showed highly significant differences between QT and DBT, indicating an overall more positive experience with the QT Breast Scan compared to traditional mammography. Physical discomfort, perceptions of safety and low efficacy, concerns for implant displacement, dense breast imaging accuracy, clinical call-back visits, false-positive results and additional out-of-pocket expenses were associated with the highest significant differences. Cohen’s d statistics of between 2.1 and 2.9, by themselves indicate a clinically significant difference in patient experience between these two procedure types. Levels of uneasiness, bruising, and interpretation of accuracy were less consistently associated with change in PRO measures. Cohen’s d statistics between 1 and 1.6, by themselves indicate a clinically significant difference in patient experience. Overall, clinically significant differences in PROs between the QT Breast Scan and DBT were observed in 17 of 19 PRO questions.
The null hypothesis was rejected for 17 of the 19 PRO measures, and the levels of significance were very high, meaning that the subjects’ experience was far more favorable for the QT breast scan than their experience with mammography.
Limitations of the Study
The study was limited to only 430 subjects, and the demographics showed that certain populations were under-represented. Prior experiences, such as time since the last mammogram were also not controlled for as a variable. There is the possibility of implicit bias given that the QT Breast scan was a newer technology, did not expose the subject to radiation or compression and had higher specificity leading to fewer call-backs.
Conclusion
Screening all eligible women who are at risk for breast cancer is not occurring with enough frequency. Many reasons exist for this problem and assessing the patient experience in PROs related to mammography was associated with an option to be less inclined to undergo screening mammography. Identification of these perceptions could be used to target interventions in patients at high risk for opting out of standard screening paradigms or not being offered screening mammography to maximize adherence to breast screening recommendations and to offer alternative technologies that may be more effective.
Data Sharing Statement
The authors do not intend to share individual de-identified participant data.
Ethical Requirement
Details of the trial have been previously published in (ClinicalTrials.gov NCT03052166) which complies with the Declaration of Helsinki. The Patient Reported Outcome Study was based on answers provided by subjects as to their scan experience during and after the study period. No additional consent was obtained for the PRO study. Please refer to the manuscript section, Subject Consent, for details.
Acknowledgments
This study was supported in part by grants from the National Institutes of Health (NIH), Bethesda, MD.
Author Contributions
All authors made a significant contribution to the work reported, whether that is in the conception, study design, execution, acquisition of data, analysis and interpretation, or in all these areas; took part in drafting, revising or critically reviewing the article; gave final approval of the version to be published; have agreed on the journal to which the article has been submitted; and agree to be accountable for all aspects of the work.
Disclosure
Dr. John Klock, Dr. Elaine Iuanow, Dr. Bilal Malik and Ms. Rachel Ducker are employees or consultants to QT Imaging Inc. Dr. John Klock is the Chief Medical Officer of QT Imaging Inc. Dr. Emily A Pickup and Mrs. Julie Doehrmann are employees of CODE Technology. At the time of data analysis, Mr. Fernando A Huyke was a research fellow at TRIA Orthopedics. The authors report no other conflicts of interest in this work.
References
1. Massachusetts Institute of Technology. Can mammogram screening be more effective? ScienceDaily; 2020. Available from www.sciencedaily.com/releases/2020/12/201217135350.htm.
2. Miles RC, Chou SH, Vijapura C, et al. Breast cancer screening in women with dense breasts: current status and future directions for appropriate risk stratification and imaging utilization. J Breast Imag. 2022;6:559–567. doi:10.1093/jbi/wbac066
3. Berg WA, Bandos AI, Mendelson EB, et al. Ultrasound as the primary screening test for breast cancer: analysis from ACRIN 6666. J National Cancer Inst. 2016;108:djv367. doi:10.1093/jnci/djv367
4. National Center for Health Statistics. National Health Interview Survey: Mammography: Centers for Disease Control and Prevention (2019). Available from: https://www.cdc.gov/nchs/fastats/mammography.htm.
5. Gierisch JM, Earp J, Brewer NT, et al. Longitudinal predictors of non-adherence to maintenance of mammography. Cancer Epidemiol Biomarkers Prev. 2010;19:1103–1111. doi:10.1158/1055-9965.epi-09-1120
6. Malik B, Iuanow E, Klock J, et al. An exploratory multi-reader, multi-case study comparing transmission ultrasound to mammography on recall rates and detection rates for breast cancer lesions. Acad Radiol. 2022;29(Supplement 1):S10–S18. doi:10.1016/j.acra.2020.11.0.11
7. QT Imaging: In the news (2024). Available from: https://www.qtimaging.com/news.
8. US Food & Drug Administration. K220933; QT Scanner 2000 Model A. Available from: https://www.accessdata.fda.gov/cdrh_docs/pdf22/K220933.pdf.
9. Radiation-emitting products: mammography quality standards act and program. Available from https://www.fda.gov/radiation-emitting-products/mammography-quality-standards-act-and-program.
 © 2024 The Author(s). This work is published and licensed by Dove Medical Press Limited. The
full terms of this license are available at https://www.dovepress.com/terms.php
and incorporate the Creative Commons Attribution
- Non Commercial (unported, 3.0) License.
By accessing the work you hereby accept the Terms. Non-commercial uses of the work are permitted
without any further permission from Dove Medical Press Limited, provided the work is properly
attributed. For permission for commercial use of this work, please see paragraphs 4.2 and 5 of our Terms.
© 2024 The Author(s). This work is published and licensed by Dove Medical Press Limited. The
full terms of this license are available at https://www.dovepress.com/terms.php
and incorporate the Creative Commons Attribution
- Non Commercial (unported, 3.0) License.
By accessing the work you hereby accept the Terms. Non-commercial uses of the work are permitted
without any further permission from Dove Medical Press Limited, provided the work is properly
attributed. For permission for commercial use of this work, please see paragraphs 4.2 and 5 of our Terms.