")
Back to Journals » Drug Design, Development and Therapy » Volume 19
Uncovering the Efficacy and Mechanism of Zhenwu Decoction for Hypothyroidism Based on Non-Targeted Metabolomics
Authors Wang Y, Li Y, Tang M, Zhang L, Zhu S
Received 24 March 2025
Accepted for publication 14 June 2025
Published 25 June 2025 Volume 2025:19 Pages 5431—5451
DOI https://doi.org/10.2147/DDDT.S527163
Checked for plagiarism Yes
Review by Single anonymous peer review
Peer reviewer comments 3
Editor who approved publication: Professor Yan Zhu
Yuhan Wang,1 Yancun Li,1 Mengyao Tang,2 Luhan Zhang,1 Shu Zhu1
1School of Traditional Chinese Medicine, Shandong University of Traditional Chinese Medicine, Shandong, People’s Republic of China; 2Yiyuan County Traditional Chinese Medicine Hospital, Shandong, People’s Republic of China
Correspondence: Shu Zhu, Email [email protected]
Background: Hypothyroidism, a systemic hypometabolic syndrome from deficient thyroid hormone synthesis/utilization, has high prevalence and complex mechanisms. Levothyroxine-based lifelong therapy risks neurocognitive/metabolic complications and iatrogenic pathologies (eg, osteoporosis, hepatocardiac dysfunction). Zhenwu Decoction (ZW), a classical multi-target herbal formulation, shows therapeutic potential but requires mechanistic clarity on thyroid restoration to enable standardized translation.
Objective: To investigate ZW’s therapeutic mechanisms in hypothyroidism via serum metabolomics and pathway analysis.
Methods: Twenty-seven Wistar rats were randomly divided into three groups: control group (n=9), PTU model group (n=9), and Zhenwu Tang group (n=9). The hypothyroidism rat model was induced by administering propylthiouracil (PTU) by gastric gavage for 4 weeks in the PTU model and Zhenwu Tang groups, while the control group received no treatment. Subsequently, the Zhenwu Tang group underwent a 3-week herbal medicine intervention. Multidimensional validation (including phenotypic monitoring, ELISA for FT4/TSH, and HE staining) was performed to confirm the successful establishment of the model and to evaluate the therapeutic efficacy of Zhenwu Tang (ZW). Untargeted UPLC-MS/MS metabolomics was performed to identify differential metabolites (VIP > 1, p < 0.05), and MetaboAnalyst 5.0 was used to map key pathways.
Results: ZW can significantly improve systemic indicators (body weight, anal temperature, feeding behavior) in hypothyroid rats. It remarkably improves the histopathological features of the thyroid gland, approaching the structure of the normal group. In addition, ZW can significantly regulate serum thyroid hormone levels (decrease TSH and increase FT4), approaching normal levels.47 metabolites (eg, L-proline, fumaric acid, estradiol) and 7 pathways (thermogenesis, cholesterol metabolism) were identified. ZW corrected metabolic dysfunction through multi-target regulation.
Conclusion: ZW exerts therapeutic effects by modulating glucose-6-phosphate, bile acids, and critical metabolic pathways, thereby advancing our understanding of hypothyroidism pathophysiology and underscoring its potential for clinical translation and therapeutic development.
Keywords: hypothyroidism, Zhenwu decoction, metabolomics, traditional Chinese medicine, metabolic mechanism
Introduction
Hypothyroidism is a systemic hypometabolic syndrome caused by decreased thyroid hormone synthesis and secretion or tissue utilisation, with a global prevalence of nearly 4.6%.1 The pathogenesis of hypothyroidism is complex and not fully understood, and may be closely related to immune dysregulation, abnormal gene expression, increased apoptosis, and increased oxidative stress.2–4 Hypothyroidism is clinically categorized into overt (TSH↑ + fT4↓) and subclinical (TSH↑ with normal fT4) forms, with the latter subdivided as grade 1 (mild; age-specific TSH upper limit–9.9 mU/L) and grade 2 (marked; TSH≥10 mU/L). Etiological classification includes primary (thyroid dysfunction), central (hypothalamic-pituitary axis defects), and peripheral (tissue hormone resistance) subtypes.5,6 Hypothyroidism not only affects the gastrointestinal and respiratory systems, but also induces hypothyroid crisis and is an independent risk factor for coronary heart disease and myocardial infarction. In addition, hypothyroidism is closely associated with various reproductive endocrine disorders, such as abnormal sexual development, menstrual disorders and infertility, which severely reduce quality of life and cause suffering to patients.7,8 Currently, the main treatment for hypothyroidism is levothyroxine (L-T4) supplementation, but there are problems such as the need for long-term or even lifelong medication, inadequate prevention and control of complications, and the risk of drug overdose, which leads to symptoms such as neurocognitive impairment, weight gain, persistent fatigue, and constipation, and may induce side effects such as osteoporosis, liver dysfunction, and angina pectoris.9 Therefore, the search for new biomarkers with effective drug targets is crucial for the treatment of hypothyroidism.
Herbal medicines, with their advantages of multi-target holistic therapeutic effects achieved through complex compositions, renewability, low cost, and minimal side effects, have demonstrated a long history and broad application prospects in treating various diseases, garnering recognition from both Eastern and Western medical communities.10,11 Traditional Chinese Medicine (TCM) attributes the pathogenesis of hypothyroidism—clinically manifested as cold intolerance, fatigue, lethargy, anorexia, dry and brittle hair, expressionless facies, slowed reaction times, impaired memory, facial and limb edema, menstrual irregularities in women, and erectile dysfunction with premature ejaculation in men—to the “spleen-kidney yang deficiency” syndrome, characterized by impaired qi transformation leading to fluid metabolism disorders, insufficient qi-blood generation due to yang deficiency, and obstruction of qi movement by cold-phlegm-dampness turbidity. These TCM-defined pathological mechanisms closely correlate with modern medical explanations of hypothyroidism, including reduced metabolic rate, microcirculatory dysfunction and dysregulation of the hypothalamic-pituitary-thyroid (HPT) axis.12 Based on this understanding, in clinical practice, many TCM practitioners prefer to use ZW, a classic prescription from the Treatise on Febrile Diseases (compiled over 1800 years ago), for treating hypothyroidism and its complications such as hypothyroid heart disease. This prescription, composed of Aconiti Lateralis Radix Praeparata (processed aconite), Atractylodis Macrocephalae Rhizoma (white atractylodes), Zingiberis Rhizoma Recens (fresh ginger), Paeoniae Radix Alba (white peony root), and Poria (poria cocos), has achieved remarkable therapeutic effects.13–15 As a representative traditional Chinese medicine compound formula, ZW exerts therapeutic effects through multi-component synergism. Ultra-performance liquid chromatography-quadrupole/electrostatic field Orbitrap high-resolution mass spectrometry (UPLC-Q-Orbitrap HRMS) analysis identified 120 constituents from ten chemical classes, including alkaloids (eg higenamine from Aconiti Lateralis Radix Praeparata), lactones, monoterpene glycosides, triterpene acids (eg, pachymic acid from Poria), gingerols (eg, 6-gingerol from Zingiberis Rhizoma), organic acids, sesquiterpenes, coumarins, aldehydes, and glycosides. Pharmacodynamic studies show that higenamine from Aconiti Lateralis Radix Praeparata synergizes with 6-gingerol from Zingiberis Rhizoma to improve myocardial contractility. In addition, the Aconiti-Poria herbal pairing demonstrates superior therapeutic efficacy compared to Aconiti Lateralis Radix Praeparata monotherapy, while the Aconiti-Zingiberis pairing reduces toxicity, collectively validating ZWD’s “multi-component, multi-target, holistic regulation” synergy.16–18 Modern pharmacological studies have shown that ZW significantly elevates serum free thyroxine (FT4) levels while reducing thyroid-stimulating hormone (TSH) levels in rats.19 Thyroid hormone dysregulation is strongly associated with systemic metabolic impairments, including reduced energy expenditure, lipid metabolism disorders (LDL-C, VLDL-C, TG↑), and amino acid metabolism abnormalities (eg, leucine depletion).20–22 However, one of the major challenges faced by TCM is elucidating the underlying mechanisms of herbal efficacy. To this end, metabolomics, as an emerging analytical approach, facilitates rapid screening of potential biomarkers through untargeted metabolomics, combined with enrichment analysis of differential metabolites. Leveraging advancements in bioinformatics, metabolomics can accurately reflect metabolic changes in real-time and explore possible metabolic processes and signaling pathways contributing to these differences, providing a powerful tool for revealing the mechanisms of action of classic prescriptions like ZW.23,24 Ultra-performance liquid chromatography-mass spectrometry (UPLC-MS), as a reliable method for metabolic profiling, is suitable for analyzing complex biological samples and aids in obtaining potential biological information.25
In the meantime, the metabolic profiles of rats were gathered and assessed through ultra-performance liquid chromatography-mass spectrometry (UPLC-MS) metabolomics approach, aiming to investigate the metabolic alterations resulting from the administration of ZW. Although previous metabolomics studies have investigated the therapeutic effects of single herbs on hypothyroidism, most of these studies were limited to single herbs or their extracts, with limited insights into metabolic differences and pathways.26,27 In this study, we pioneered the introduction of ZW and combined the advanced techniques of multi-target analysis and metabolomics to systematically investigate the potential mechanism of action of ZW in the treatment of hypothyroidism for the first time. This research endeavors to establish a robust theoretical framework and scientific rationale for the clinical utilization of ZW in treating hypothyroidism through comprehensive scientific analysis, thus promoting the further development of ZW in the field of integrating traditional Chinese medicine and modern medicine. The research flow diagram of this study is shown in Figure 1.
 |
Figure 1 The research flow diagram of this study. |
Materials and Methods
Representation of Botanical Medicines in Zhenwu Decoction and Corresponding Extraction Method
The Chinese medicinal herbs employed in this experiment consist of: Fuzi (Aconitum carmichaeli Debx., a processed product derived from the lateral root of the plant belonging to the Ranunculaceae family); Fú Líng (harvested from the outer white sclerotium of Poria cocos (Schw). Wolf, a fungus of the Polyporaceae family); Bái Shú (the dried rhizome of Atractylodes macrocephala Koidz., a plant within the Asteraceae family); Bái Sháo (the dried root of Paeonia lactiflora Pall., also a member of the Ranunculaceae family); and Shēng Jiāng (the fresh rhizome of Zingiber officinale Rosc., a plant of the Zingiberaceae family). All of these herbs were supplied by Bozhou Yuanzhendecoction Chinese Medicinal Materials Co., Ltd., and authenticated as genuine by Professor Liu Hongyan of Shandong University of Traditional Chinese Medicine. According to the records in “Treatise on Febrile Diseases”, the modern-day equivalent dosages for ZWare 41.25 g each for Fú Líng, Bái Sháo, and Shēng Jiāng, 27.5 g for Bái Shú, and 15 g for Fuzi.28 Based on the conversion method of body surface area, the conversion coefficient between an adult (70kg) and a rat is 6.3. With the clinical dosage for humans as the dose, the daily dosage for rats is 15.01g/kg respectively. Decoction method: For each 15-day decoction, sufficient medicine is calculated based on the body weight of each rat being 0.4kg. It is estimated that approximately 1164g. Firstly, all the drugs are precisely weighed and soaked in 2994mL of distilled water. After 30 minutes, take out the processed aconite root and boil it in the original water for 50 minutes until there is no numbness when tasted. Then, pour the remaining drugs in and continue to decoct for about 1 hour and 30 minutes until the total remaining liquid is 778mL, with a concentration of 1.5g of crude drug/mL. Store it in a −20 C refrigerator.
Chemicals and Reagents
PTU was purchased from ZhaoHui Pharmaceutical (Shanghai Zhaohui Pharmaceutical Co., Ltd., Batch No.: 2302N06). HPLC-grade acetonitrile and methanol were obtained from Thermo (USA), while ultrapure water was generated using a Milli-Q water purification system manufactured by Millipore Corporation in MA, USA. Formic acid of LC-MS grade was sourced from TCI in Japan. Sigma (USA) was the supplier of ammonium formate. Aladdin (China) provided 2-chloro-L-phenylalanine, and RWD (China) furnished isoflurane. SEVEN (China) was the vendor of 4% paraformaldehyde. Hematoxylin-eosin was acquired from Yuanye Bio-Technology Co., Ltd. in China. Shanghai Meilian Biotechnology Co., Ltd. (Shanghai, China) supplied ELISA kits for free thyroxine (FT4, Batch No.: M1002849) and thyroid-stimulating hormone (TSH, Batch No.: M1002877).
Experimental Animals
Twenty-seven male Wistar rats of SPF grade, aged 8 weeks and weighing between 180–220 grams, were acquired from Beijing Vital River Laboratory Animal Technology Co., Ltd., which holds the qualification certificate number SCXK (Jing) 2021–0006. These experimental animals were housed at the Animal Experimentation Center of Shandong University of Traditional Chinese Medicine. The animal housing facility maintained a controlled environment with a 12-hour light/dark cycle, a relative humidity of 50 ± 5%, and a temperature of 23 ± 2°C. The rats had unrestricted access to standard laboratory feed and water, provided in standard cages. Following a 7-day acclimation period, the rats were enrolled in the experimental study. The use and handling of experimental animals in this study adhered to the guidelines set by the Animal Protection Committee of Shandong University of Traditional Chinese Medicine (Approval Number: SDUTCM20230412003), ensuring compliance with experimental animal manipulation and animal welfare requirements.
Grouping and Drug Administration in Rats
Twenty-seven rats were randomly allocated into three groups (control, PTU model, and ZW; n=9/group) following the 3R principles (Reduce, Refine, Replace) and field-standard sample sizes (6–12/group) to ensure statistical power (α=0.05, 1-β=80%) while balancing biological variability control and ethical rigor. Following a 7-day acclimation period, rats in both the PTU model and ZW groups were administered 0.1% PTUvia gavage (prepared by dissolving 50 mg PTU tablets in 50 mL of pure water, dosed at body weight (g) × 0.01) for 4 weeks to induce a hypothyroidism model. Rats in the control group received an equal volume of purified water by gavage. Subsequently, hypothyroidism model-established rats were re-randomized into two groups via weight-stratified block randomization: the PTU model maintenance group and the ZW intervention group, ensuring balanced body weight distribution across cohorts. Rats in the ZW group underwent daily interventions with the traditional Chinese medicine at a dosage of 15.01 g/kg for 3 weeks.
Biochemical Index Detection
After the 4-week modeling period, blood samples were collected from the tail veins of the rats. Following the 3-week drug administration period, blood was drawn from the abdominal aorta of the rats. Serum was isolated by centrifuging the blood at 3000 r/min for 15 minutes at 4°C and subsequently stored in Eppendorf tubes at −80°C. The concentrations of FT4 and TSH were measured using ELISA kits, and the expression levels were compared.
Thyroid Pathological Section Examination
Rats were fasted for 24 hours before euthanasia but allowed free access to water. They were then anesthetized with isoflurane by inhalation. After anesthesia, the abdomen was opened to expose the thyroid, which was excised along with the trachea and rinsed with 0.9% sodium chloride solution. A portion of the excised thyroid tissue was fixed in 4% paraformaldehyde, embedded in paraffin, and sectioned into 5 μm thick longitudinal slices, which were then stained with hematoxylin and eosin. The pathological changes in the thyroid tissue were examined under a Nikon optical microscope (Tokyo, Japan).
Untargeted Metabolomics
Preparation of Serum Samples for Metabolomics
After thawing the serum samples at 4°C, they were vortexed for 1 minute to ensure uniform mixing. Subsequently, an appropriate amount of each sample was accurately dispensed into a 2 mL centrifuge tube, and 400 µL of methanol was added, followed by vortexing for another minute. The mixture was then centrifuged at 12,000 rpm for 10 minutes at 4°C. The entire supernatant was transferred to a new centrifuge tube and concentrated to dryness. The samples were then reconstituted in 150µL of 80% methanol aqueous solution containing 4 ppm of 2-chloro-L-phenylalanine. After filtering the supernatant through a 0.22 μm membrane, it was injected into a vial for LC-MS analysis.29
Chromatographic and Mass Spectrometric Conditions
Chromatographic Conditions: The analysis was carried out using a Thermo Vanquish Ultra-High-Performance Liquid Chromatography (UPLC) system (Thermo Fisher Scientific, USA) equipped with an ACQUITY UPLC® HSS T3 column (2.1×100 mm, 1.8 µm) (Waters, Milford, MA, USA). The flow rate was set to 0.3 mL/min, and the column temperature was maintained at 40°C. The injection volume was 2 μL. For positive ion mode, the mobile phases consisted of 0.1% formic acid in acetonitrile (B1) and 0.1% formic acid in water (A1), with the following gradient elution program: 0–1 min, 8% B1; 1–8 min, 8–98% B1; 8–10 min, 98% B1; 10–10.1 min, 98–8% B1; 10.1–12 min, 8% B1. For negative ion mode, the mobile phases were acetonitrile (B2) and 5 mM ammonium formate in water (A2), with the gradient elution program as follows: 0–1 min, 8% B2; 1–8 min, 8–98% B2; 8–10 min, 98% B2; 10–10.1 min, 98–8% B2; 10.1–12 min, 8% B2.30
Mass Spectrometric Conditions: The analysis was performed using a Thermo Orbitrap Exploris 120 mass spectrometer (Thermo Fisher Scientific, USA) with an electrospray ionization (ESI) source. Data were acquired in both positive and negative ion modes. The spray voltage was set to 3.50 kV for positive ions and −2.50 kV for negative ions. The sheath gas and auxiliary gas flows were adjusted to 40 arbitrary units (arb) and 10 arb, respectively. The capillary temperature was maintained at 325°C. Full scan mass spectrometry (MS) was conducted at a resolution of 60,000, covering a mass-to-charge ratio (m/z) range of 100–1000. Higher-energy collisional dissociation (HCD) was employed for tandem mass spectrometry (MS/MS) fragmentation with a collision energy of 30% and a resolution of 15,000. The top 4 ions were selected for fragmentation, and dynamic exclusion was applied to eliminate redundant MS/MS data.31
Data Preprocessing
The raw mass spectrometry data files were converted to mzXML format using the MSConvert tool in the Proteowizard software package (v3.0.8789).32 Peak detection, peak filtering, and peak alignment were performed using the R XCMS software package,33 with the following parameters: bw=2, ppm=15, peakwidth=c (5, 30), mzwid=0.015, mzdiff=0.01, and method=“centWave”. This process generated a quantitative list of metabolites. Systematic errors were corrected using support vector regression based on quality control (QC) samples. Only metabolites with a coefficient of variance (CV) less than 30% in the QC samples were retained for subsequent analysis.31
Screening of Differential Metabolites
The R package Ropls was employed to perform unsupervised principal component analysis (PCA) and supervised partial least squares discriminant analysis (PLS-DA) and orthogonal partial least squares discriminant analysis (OPLS-DA) for dimensionality reduction on the sample data.34 To prevent overfitting, permutation testing was employed to validate the models. The influence and explanatory power of each metabolite’s content on sample classification and discrimination were evaluated by calculating the P-value through statistical tests, determining the variable importance in projection (VIP) using the OPLS-DA dimensionality reduction method, and assessing the fold change to measure the differences between groups. These metrics aided in the screening of signature metabolites.
Identification of Differential Metabolites
Metabolite identification was conducted through search and comparison with spectral databases such as HMDB,35 massbank,36 LipidMaps,37 mzcloud,38 and KEGG.39 The parameter setting was ppm < 30 ppm to obtain qualitative metabolite results. Specifically, the molecular weight of each metabolite was determined from the mass-to-charge ratio (m/z) of the parent ion in the primary mass spectrum. Formula prediction was conducted using mass deviation (ppm) and adduct ion information, followed by database matching for initial identification of the metabolites. Furthermore, in the quantitative list, metabolites with detected secondary spectra were matched with fragment ions and additional information from the database to achieve secondary identification of the metabolites.40
Metabolic Pathway Analysis
MetaboAnalyst was used to perform functional pathway enrichment and topological analysis on the screened differential metabolites.41 With KEGG pathways as the research objects, Fisher’s exact test was conducted to analyze the significance of metabolite enrichment in each pathway (the smaller the P-value of the enrichment result (P < 0.05), the more statistically significant the enrichment of the KEGG pathway). In addition, we took into account the number of differential metabolites involved in the KEGG pathways to identify the metabolic and signal transduction pathways that were notably impacted.
Statistical Analysis
Statistical analyses were conducted using GraphPad Prism version 9. Data are expressed as the mean ± standard deviation (SD). Findings with p-values less than 0.05 and 0.01 were deemed statistically significant and highly statistically significant, respectively.
Results
Phenotypic Analysis of the Effects on Hypothyroidism Model
General Morphological Observation: During the modeling period, no rat deaths occurred, and the rats in the control group exhibited good mental status, agile movements, smooth and glossy fur, normal tail skin, pale pink coloration of the earlobes, nails, and claws, normal bowel movements, and natural growth in body weight. In contrast, the rats in the modeling group gradually developed a lethargic demeanor after PTU induction. They exhibited slower movements, a preference for huddling, often curled up with arched backs when captured, dry and dull fur that was prone to shedding, dry tail skin with easy desquamation observed on day 28, a whitish coloration of the earlobes, nails, and claws, dry feces, decreased urine output, and slow growth in body weight. Body weight, food and water intake, and rectal temperature are key phenotypic indicators often used to assess hypothyroidism. As illustrated in Figure 2A–D, by day 28 of the modeling process, the body mass (P<0.0001), rectal temperature (P<0.0001), food intake (P<0.01), and water intake (P<0.0001) were significantly reduced in the model group compared to the control group. This suggests the presence of metabolic disorders in hypothyroid rats, meeting the criteria for a hypothyroid rat model.
 |
Figure 2 Trends in body weight (A), anal temperature (B) and mean water (C)/food (D) intake during the modelling period in rats. Trends in body weight (E), anal temperature (F) and mean water (G)/food (H) intake during the dosing period in rats. Control group (K); Model group (M); ZW group (Z). Group K (n = 9), Group M (n = 9), and Group Z (n = 9). Note: **P<0.01,***P<0.0005,****P<0.0001. |
As shown in Figure 2E–H, after 21 days of oral administration of ZW, the body mass (P<0.0001), rectal temperature (P<0.001), food intake (P<0.0001), and water intake (P<0.0001) of rats in the ZW group were significantly higher than those in the model group. This indicates that ZW effectively alleviates the metabolic disorders observed in hypothyroid rats. Collectively, these findings suggest that ZW has a positive impact on improving the overall condition of hypothyroid model rats.
Assessment of Thyroid Function
After blood was collected from the tail vein of all rats on the 28th day of modelling and from the abdominal aorta of rats on the 21st day of drug administration, the serum was centrifuged at 4°C 3000 r/min for 15 min and separated to be used for the detection of thyroid function (FT4, TSH), and the results of the experiments are shown in Tables 1 and 2 which show that after 28 days of modelling, compared with the control group, the concentration of TSH in the modelling group was significantly higher (p<0. 01); and that the concentration of FT4 was significantly reduced (p < 0.05), indicating that the modelling group was in a hypothyroid state and that modelling was successful.42–45 After 21 days of administration, compared with the Blank group, the Model group exhibited a significant increase in TSH concentration (p < 0.0001) and a significant decrease in FT4 concentration (p < 0.0001). Compared to the Model group, the ZW group demonstrated a significant reduction in TSH levels (p < 0.0001) and a significant elevation in FT4 levels (p < 0.0001). Furthermore, no significant difference in TSH concentration was observed between the ZW group and the Blank group, whereas FT4 levels in the ZW group showed a statistically significant difference (p < 0.001), with values intermediate between the Blank and Model groups. These results suggest that ZW partially restores thyroid function in hypothyroidism model rats.
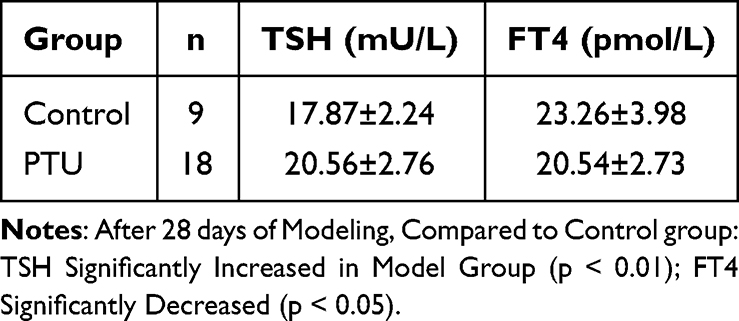 |
Table 1 Changes in Rat Thyroid Function Indices on Day 28 of Modeling ( |

 |
Table 2 Changes in Thyroid Metabolic Indices on Day 21 of Drug Administration ( |

Histopathological Examination of the Thyroid Gland
The histopathological findings of the thyroid gland are shown in Figure 3A–C. The thyroid tissue of normal control rats contained follicles of various sizes, mostly round and oval in shape, the follicular epithelium was in the form of a single layer of cuboid, the follicular lumen was filled with hyaline colloid without vacuoles, and there was connective tissue and capillaries in the interfollicular space, without inflammatory cell infiltration, necrosis and other changes. Compared with the control group, rats in the model group had diffuse nodular hyperplasia of thyroid tissue, reduced follicles, reduced or absent colloid in the follicular cavity, and there were mostly congestive and haemorrhagic changes in the interfollicular space. Compared with the model group, the thyroid follicles of the rats in the ZW group were increased, with different sizes and shapes, and foci of small cell follicular hyperplasia of the glands were seen, with gliosis in the cavities of some of the follicles, and a small amount of inter-follicular congestion and haemorrhagic changes. This indicates that ZW can effectively restore the histopathological state of the thyroid gland in hypothyroid model rats.
 |
Figure 3 Histological examination of thyroid gland (H-E) staining; control group (A); model group (B); ZW group (C). Magnification: 20×. |
Non-Targeted Metabolomics Analysis
Data Verification
To identify biomarkers, the relative standard deviation (RSD), or coefficient of variation, of potential feature peaks in quality control (QC) samples should be less than 30%. Peaks that do not meet this criterion should be excluded. Consequently, quality assurance (QA) procedures are typically implemented to eliminate features with poor reproducibility in QC samples.46 As shown in Figure 4A and B, the experimental sample data of the three groups are of high quality.
 |
Figure 4 Illustrates the following: The left vertical axis denotes the proportion, whereas the right vertical axis indicates the specific quantity. The horizontal axis spans the range of RSD values. Notably, approximately 65% of the characteristic peaks in QC samples exhibit an RSD below 30%, suggesting satisfactory data quality. (A) depicts the positive ion mode, and (B) depicts the negative ion mode. Sample size per group n=9. |
Results of Multivariate Statistical Analyses
Principal Component Analysis PCA and PLS-DA Analysis of Metabolites
To evaluate the metabolic profile, PCA was performed on serum samples from different groups and the results were as follows: the R2X in positive and negative ion mode were 0.540 and 0.553 for the control and model groups respectively, and 0.531 and 0.543 for the model and ZW groups, indicating that the model was of good quality and provided accurate prediction. The PCA scores depicted in Figure 5A–D illustrate the distinction between the blank group and the model group. A notable difference was observed between the model group and the ZW group, with inter-group variations exceeding intra-group sample differences. This suggests that the metabolic profiles of hypothyroid rats have been modified. Following this, Partial Least Squares Discriminant Analysis (PLS-DA) was conducted, with the findings displayed in Figure 5a–h. The R2Y and Q2 values for the blank and model groups were 0.997 and 0.830 in positive ion mode, and 0.995 and 0.835 in negative ion mode. For the model and ZW groups, the R2Y and Q2 values were 0.994 and 0.797 in positive ion mode, and 0.9953 and 0.859 in negative ion mode. These values indicate that the metabolic characteristics of hypothyroid rats did not change significantly. The high Q2 values also suggest that there was no overfitting, demonstrating that the model had strong predictive ability and robustness.
 |
Figure 5 Presents the differentiation of serum metabolic profiles in rats. (A–D) display the score plots of PCA in negative and positive ion modes, respectively. Additionally, (4a–h) show the scoring plots and substitution test plots of PLS-DA for the control (K), model (M), and ZW (Z) groups (n = 9) in both negative and positive ion mode. |
Screening and Identification of Potential Biomarkers
To identify differential metabolites, Orthogonal Partial Least Squares Discriminant Analysis (OPLS-DA) was conducted to detect significant changes in ion levels between the control and model groups, as well as between the model and ZW groups (eg, Figure 6). In both positive and negative ion modes, the sample points showed clear separation and good aggregation within groups. To ensure the model’s robustness and prevent overfitting, a random permutation test was performed for each group. The R2Y (explanation rate, indicating the model’s goodness of fit) and Q2 (prediction rate, indicating the model’s predictive ability) values were as follows: for the model group versus the blank group, the values were 0.997 and 0.995 in positive ion mode, and 0.808 and 0.841 in negative ion mode; for the ZW group versus the model group, the values were 0.994 and 0.994 in positive ion mode, and 0.995 and 0.808 in negative ion mode; for the ZW group versus the model group, the values were 0.994 and 0.993 in positive ion mode, and 0.761 and 0.827 in negative ion mode. These values indicate that the models for each group had high explanatory and predictive power, good fit, and reliability, making them suitable for differential metabolite screening.
 |
Figure 6 (A–D) shows the OPLS-DA PCA score plot, (E–H) shows the OPLS-DA substitution test plot, and (a–d) shows the OPLS-DA S plot, where Figure ACEGac is in positive ion mode and Figure BDFHbd is in negative ion mode for the control (K), model (M), and ZW (Z) groups. |
S-plot analyses based on the OPLS-DA model data were used to assess the contribution of metabolites. In this study, variable ions with Variable Importance in Projection (VIP) values >1 and p-values <0.05 from independent sample Student’s t-tests were identified as potential biomarkers responsible for differentiating the two groups. Using these criteria, variable ions in the control group were first compared against the model group, and then the ZW group was compared against the model group. The results were as follows: Positive Ion Mode: Normal group vs model group: 4023 variable ions were identified, with 1813 up-regulated and 2210 down-regulated. Model group vs ZW group: 3536 variable ions were identified, with 2097 up-regulated and 1439 down-regulated. Negative Ion Mode: Normal group vs model group: 2451 variables ions were identified, with 1312 up-regulated and 1139 down-regulated. Model group vs ZW group: 2100 variable ions were identified, with 1013 up-regulated and 1087 down-regulated. The structures of these potential biomarkers were determined by comparing their high-resolution MS data and MS/MS fragments with the biomarkers in the Access database, as detailed in the Materials and Methods section. Finally, the blank group was found to have 105 differential metabolites compared to the model group, with 51 up-regulated and 54 down-regulated. These metabolites mainly included amino acids and proteins (20%), nucleic acids (10%), carboxylic acids and their derivatives (15%), saccharides and related compounds (10%), and hormones and steroids (15%), all of which showed significant changes in their concentrations. Among these, the serum concentrations of 47 metabolites were observed to return to levels similar to those of the normal group following treatment with ZW (see Table 3). To analyze the secondary differential metabolite matrix data, the R Pheatmap package was utilized for data normalization (Scale). This process involved bidirectional clustering of both the samples and the differential metabolites, resulting in a clustering heatmap that illustrates the quantitative differences in differential metabolites between the two groups (Figure 7) and the overall metabolite quantitative values between the different subgroups and samples could be visualised by the Z-score trends (as shown in Figure 8) and the degree of differences. Metabolite volcano plots were drawn using the preset differential metabolite screening conditions of FC value, P value and VIP to show the distribution of differential metabolites and the trend of changes between the two groups of samples (as shown in Figure 9). It is known that 4-phenylbutyrate 4, epsilon-caprolactam, homatropin, kynurenic acid and 2-hydroxy-6-pentadecylbenzoic acid can be used as potential biomarkers of hypothyroidism, and 4-phenylbutyrate 4, dCMPL-prolineL-, etc. can serve as significant potential biomarkers of hypothyroidism treated with ZW. This indicates that the metabolic disorders were largely corrected by the ZW decoction, which may contribute to its therapeutic effects.
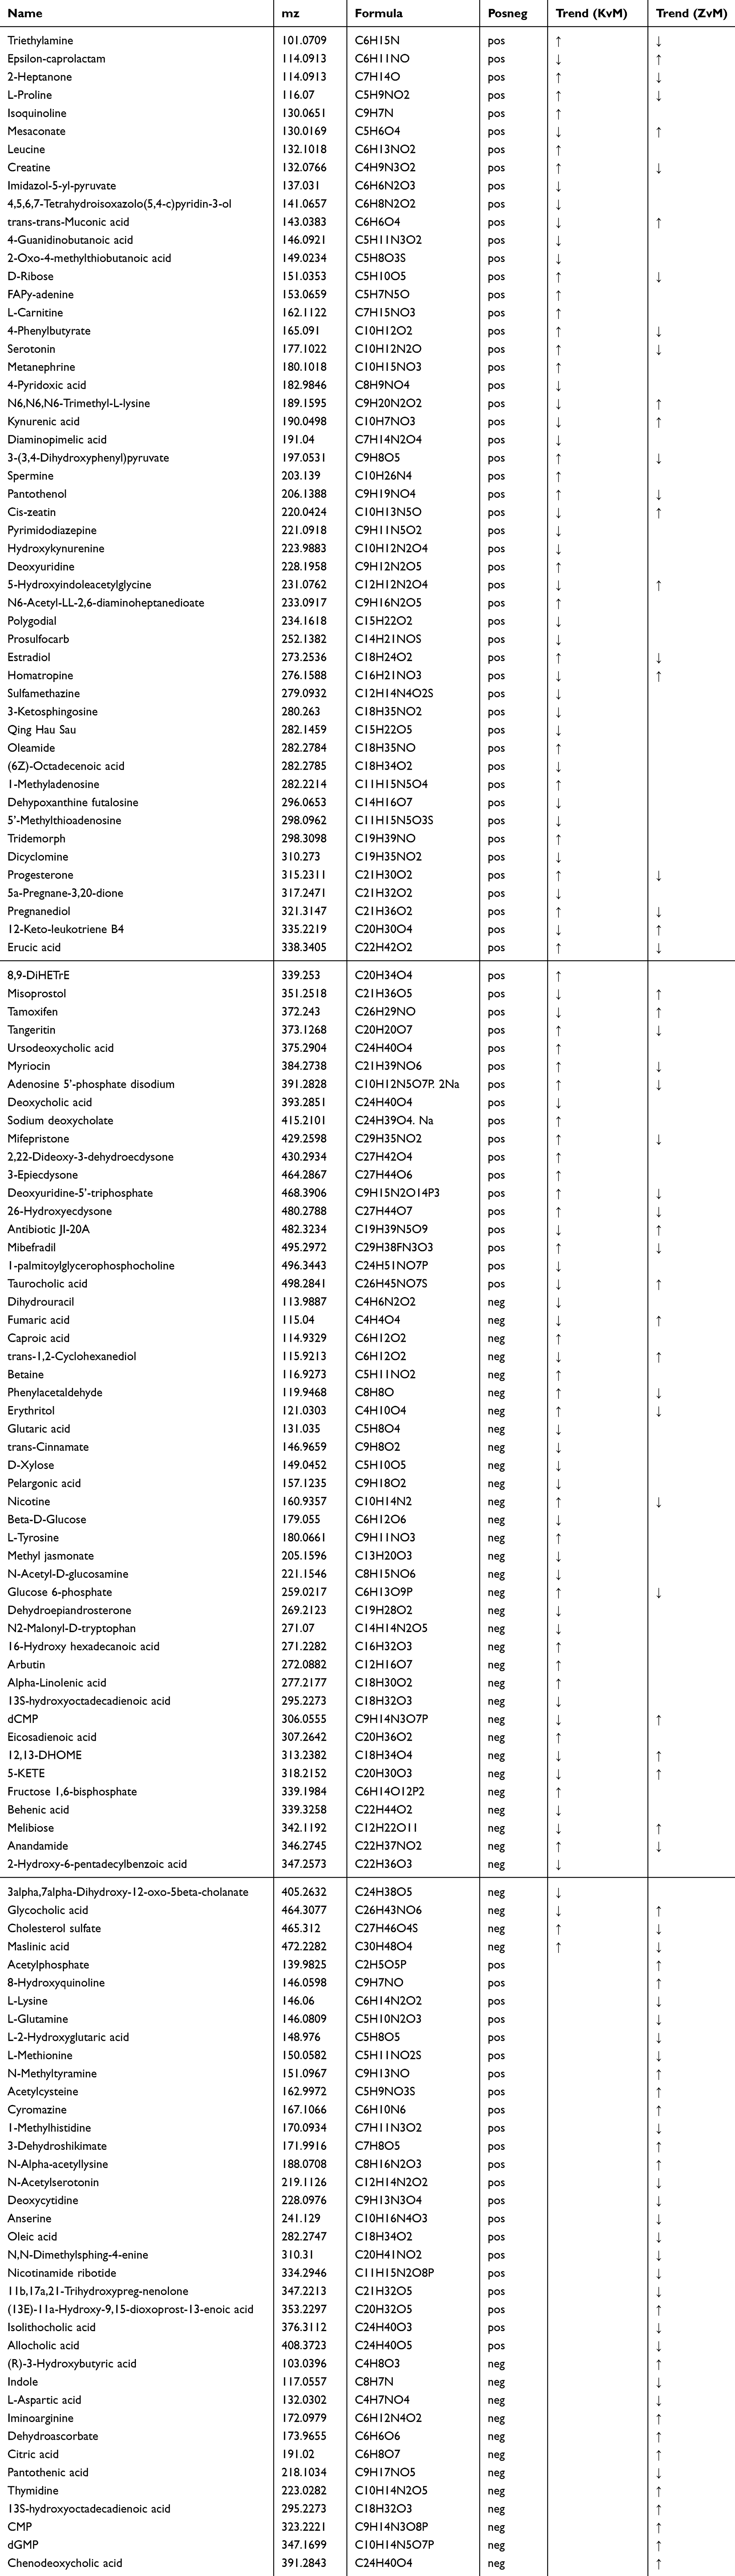 |
Table 3 |
 |
Figure 7 Displays a clustering heat map that illustrates the differential metabolites among various groups. Specifically, (A) compares the control group to the model group, while (B) contrasts the model group with the ZW group. The groups represented are: the control group (C), the model group (M), and the ZW group (Z). |
 |
Figure 8 Horizontal coordinates are the converted Z-score values for the relative amounts of metabolites in the samples. Control Group vs Model Group (A); Model Group vs ZW Group (B). Control group (K); Model group (M); ZW group (Z). |
 |
Figure 9 Differential metabolite volcano plots. Control group vs model group (A); model group vs ZW group (B). |
Analysis of Serum Biomarker Related Pathways
MetaboAnalyst (www.metaboanalyst.ca) was utilized to conduct KEGG pathway enrichment analysis on the list of differential metabolites. To elucidate the therapeutic mechanism of ZW, KEGG enrichment analysis was employed to investigate the metabolic and signaling pathways associated with these differential metabolites. Based on a threshold of P < 0.05, among the 8 pathways identified in the blank group compared to the model group, they were prolactin signalling pathway, breast cancer, prostate cancer, thermogenesis, central carbon metabolism in cancer, pathways in cancer, cholesterol metabolism, ovarian steroidogenesis, where the annotated differential metabolites were mainly estradiol, progesterone, L-tyrosine, glucose-6-phosphate, dehydrogenase and dehydroepoxide, phosphate, dehydroepiandrosterone, etc, suggesting that the above pathway may be the pathogenesis of hypothyroidism. As illustrated in Figures 10–12, when compared to the model group, the KEGG pathways significantly enriched with differential metabolites in the ZW group included central carbon metabolism in cancer, protein digestion and absorption, breast cancer, prolactin signaling pathway, alanine, aspartate and glutamate metabolism, pyrimidine metabolism, aminoacyl-tRNA biosynthesis, thermogenesis, cholesterol metabolism, and 16 additional pathways, of which the annotated differential metabolites were mainly L-glutamine, L-aspartic acid, estradiol, L-methionine, fumaric acid, L-proline, progesterone, 6-phosphate glucose, etc.
 |
Figure 10 Scatter plot of factors influencing the metabolic pathway. Control group compared to model group (A); model group compared to ZW group (B). |
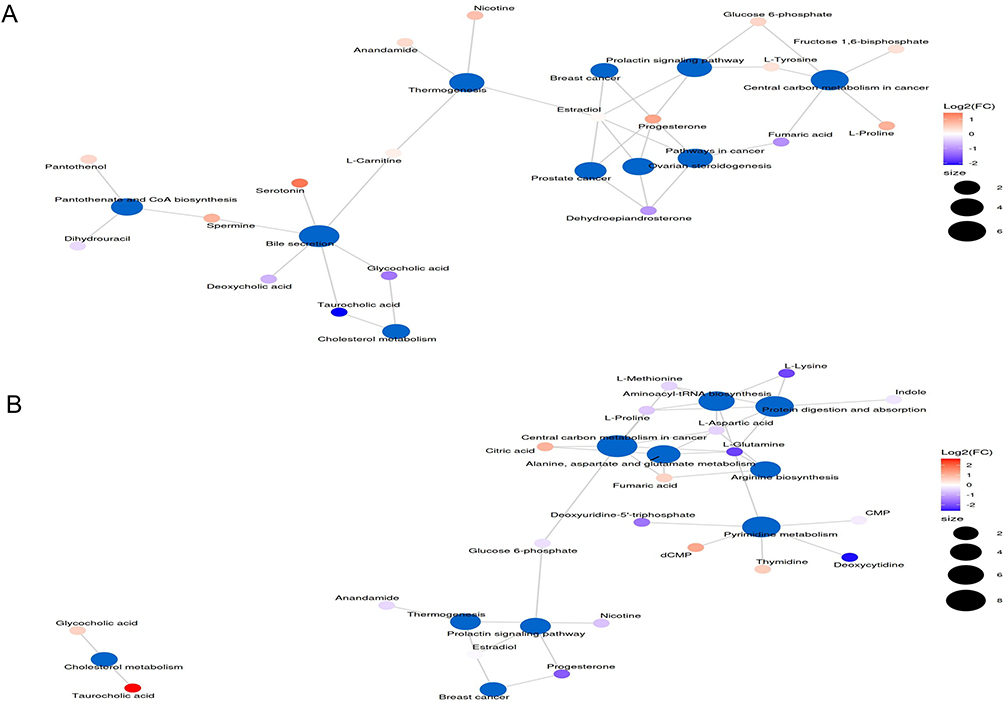 |
Figure 11 Metabolic pathway network diagram. Control group compared to model group (A); model group compared to ZW group (B). |
 |
Figure 12 Differential Enrichment Score plot (DAS plot for pathway analysis). Control group compared to model group (A); model group compared to ZW group (B). |
The pathways commonly identified between the blank and model groups, as well as between the model and ZW groups, include breast cancer, prostate cancer, central carbon metabolism in cancer, general cancer pathways, cholesterol metabolism, prolactin signaling pathway, and thermogenesis. In central carbon metabolism in cancer, glucose 6-phosphate and L-proline were upregulated in KvsM and downregulated in ZvsM, fumaric acid was downregulated in KvsM and upregulated in ZvsM. In the prolactin signalling pathway glucose-6-phosphate, estradiol and progesterone were upregulated in KvsM and downregulated in ZvsM. Estradiol and progesterone were upregulated in KvsM and downregulated in ZvsM in Breast cancer and Prostate cancer, and Estradiol and progesterone were upregulated in KvsM and downregulated in ZvsM in Pathways in cancer; fumaric acid was downregulated in KvsM and upregulated in ZvsM. In thermogenesis, nicotine, estradiol and anandamide were upregulated in KvsM and downregulated in ZvsM. In cholesterol metabolism, glycocholic acid and taurocholic acid were downregulated in KvsM and upregulated in ZvsM. The findings indicated that ZW can effectively manage hypothyroidism in rats by modulating nine specific metabolites via seven distinct pathways.
Discussion
The key treatment approach for hypothyroidism is thyroid hormone replacement therapy due to its effectiveness. However, this approach primarily focuses on the thyroid gland itself, potentially overlooking the disease complexity, organismal integrity, and side effects. In contrast, Traditional Chinese Medicine (TCM) adopts a systemic perspective, viewing the human body as an integrated entity and adjusting it to restore homeostasis.47 Despite over a century of clinical use, the precise efficacy and mechanisms of ZW—a classical Chinese herbal formula—remain underexplored, particularly from a metabolomics perspective. Metabolomics, as an emerging strategy analyzing metabolite profile differences, offers a novel approach to decipher the targets and holistic mechanisms of TCM prescriptions, aligning with its systemic philosophy.48
In this study, ZW alleviated hypothyroidism in rats, exemplifying TCM’s multi-target efficacy. The model group exhibited hypothyroid features, including alopecia, reduced activity, decreased water intake (P < 0.0001), diminished food intake (P < 0.01), weight loss (P < 0.0001), lowered rectal temperature (P< 0.001), reduced serum FT4 (P < 0.0001), elevated TSH (P < 0.0001), and thyroid histopathological damage. ZW treatment reversed these effects, significantly improving water/food intake (both P < 0.0001), weight gain (P < 0.0001), rectal temperature (P < 0.001), FT4 levels (P < 0.0001), TSH reduction (P < 0.0001), and thyroid morphology. Slight weight loss or due to reduced growth-stimulating effects of thyroid hormones and PTU-induced loss of appetite.28 Studies show that ZW significantly regulates key metabolites such as glucose-6-phosphate (G6P), L-proline and fumaric acid in the central carbon metabolism pathway in cancer. In hypothyroidism, the secretion of thyroid hormones is reduced, the body’s metabolic rate is lowered and energy expenditure is reduced. It has been shown that hypothyroidism leads to an increase in glucose-6-phosphate dehydrogenase (G6PD) activity, which accelerates the conversion of G6P to gluconolactone 6-phosphate, driving the pentose phosphate pathway and possibly reducing the amount of ATP generated by the glycolytic pathway.49 ZW may improve energy metabolism in hypothyroidism by down-regulating G6P. L-proline, as a key amino acid, is positively regulated by hepatic thyroid hormones and shows an upward trend in hyperthyroidism.50,51 In this study, ZW effectively regulated the level of L-proline, revealing its potential mechanism in the regulation of thyroid function and providing a new perspective for drug development. Although fumaric acid does not directly regulate thyroid hormones, it may indirectly improve the energy balance of patients with hypothyroidism, alleviate the oxidative stress and inflammatory response through the regulation of energy metabolism, antioxidant, anti-inflammatory and immunoregulatory functions, and have an impact on the condition and therapeutic effect. The increased levels of fumaric acid in ZW highlight its broad-ranging effects in managing hypothyroidism. Furthermore, ZW demonstrated a modulatory effect on the prolactin signaling pathway, as well as pathways associated with prostate cancer, breast cancer, and general cancer processes. It can influence the metabolism of progesterone, estradiol, and fumaric acid, all of which are intricately linked to the development and therapeutic outcomes of hypothyroidism. Estradiol in particular is significantly elevated in patients with hypothyroidism.52 ZW may be therapeutic by down-regulating estradiol levels. Studies have shown that progesterone and estradiol levels are elevated in hypothyroid rats, and progesterone increases the degree of tumourigenesis in hypothyroid animals,53,54 and ZW can intervene in hypothyroidism by down-regulating progesterone and estradiol. The regulatory role of ZW in the thermogenesis pathway and the cholesterol metabolism pathway is equally important. In thermogenesis, the study of nicotine on thyroid function showed that thyroid function was restored after nicotine withdrawal in primary hypothyroidism,55 and anandamide reduced TSH levels,56 ZW down-regulated nicotine and anandamide, which significantly affected the metabolic status in rats and treated hypothyroidism,57 Glycocholic acid, as a natural secondary bile acid, originates from cholesterol synthesis in the liver and combines with glycine to form a conjugated bile acid, which is involved in the process of fat emulsification and then promotes the digestion and absorption of fats. Similarly, taurocholic acid plays a similar role in the intestine, contributing to fat digestion and absorption.58,59 The present study tentatively shows that ZW may improve cholesterol metabolism in patients with hypothyroidism by upregulating the levels of glycocholic acid and taurocholic acid, which in turn helps to maintain the balance of cholesterol metabolism in the human body. This discovery offers a novel concept for the treatment of hyperlipidaemia resulting from hypothyroidism, but further in-depth investigations are necessary to validate its efficacy and mechanism of action.
ZW, a multi-component TCM formula, exhibits clinical efficacy through complex herb-component interactions, yet this compositional complexity hinders precise identification of bioactive constituents responsible for clinical effects (Component Complexity). Current TCM research predominantly focuses on single-herb analysis, with limited systematic studies on compound formulas—particularly in elucidating ZW’s pharmacological mechanisms. Existing component quantification efforts remain restricted to detectable species, underscoring the need for enhanced whole-formula investigations (Research Limitations). Furthermore, herb synergism complicates analysis: despite advanced metabolomics enabling high-throughput detection, technical barriers persist in decoding multi-component networks and holistically characterizing the “multi-component, multi-target, multi-pathway” mechanisms, necessitating methodological innovations (Synergistic Challenges).17,60
In conclusion, ZW demonstrated a modulatory effect on the metabolic state of rats through regulating the levels of these metabolites. Nevertheless, there are relatively few investigations on these mechanisms of action, and further experimental verification and in-depth studies are required to clarify the specific function of ZW in metabolic regulation and its mechanisms.
Conclusions
This study established a model of hypothyroidism by PTU gavage, and comprehensively validated the model validity and therapeutic efficacy of Zhenwu Decoction (ZW) by phenotypic indices, serum FT4/TSH levels, and thyroid histopathology. Metabolomic profiling identified seven dysregulated pathways critical for hypothyroidism pathophysiology, including energy metabolism (glucose-6-phosphate), TCA cycle (fumaric acid), amino acid homeostasis (L-proline), hormone regulation (estradiol/progesterone), neuroendocrine modulation (nicotine), and lipid metabolism (glycocholic/taurocholic acids). ZW demonstrated multi-target regulatory effects by normalizing these biomarkers, providing novel mechanistic insights into TCM-based metabolic interventions.
While the multi-component synergy of ZW underpins its therapeutic potential, complex herb-herb interactions and methodological limitations in metabolomics analysis limit precise identification of active constituents and full mechanism elucidation. Although this preclinical study highlights the metabolic regulatory capacity of ZW, translational applications require clinical validation. Nevertheless, these findings provide a solid scientific foundation for the development of precision therapies targeting hypothyroidism-associated metabolic dysregulation.
Ethics Statement
The animal study was reviewed and approved by the Experimental Animal Ethics Committee of Shandong University of Chinese Medicine (SDUTCM20230412003). Clinical trial number: not applicable.
Funding
This work was supported by the Youth Program of the Natural Science Foundation of Shandong province (ZR2023QH006).
Disclosure
The authors declare that the research was conducted in the absence of any commercial or financial relationships that could be construed as a potential conflict of interest.
References
1. Mohammad MY, Bushulaybi NA, AlHumam AS, et al. Prevalence of depression among hypothyroid patients attending the primary healthcare and endocrine clinics of King Fahad Hospital of the University (KFHU). J Family Med Prim Care. 2019;8(8):2708–2713. doi:10.4103/jfmpc.jfmpc_456_19
2. McLachlan SM, Rapoport B. Thyroid peroxidase as an autoantigen. Thyroid. 2007;17(10):939–948. doi:10.1089/thy.2007.0169
3. Kaçmaz M, Atmaca M, Arslan A, Demir H, Özbay MF. Oxidative stress in patients with thyroidectomy and thyroparathyroidectomy under replacement therapy. Endocrine. 2015;48(1):227–232. doi:10.1007/s12020-014-0270-6
4. Ates I, Arikan MF, Altay M, et al. The effect of oxidative stress on the progression of Hashimoto’s thyroiditis. Arch Physiol Biochem. 2018;124(4):351–356. doi:10.1080/13813455.2017.1408660
5. Chaker L, Razvi S, Bensenor IM, et al. Hypothyroidism. Nat Rev Dis Primers. 2022;8(1):30. doi:10.1038/s41572-022-00357-7
6. Xue J, Li C, Ju J, Liang S. Association of insulin-like growth factor 1 and metabolic parameters with mild subclinical hypothyroidism in obese boys. Sci Rep. 2025;15:17017. doi:10.1038/s41598-025-02084-x
7. Yin H, Wang X, Wang Z, et al. Mendelian randomisation to investigate the causal relationship between ulcerative colitis and the risk of hypothyroidism. J Pract Med. 2024;40(6):827–832.
8. Luo X, Chi H. Diagnosis and treatment of infertility associated with hypothyroidism. Chin J Pract Gynecol Obstet. 2024;40(6):596–600.
9. Li L, Sheng Q, Zeng H, et al. Engineering a functional thyroid as a potential therapeutic substitute for hypothyroidism treatment: a systematic review. Front Endocrinol. 2022;13:1065410. doi:10.3389/fendo.2022.1065410
10. Jiang YC, Li YF, Zhou L, Zhang DP. Comparative metabolomics unveils molecular changes and metabolic networks of syringin against hepatitis B mice by untargeted mass spectrometry. RSC Adv. 2020;10(1):461–473. doi:10.1039/C9RA08735A
11. Sun H, Yang L, Li MX, et al. UPLC-G2Si-HDMS untargeted metabolomics for identification of metabolic targets of Yin-Chen-Hao-Tang used as a therapeutic agent of dampness-heat jaundice syndrome. J Chromatogr B Analyt Technol Biomed Life Sci. 2018;1081–1082:41–50. doi:10.1016/j.jchromb.2018.02.035
12. Zhu YJ, Chen ZT, Fu XX, Xie CG. Therapeutic efficacy and pharmacological mechanisms of warming and tonifying the spleen and kidney method in treating hypothyroidism: a review. Pharmacol Clin Chin Mater Med. 2024. doi:10.13412/j.cnki.zyy1.20240508.002
13. Chen Y, Zhong D, Chen D, et al. Observations on the treatment of hypothyroidism with Chinese medicine Zhenwu decoction. Chin Med Clin Res. 2019;11(36):3–4.
14. Peng M. 3 new clinical applications of Zhenwu decoction. J Chin Med Literature. 2018;36(5):53–55.
15. Yang C, Zheng G, Qi J, et al. Clinical effect of adding flavor Zhenwu decoction in the treatment of heart and kidney yang deficiency type hypothyroidism heart disease. China J Chin Med Herald. 2020;17(21):161–164.
16. Zheng MH, Guo D. Research progress on active components and mechanisms of Zhenwu Decoction in treating chronic heart failure. Chin J Tradit Chin Med Pharm. 2024;39(11):6007–6011.
17. Chen KL, Zhang LQ, Xiao CB, et al. Research progress on Zhenwu decoction and active components of individual herbs in chronic kidney disease. Chin J Tradit Chin Med Pharm. 2025.
18. Tian P, Ma K, Liang RF, et al. Chemical composition analysis of Zhenwu decoction using UPLC-Q-Orbitrap HRMS. Chin J Chin Mater Med. 2022;45(5):1134–1142. doi:10.13863/j.issn1001-4454.2022.05.021
19. Wu YJ, Zhang XX, Zheng PF, et al. Establishment and evaluation of a rat model of chronic kidney disease with renal Yang deficiency induced by Adriamycin combined with tabazole and study of the intervention effect of Zhenwu decoction. World Sci Technol Mod Tradit Chin Med. 2021;11:3878–3886.
20. Xiao H, Tan C, Yang G, Dou D. The effect of red ginseng and ginseng leaves on the substance and energy metabolism in hypothyroidism rats. J Ginseng Res. 2017;41(4):556–565. doi:10.1016/j.jgr.2016.11.005
21. Su X, Peng H, Chen X, Wu X, Wang B. Hyperlipidemia and hypothyroidism. Clin Chim Acta. 2022;527:61–70. doi:10.1016/j.cca.2022.01.006
22. Han L, Yang X, Wang W, et al. Cord blood metabolomics reveals gestational metabolic disorder associated with anti-thyroid peroxidase antibodies positivity. BMC Pregnancy Childbirth. 2022;22(1):244. doi:10.1186/s12884-022-04564-8
23. Chen J, Ye C, Yang Z, et al. Erchen decoction to reduce oxidative stress in dyslipidemia phlegm-dampness retention syndrome mice: in vivo mechanism revealed by metabolomics (liquid chromatography–mass spectrometry). Phytomedicine. 2023;115:154808. doi:10.1016/j.phymed.2023.154808
24. Cheng X, Xu T, Pi Z, et al. A wide-targeted urinary and serum metabolomics strategy reveals the effective substance of the Wu-tou decoction. J Sep Sci. 2020;43(4):727–735. doi:10.1002/jssc.201900678
25. Liu XY, Zhang A-H, Fang H, et al. Serum metabolomics strategy for understanding the therapeutic effects of Yin-Chen-Hao-decoction against Yanghuang syndrome. RSC Adv. 2018;8(14):7403–7413. doi:10.1039/C7RA11048K
26. Han X, Xiao H, Chen J, et al. The substance basis of Poria ameliorates hypothyroidism other than hyperthyroidism based on proteomics and metabolomics. FASEB J. 2020;34(9):11970–11982. doi:10.1096/fj.202000984R
27. Dawood HM, Barghouth NM, El-Mezayen NS, et al. Metabolomic insights into the therapeutic mechanisms of costus (Saussurea costus (Falc.) Lipsch.) root extract in propylthiouracil-induced hypothyroidism rat model. J Ethnopharmacol. 2024;324:117784. doi:10.1016/j.jep.2024.117784
28. Su X, Gao C, Chen M, et al. Historical tracing and investigation of Zhenwu decoction, an ancient classical formula. Chin J Exp Formulas. 2023;29(20):9–19.
29. Demurtas A, Pescina S, Nicoli S, et al. Validation of a HPLC-UV method for the quantification of budesonide in skin layers. J Chromatogr B Analyt Technol Biomed Life Sci. 2020;1164:122512. doi:10.1016/j.jchromb.2020.122512
30. Zelena E, Dunn WB, Broadhurst D, et al. Development of a Robust and repeatable UPLC-MS method for the long-term metabolomic study of human serum. Anal Chem. 2009;81(4):1357–1364. doi:10.1021/ac8019366
31. Want EJ, Masson P, Michopoulos F, et al. Global metabolic profiling of animal and human tissues via UPLC-MS. Nat Protoc. 2013;8(1):17–32. doi:10.1038/nprot.2012.135
32. Rasmussen JA, Villumsen KR, Ernst M, et al. A multi-omics approach unravels metagenomic and metabolic alterations of a probiotic and synbiotic additive in rainbow trout (Oncorhynchus mykiss). Microbiome. 2022;10(1):21. doi:10.1186/s40168-021-01221-8
33. Navarro-Reig M, Jaumot J, García-Reiriz A, et al. Evaluation of changes induced in rice metabolome by Cd and Cu exposure using LC-MS with XCMS and MCR-ALS data analysis strategies. Anal Bioanal Chem. 2015;407(29):8835–8847. doi:10.1007/s00216-015-9042-2
34. Thévenot EA, Roux A, Xu Y, et al. Analysis of the human adult urinary metabolome variations with age, body mass index, and gender by implementing a comprehensive workflow for univariate and OPLS statistical analyses. J Proteome Res. 2015;14(8):3322–3335. doi:10.1021/acs.jproteome.5b00354
35. Wishart DS, Dan T, Knox C, et al. HMDB: the human metabolome database. Nucleic Acids Res. 2007;35(Database issue):D521–D526. doi:10.1093/nar/gkm871
36. Horai H, Arita M, Kanaya S, et al. MassBank: a public repository for sharing mass spectral data for life sciences. J Mass Spectrom. 2010;45(7):703–714. doi:10.1002/jms.1777
37. Manish S, Eoin F, Dawn C, et al. LMSD: LIPID MAPS structure database. Nucleic Acids Res. 2007;35(Database issue):D527–D532. doi:10.1093/nar/gkl838
38. Abdelrazig S, Safo L, Rance GA, et al. Metabolic characterisation of Magnetospirillum gryphiswaldense MSR-1 using LC-MS-based metabolite profiling. RSC Adv. 2020;10(54):32548–32560. doi:10.1039/d0ra05326k
39. Ogata H, Goto S, Sato K, et al. KEGG: Kyoto Encyclopedia of Genes and Genomes. Nucleic Acids Res. 1999;27(1):29–34. doi:10.1093/nar/27.1.29
40. Kieffer DA, Piccolo BD, Vaziri ND, et al. Resistant starch alters gut microbiome and metabolomic profiles concurrent with amelioration of chronic kidney disease in rats. Am J Physiol Renal Physiol. 2016;310(9):F857–F871. doi:10.1152/ajprenal.00513.2015
41. Xia J, Wishart DS. Web-based inference of biological patterns, functions and pathways from metabolomic data using MetaboAnalyst. Nat Protoc. 2011;6(6):743–760. doi:10.1038/nprot.2011.319
42. Lu Z, Zhong N. Internal Medicine.
43. Chen WB, Pan XL. Diagnostics.
44. Jansen H, Dirks N, Hillebrand J, et al. Age-specific reference intervals for TSH and FT4 to optimize diagnosis of thyroid disease. Endocr Abstr. 2024;99.
45. Schneider C, Feller M, Bauer DC, et al. Initial evaluation of thyroid dysfunction—are simultaneous TSH and fT4 tests necessary? PLoS One. 2018;13(4):e0196631. doi:10.1371/journal.pone.0196631
46. Dunn WB, Broadhurst D, Begley P, et al. Procedures for large-scale metabolic profiling of serum and plasma using gas chromatography and liquid chromatography coupled to mass spectrometry. Nat Protoc. 2011;6(7):1060–1083. doi:10.1038/nprot.2011.335
47. Wu S, Tan G, Dong X, et al. Metabolic profiling provides a system understanding of hypothyroidism in rats and its application. PLoS One. 2013;8(2):e55599. doi:10.1371/journal.pone.0055599
48. Zhai Y, Xu J, Feng L, et al. Broad range metabolomics coupled with network analysis for explaining possible mechanisms of Er-Zhi-Wan in treating liver-kidney Yin deficiency syndrome of Traditional Chinese Medicine. J Ethnopharmacol. 2019;234:57–66. doi:10.1016/j.jep.2019.01.019
49. Carvalho SD, Negrao N, Bianco AC. Hormonal regulation of malic enzyme and glucose-6-phosphate dehydrogenase in brown adipose tissue. Am J Physiol Endocrinol Metab. 1993;264(6):E874–E881. doi:10.1152/ajpendo.1993.264.6.E874
50. Rodríguez-Gómez I, Moliz JN, Quesada A, et al. L-Arginine metabolism in cardiovascular and renal tissue from hyper- and hypothyroid rats. Exp Biol Med. 2016;241(5):550–556. doi:10.1177/1535370215619042
51. Xia H. Combined Biomarkers for Screening Abnormal Thyroid Function and Benign and Malignant Thyroid Nodules by Combined Multi-omics Analysis [dissertation]. Hangzhou: Zhejiang University; 2022.
52. Cheng YH, Han ME, Jia XB, et al. Study on the correlation between peripheral blood leukocyte differentiation Antigen 195, Estradiol Level, and Hashimoto’s Thyroiditis. Shaanxi Med J. 2020;49:1461–1464.
53. Jabara AG, Maritz JS. Effects of hypothyroidism and progesterone on mammary tumours induced by 7,12-dimethylbenz (a) anthracene in Sprague-Dawley rats. Br J Cancer. 1973;28(2):161–172. doi:10.1038/bjc.1973.133
54. Hapon MB, Jahn GA, Gimeno MF. Effect of hypothyroidism on hormone profiles in virgin, pregnant, and lactating rats, and on lactation. Reproduction. 2003;126(3):371–382. doi:10.1530/rep.0.1260371
55. de Oliveira E, de Moura EG, Santos-Silva AP, et al. Neonatal hypothyroidism caused by maternal nicotine exposure is reversed by higher T3 transfer by milk after nicotine withdrawal. Food Chem Toxicol. 2011;49(9):2068–2073. doi:10.1016/j.fct.2011.04.040
56. Da Veiga MA, Fonseca Bloise F, Costa-e-Sousa RH, et al. Acute effects of endocannabinoid anandamide and CB1 receptor antagonist, AM251 on the regulation of thyrotropin secretion. J Endocrinol. 2008;199(2):235–242. doi:10.1677/JOE-08-0380
57. Neggazi S, Hamlat N, Berdja S, et al. Hypothyroidism increases angiotensinogen gene expression associated with vascular smooth muscle cells cholesterol metabolism dysfunction and aorta remodeling in Psammomys obesus. Sci Rep. 2023;13(1):19681. doi:10.1038/s41598-023-46899-y
58. Matsuoka K, Maeda M, Moroi Y. Micelle formation of sodium glyco-and taurocholates and sodium glyco-and taurodeoxycholates and solubilization of cholesterol into their micelles. Colloids Surf B Biointerfaces. 2003;32(2):87–95. doi:10.1016/S0927-7765(03)00148-6
59. Thomson ABR, Keelan M, Tavernini M. Early feeding of a high-cholesterol diet enhances intestinal permeability to lipids in rabbits. Pediatr Res. 1987;21(4):347–351. doi:10.1203/00006450-198704000-00005
60. Wang XY, Liu ZY, Wang JS, et al. Determination and limit testing of alkaloids in Aconiti Lateralis Radix Praeparata from classical prescription Zhenwu Decoction. Chin J Mod Chin Med. 2024;26(9):1578–1585. doi:10.13313/j.issn.1673-4890.20240318001
 © 2025 The Author(s). This work is published and licensed by Dove Medical Press Limited. The
full terms of this license are available at https://www.dovepress.com/terms.php
and incorporate the Creative Commons Attribution
- Non Commercial (unported, 4.0) License.
By accessing the work you hereby accept the Terms. Non-commercial uses of the work are permitted
without any further permission from Dove Medical Press Limited, provided the work is properly
attributed. For permission for commercial use of this work, please see paragraphs 4.2 and 5 of our Terms.
© 2025 The Author(s). This work is published and licensed by Dove Medical Press Limited. The
full terms of this license are available at https://www.dovepress.com/terms.php
and incorporate the Creative Commons Attribution
- Non Commercial (unported, 4.0) License.
By accessing the work you hereby accept the Terms. Non-commercial uses of the work are permitted
without any further permission from Dove Medical Press Limited, provided the work is properly
attributed. For permission for commercial use of this work, please see paragraphs 4.2 and 5 of our Terms.