")
Back to Journals » Neuropsychiatric Disease and Treatment » Volume 20
Using Machine Learning and Electronic Health Records to Identify Neuropsychiatric Risk Scores for Delirium in ICU and General Hospital Settings
Authors Heikal M , Saad H , Ghanime PM , Bou Dargham T , Bizri M , Kobeissy F , El Hajj W, Talih F
Received 31 July 2024
Accepted for publication 24 September 2024
Published 2 October 2024 Volume 2024:20 Pages 1861—1876
DOI https://doi.org/10.2147/NDT.S479756
Checked for plagiarism Yes
Review by Single anonymous peer review
Peer reviewer comments 2
Editor who approved publication: Dr Roger Pinder
Mariam Heikal,1 Halim Saad,2 Pia Maria Ghanime,3 Tarek Bou Dargham,4 Maya Bizri,5 Firas Kobeissy,6 Wassim El Hajj,1 Farid Talih2
1Department of Computer Science, American University of Beirut, Beirut, Lebanon; 2Department of Psychiatry, Faculty of Medicine, American University of Beirut, Beirut, Lebanon; 3Department of Psychiatry, Massachusetts General Hospital, Boston, MA, USA; 4Department of Neurosurgery, Duke University Medical Center, Durham, NC, USA; 5Department of Psychiatry and Psychology, Cleveland Clinic, Cleveland, OH, USA; 6Department of Neurobiology, Morehouse School of Medicine, Atlanta, GA, USA
Correspondence: Mariam Heikal, Department of Computer Science, American University of Beirut, Beirut, Lebanon, Email [email protected]
Objective: Delirium is a common and acute neuropsychiatric syndrome that requires timely intervention to prevent its associated morbidity and mortality. Yet, its diagnosis and symptoms are often overlooked due to its variable clinical presentation and fluctuating nature. Thus, in this study, we address the barriers to delirium diagnosis by utilizing a machine learning-based predictive algorithm for incident delirium that relies on archived electronic health records (EHRs) data.
Methods: We used the Medical Information Mart for Intensive Care (MIMIC) database to create a detailed dataset for identifying delirium in intensive care unit (ICU) patients. Our approach involved training machine learning models on this dataset to pinpoint critical clinical features for delirium detection. These features were then refined and applied to non-ICU patients using EHRs from the American University of Beirut Medical Center (AUBMC).
Results: Our study assessed machine learning models like Extreme Gradient Boosting (XGBoost), Categorical Boosting (CatBoost), Classification and Regression Trees (CART), Random Forest (RF), Neural Oblivious Decision Ensembles (NODE), and Logistic Regression (LR), highlighting superior delirium detection in diverse clinical settings. The CatBoost model excelled in ICU environments with an F1 Score of 89.2%, while XGBoost performed best in general hospital settings with a 75.4% F1 Score. Interpretations using Tabular Local Interpretable Model-agnostic Explanations (LIME) revealed critical indicators such as prothrombin time and hematocrit levels, enhancing model transparency and clinical applicability. These clinical insights help differentiate the delirium predictors between ICU patients, who are often sensitive to various factors.
Conclusion: The proposed predictive algorithm improves delirium detection rates and streamlines efficiency in hospital electronic systems, thereby enabling prompt interventions to prevent delirium progression and associated complications. The clinical indicators for delirium that we identified in general hospital settings and ICU can greatly help healthcare professionals identify potential causes of delirium and reduce misdiagnosis.
Keywords: Delirium, ICU delirium, Hospital-acquired delirium, electronic health records, machine learning, clinical indicators
Introduction
Delirium is a common, acute neuropsychiatric syndrome that is characterized by fluctuating disturbances in inattention, orientation, and cognition and is typically caused by an underlying medical condition or a toxic effect of a substance.1 Despite its transient nature, delirium is associated with poor outcomes, such as longer hospital stays, mechanical ventilation, higher rates of in-hospital and post-discharge morbidity and mortality, and an increased likelihood of readmission.2,3 Managing delirium in the hospital setting is challenging due to its complex pathophysiology, multifactorial etiology, and suboptimal treatment.4 Current clinical approaches often lack the sensitivity to capture the early stages of delirium, especially in environments like intensive care units where patients may not be able to communicate effectively due to their condition or treatment5 However, it is a potentially preventable condition that often goes unrecognized, with research indicating that more than half of in-hospital delirium cases may be averted.4 Stratifying patients according to their risk of delirium may help prioritize preventive measures for individuals at high risk.4
Delirium is a frequently undetected condition that affects a significant proportion of patients in hospitals world- wide. In the United States, healthcare teams fail to detect between 55% and 80% of cases of delirium, and misdiagnosis rates can be as high as 84.2%.5 Similar rates have been observed in Saudi Arabia, Egypt, and Lebanon, where 45.9%,6 33.7%,7 and 8.7%8 of patients, respectively, were diagnosed with delirium. One of the main reasons for the underdiagnosis of delirium is the lack of specialized training among healthcare professionals in identifying the condition. Nurses and physicians in the Middle East and North Africa region have been found to be particularly lacking in knowledge and skills related to delirium diagnosis and treatment.9,10 To address this issue, we propose a machine learning model to predict incident delirium in hospitalized patients in Lebanon using EHRs data from the AUBMC. The model’s generalization can be effortlessly adjusted by adapting it to the characteristics of the input data.
In a study by Zhao et al,11 a delirium prediction model was developed using the Classification and Regression Trees (CART) algorithm with 32 predictors, including basic demographic information, clinical signs and symptoms, and laboratory results, from patients who were hospitalized in the general medical department. Five predictors, including depression, cognitive impairment, Activities of Daily Living (ADL), nutritional condition, and drug types, were identified as the most significant characteristics by four machine learning models. Synthetic minority oversampling technique (SMOTE) was utilized to balance the training set. Positive correlations were found between delirium and depression, cognitive impairment, and drug types, while negative correlations were found between nutrition and ADL. The model achieved an Area Under the Curve (AUC) of 95% and an F1 score of 81% on the test set. The F1 score is the harmonic mean of precision and recall, which gives it equal weight to both measures. While the AUC is a widely used measure that represents the degree of separability between the model’s classes, indicating how well the model can distinguish between positive and negative cases. However, the model’s generalizability is limited to patients aged 70 years or older.
In another study by Racine et al,12 similar work was conducted, the aim was to predict postoperative delirium (POD) using machine learning models and evaluate their performance. The dataset used was obtained from the Successful Aging after Elective Surgery (SAGES) trial, which used the Confusion Assessment Method (CAM), a standardized tool used to assess the presence of delirium. The feature set comprised 71 variables, including demographic characteristics, lifestyle factors, cognitive function, physical function, psychosocial factors, frailty, sensory function, medical disorders, and laboratory results. A sub-feature set of 18 features was selected by clinicians, and three feature sets were used in the study. Five machine learning models were applied, and two ensemble models were developed. The neural network model outperformed the other models when the whole set of features was utilized, achieving the highest AUC. The inclusion of a cognitive performance measure in this research improved the performance of several algorithms compared to their performance with the defined feature set.
Along the same line, Hu et al13 used four machine learning techniques to develop predictive models for postoperative delirium (POD) occurrence in a hospital setting: Logistic Regression (LR), Random Forest (RF), Extreme Gradient Boosting (XGB), and Support Vector Machine (SVM). The study included patients who underwent non-cardiac or non-neurological surgery under general anesthesia and met specific criteria. Forty-nine characteristics were extracted, including age, gender, body mass index (BMI), education level, pre-surgery laboratory data, and surgery-specific information. Least Absolute Shrinkage and Selection Operator(LASSO) was used to select important features, resulting in eight variables: age, intraoperative blood loss, anesthetic duration, extubation time, intensive care unit (ICU) admission, Mini-Mental State Examination (MMSE) score, Charlson comorbidity index, and postoperative neutrophil-to-lymphocyte ratio. Logistic regression outperformed other classifiers, achieving an AUC of 80.44% on testing data. RF had an AUC of 70.36%, XGB had 76.83%, and SVM had 68.44%. The study’s limitation is the small dataset size (531 patient records, 125 diagnosed with POD), which limits model performance validation.
In this work, we aimed to leverage big data collection and machine learning techniques to identify clinical markers for delirium in hospitalized patients and improve their detection rates. By developing machine learning models that utilize clinical data routinely collected during a patient’s hospitalization; healthcare providers may be able to detect and diagnose delirium early on with more accuracy. EHRs are well-suited to overcome limitations in traditional detection methods. They provide a continuous, integrated repository of patient data, including changes in vital signs, laboratory results, and medication records, which are essential for applying advanced machine learning techniques. EHRs also support real-time monitoring and analysis, helping healthcare providers identify at-risk patients earlier and implement preventive measures more promptly. The integration of such models into electronic hospital systems could potentially enhance patient care and streamline healthcare efficiency. To achieve this goal, our study aims to create a delirium-specific dataset from the Medical Information Mart for Intensive Care (MIMIC) database,14,15 train machine learning models to identify clinical features for ICU delirium detection, extract the subset of identified clinical features that apply to delirium in hospitalized patients’ population, and extract a dataset that focuses on the hospitalized patients at the American University of Beirut Medical Center (AUBMC). The main contribution of our work includes: Derivation of a delirium-specific dataset from the MIMIC database,14,15 which contains objective clinical variables and a larger sample size, extraction of a focused dataset on delirium in hospitalized patients from the AUBMC’s EHRs, using machine learning and data analysis to identify potential clinical markers for delirium in ICU and general hospitalization settings, aiming to enhance detection rates, and testing effective machine learning models on our heterogeneous datasets, determining the potential of machine learning models in improving detection rates, enhancing care, and streamlining electronic systems in hospitals.
Materials and Methods
Datasets
In this research, we use two datasets, one dedicated to ICU patients, which would be derived from the MIMIC-III database, and the other specific to patients hospitalized at AUBMC.
ICU Delirium Derived Dataset
The ICU delirium dataset was extracted from the MIMIC-III version 1.4 database,14,15 which is a publicly available database comprising EHRs of ICU patients admitted to the Beth Israel Deaconess Medical Center (BIDMC) between 2001 and 2012. The inclusion criteria enforced for selecting the records were the availability of chart records and a minimum age of 18 years old. The ICU delirium dataset was derived using the following 10 data tables: PATIENTS, ADMISSIONS, ICUSTAYS, CHARTEVENTS, INPUTEVENTS MV, INPUTEVENTS CV, OUTPUTEVENTS, D ITEMS, D ICD DIAGNOSES, and DIAGNOSIS ICD. The names of these tables are the original names as they appear in the MIMIC database.
Figure 1 Provides an overview of the derivation process for the ICU delirium dataset. The dataset extraction process followed the following steps:
 |
Figure 1 ICU delirium MIMIC-III derived dataset data derivation process overview. |
Extracting Patients’ Demographics and Admission Information
The PATIENTS and ADMISSIONS data tables were merged using the subject identifiers to link each patient to their admission. Each admission is treated as a separate record, and the admission identifier is used as the primary identifier for merging the tables. These tables provide information such as the admission time, type, and location of the patient, as well as their insurance, language, religion, marital status, ethnicity, gender, and age. Additionally, they indicate whether a patient’s chart information is stored in the database.
To link each patient’s admission to their ICU stay, we integrated the ICUSTAYS data table with the aforementioned output table Therefore, each record in our output table is uniquely identified by the patient’s identifier (SUBJECT ID), admission identifier (HADM ID), and ICU stay identifier (ICUSTAY ID). The ICUSTAYS table provides information such as the length of stay for each patient in the ICU.
Extracting Clinical Charted Observations
The CHARTEVENTS table contains information about the clinical observations recorded for each patient. Each clinical variable is represented by a single row within the table The table consists of 1.46 billion rows, where each row corresponds to a specific clinical feature value measured at a particular time instance during a patient’s admission and ICU stay. However, due to computational and memory limitations, only one billion rows were utilized, corresponding to 68.5% of the CHARTEVENTS table Every row in the CHARTEVENTS table is uniquely identified by patient, admission, ICU stay, and the clinical feature (ITEM ID) identifiers.
To link each item to its corresponding label, the CHARTEVENTS table was merged with the D ITEMS table, which contains the ITEM ID and their labels. All data tables containing information about a patient’s clinical features suffer from inconsistencies in data entry, which lead to a dataset with a high proportion of missing values that contain redundant columns with similar names. Inconsistencies in clinical variable labels were addressed by using the Levenshtein distance16 to identify text similarity between instances of the variable LABEL in the CHARTEVENTS table When using the Levenshtein distance to address data inconsistencies, a threshold is used to determine the maximum number of allowed differences between two strings. The threshold was set to 2 if the length of the words exceeded 5 characters and to 4 otherwise. The threshold value was chosen based on experiments with different values to ensure that similar words were grouped while avoiding grouping irrelevant words together.
The examination of the CHARTEVENTS table also uncovered that some variables such as temperature and weight measurements were not consistently recorded in the same units across all patients. A conversion process was implemented to address this issue. The resulting table included 159 clinical features as columns. For the OUTPUTEVENTS and INPUTEVENTS tables, the same approach was applied to resolve data entry inconsistencies, and 16 and 132 clinical features were extracted from them, respectively. The transformed tables were merged using common identifiers, resulting in a table with 307 columns.
Identifying Delirium Patients
To identify patients who suffered from delirium during their ICU stay, the following six ICD-9 codes were used: 290.4, 292.81, 293.0, 293.1, 293.8, and 293.9. Information about the ICD-9 code assigned to each patient’s admission was extracted from the DIAGNOSIS ICD table The D ICD DIAGNOSES table provided short and long titles for each ICD-9 code, which were merged with the DIAGNOSIS ICD table using the ICD9 CODE identifier. The resulting table was then merged with the output table from the previous steps to assign an ICD-9 code to each record in the derived dataset. A new binary feature, Delirium, was added to indicate whether a patient experienced delirium during their ICU stay. A patient’s ICU stay was classified as a delirium case if they were assigned at least one of the six ICD-9 codes related to delirium during their ICU stay.
Finally, the dataset comprised 38,526 unique records for ICU patient admissions, with 1714 cases of delirium identified, representing 4.4% of the extracted records. The non-delirium cases were downsampled to double the number of delirium cases.
Hospital-Acquired Delirium Dataset
Data from EHRs of adult male and female patients admitted to general medical floors of AUBMC between November 2018 and October 2021 were extracted to investigate the potential of machine learning in detecting delirium incidence in hospitalized patients and developing a model for identifying hospital-acquired delirium.
Patients who received a diagnosis of delirium or exhibited any of the signs related to a diagnosis of delirium during their hospital stay were included in the study. The inclusion criteria were as follows: a diagnosis of delirium, psychiatry consultation, neurology consultation, or other consultation for altered mental status, agitation or confusion, use of restraints, new onset (post-admission) use of antipsychotics (haloperidol, quetiapine, risperidone, olanzapine) or valproic acid, and new onset (post-admission) use of benzodiazepines. Patients who were admitted to the ICU during a diagnosis of delirium were excluded, as well as children (18 years old or younger) since delirium is assessed differently in the pediatric population. Eight data tables, described in Figure 2, were extracted from the AUBMC’s EHRs.
 |
Figure 2 Synopsis of AUBMC data tables provided by the psychiatry department. PAT DEMO: Patient Demographics, ID CSN: Identification Clinical System Number, PAT SOC: Patient Social History, CONS DIAG: Consultation Diagnosis, MEDS: Medications, REST: Restraint Orders, ENC VIT: Encounter Vital Signs, CLINIC FEAT: Clinical Features. |
The dataset preparation and feature engineering process for delirium in hospitalized patients from the given data tables can be summarized as follows:
- The data integration process involved using encounter identifiers of patients to link hospital admissions to the related information. The PAT DEM and REST tables were merged with the ID CSN table to assign an encounter identifier to each entry. The PAT SOC table was merged with the remaining tables using the patient’s identifier.
- The MEDS data table provided information on the use of specific medications by hospitalized patients. To represent the frequency of medication use, 7 features were derived from this table based on the number of times a patient was prescribed medication containing specific substances during their hospital stay. The medications included Bromazepam, Midazolam, Diazepam, Valproic, Lorazepam, Clonazepam, and Alprazolam. The number of medication orders was only tracked for patients who received a prescription for these specific medication substances.
- A feature representing the age of the patients was derived using their date of birth and hospital admission time. The duration of hospital stay (in days) for each patient was also calculated using their admission and discharge dates.
- Binary features were created from the doctors’ notes in the CONS DIAG data table through text searching for specific keywords. The following 11 binary features were generated: Signs of Agitation, History of Dementia, Signs of Depression, Signs of Anxiety, History of Bipolar Disorder, History of Cancer, Drug Abuse, Use of antipsychotics, History of Parkinson’s Disease, Use of Lithium, History of Obsessive-Compulsive Disorder (OCD).
- The REST data table was utilized to generate two binary features that signify whether a patient had a restraint order during their hospital stay and whether this order was due to self-harm.
The approach used to identify clinical features for delirium in hospitalized patients involved training machine learning models on the ICU delirium-derived dataset, as represented in ICU Delirium Derived Dataset, and evaluating their performance. The top-performing model was then utilized to identify important clinical variables for detecting delirium in ICU patients’ records. A total of 73 clinical variables were identified by the model, sorted based on their importance, and assessed for relevance to our hospitalized patient population. Variables not applicable to our population were excluded. From these 73 clinical variables, a subset of 30 variables was selected and extracted for our patient population at the AUBMC. These variables are continuously recorded throughout the hospital stay at the AUBMC. The initial values for each variable were determined by selecting the first recorded instance during a patient’s hospital stay. Subsequently, the resulting data table was merged with the output table from the AUBMC data using the encounter identifier.
The hospital-acquired delirium dataset extracted from AUBMC comprises 1682 unique labeled records representing patients’ hospital stays. Confirmed and possible delirium cases account for 33.4% of the dataset. To assign delirium labels to the encounters in the data tables, we followed a specific methodology. Each encounter was categorized as confirmed, possible, or no delirium based on the clinical evidence found during chart review. Confirmed delirium was assigned when there was clear documentation of delirium in the notes or problem lists written and signed by the clinical care providers. Possible delirium was assigned when there was a high suspicion of delirium episodes based on the chart review, even without documented confirmation of a diagnosis by the relevant medical teams. Instead, a collection of supportive clues and descriptions in the chart review indicated the presence of possible delirium. Encounters that did not exhibit confirmed or possible delirium were classified as no delirium.
We also reviewed the history, physical exam, assessment, and plan of care of specialty care teams consulted for symptoms and presentations similar to delirium, mainly psychiatry and neurology consultation. The inclusion criteria were used as supportive evidence for possible delirium in the chart review to help navigate clinical judgement. The aforementioned evaluation of the selected medical records and subsequent identification as delirium or non-delirium cases, was performed by volunteer medical students. The medical students were instructed regarding the identification criteria mentioned above by FT, MB, HS, and directly supervised by HS (medical research fellow). FT and MB (both academic psychiatrists trained in consultation-liaison psychiatry and clinical experts in delirium) reviewed selected records periodically and provided overall oversight on the clinical evaluation of the records.
Data Preprocessing
Our ICU delirium derived dataset included 7 categorical features, 74 numerical features, and 1 binary feature. While the hospital-acquired delirium extracted dataset included 11 categorical features, 41 numerical features, and 17 binary features. Table 1 displays demographic characteristics statistics of the included patients in the ICU MIMIC-III derived and hospital-acquired delirium AUBMC extracted datasets.
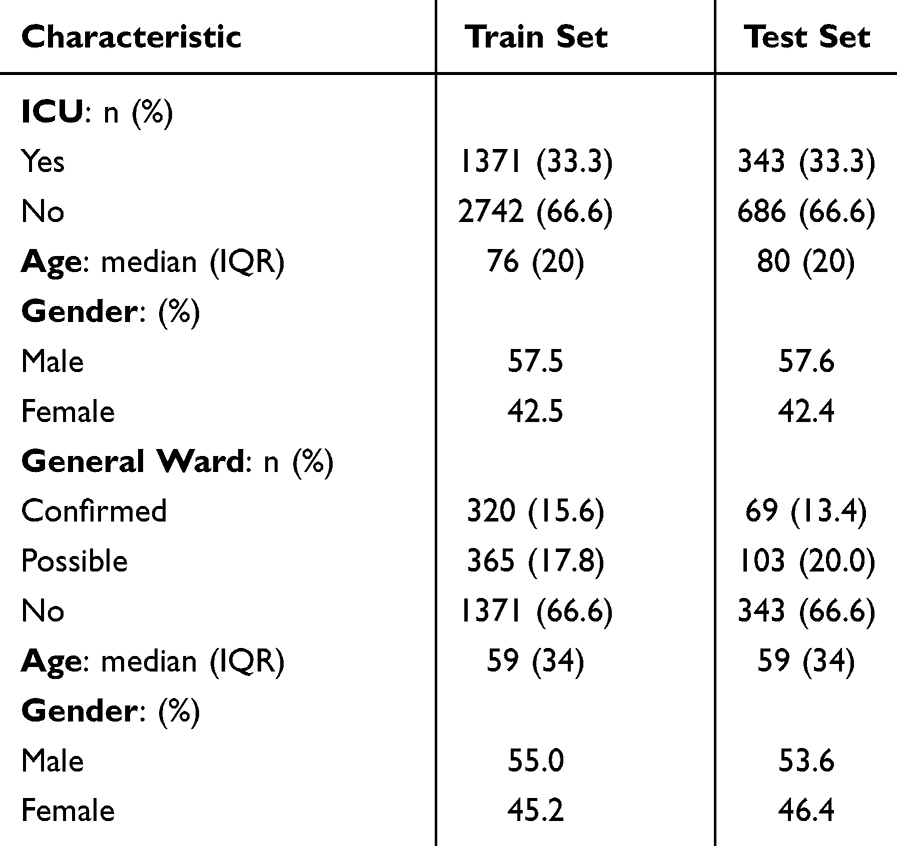 |
Table 1 Demographic Characteristics of the Included Patients in ICU MIMIC-III Derived and Hospital-Acquired Delirium Extracted Datasets |
Missing values are prevalent in EHRdata, making handling them a crucial step in training machine learning models. In this study, we experimented with two thresholds, 35% and 75%, to determine the impact of the proportion of missing values on model performance. To address the missing values, we used DataWig,17 an open-source deep-learning toolkit for missing values imputation. We trained DataWig’s imputer on rows from the training set where the column being imputed had no missing values and then used the fitted model to predict missing values in this column for both the train and test sets. The datasets included features with missing values ranging from 0.1% to 99%, and the missing values percentage was limited to a maximum of 75% based on experimental results.
We used two encoding techniques for categorical variables, taking into account their cardinality, in models that necessitated such encoding. For variables with a low cardinality, we applied ordinal encoding, while for variables with a high cardinality, we employed leave-one-out encoding (LOOE). The only variable that underwent LOOE was the address feature in the hospital-acquired delirium AUBMC extracted dataset.
Machine Learning Approaches
Our datasets consisted of both training and testing subsets. The training dataset, which constituted 80% of the data, was utilized for model development, while the remaining 20% was reserved as a holdout dataset for external validation. To tune our models’ hyperparameters, we utilized 5-fold cross-validation on the training dataset. We optimized the hyperparameters using a comprehensive parameter grid through random search.
Upon determining the optimal hyperparameters, we trained our machine models using the training dataset. Specifically, we trained logistic regression (LR), classification and regression trees (CART), and random forest (RF) using the Python Sklearn library, as well as CatBoost and Extreme Gradient Boosting using their respective Python libraries. Additionally, we used two deep learning approaches, Neural Oblivious Decision Ensembles (NODE)18 through a PyTorch Tabular wrapper library, and TransTab19 through its Python package, to train our models.
Logistic regression is a statistical model used for binary classification tasks. It models the relationship between a dependent variable and one or more independent variables using a logistic function. CART is a machine learning algorithm that uses a tree structure to split the data into different subsets based on features. Random Forest is an ensemble learning method that combines multiple decision trees to make predictions. It works by aggregating the predictions of individual decision trees to reach a final prediction.
CatBoost is a gradient-boosting algorithm that is particularly effective for handling categorical features in the data. It incorporates a specific approach to handling categorical variables and provides excellent performance in terms of accuracy and efficiency. XGBoost is another gradient-boosting algorithm known for its scalability and high performance. It improves upon traditional gradient boosting by adding regularization and handling missing values.
NODE is a deep learning approach that utilizes ordinary differential equations (ODEs) to model dynamic systems. It can capture temporal dependencies and non-linear dynamics in the data. TransTab is a deep learning approach that uses transformers, which are attention-based neural networks, for tabular data. It is designed to handle structured data with tabular format effectively.
In this study, we compare these various machine learning models for identifying delirium risk scores from clinical data. Logistic regression is chosen due to its interpretability, computational efficiency, and suitability for large datasets. CART is selected for its ability to capture complex feature interactions and handle missing values. Random forest is included for its capacity to handle high-dimensional data and capture non-linear relationships. CatBoost is chosen for its effectiveness in handling categorical features commonly found in medical datasets. XGBoost is included for its scalability, performance, and ability to handle large datasets. NODE is considered for its capability to capture temporal dependencies and non-linear dynamics using ordinary differential equations. TransTab is chosen for its ability to effectively handle tabular clinical data, capture feature interactions, and learn task-specific representations.
Comparing these models allows us to evaluate their performance in terms of accuracy, interpretability, and their ability to handle specific data characteristics such as categorical features, temporal dependencies, non-linear relation- ships, and tabular structure. This analysis will provide insights into the most suitable model or combination of models for accurate delirium risk score identification in clinical settings.
Results
The performance of our machine learning models was assessed using a comprehensive set of metrics. These included F1 score, accuracy, AUC, recall, precision, specificity, and negative predictive value. These metrics provide insights into different aspects of model performance. The F1 score, accuracy, and AUC measure the overall correctness, balance, and discriminative ability of the models, respectively. Recall, precision, specificity, and negative predictive value evaluate the model’s ability to correctly identify delirium cases while minimizing false positives and false negatives. In the context of delirium risk scores, metrics such as recall, precision, specificity, and negative predictive value are of particular importance for evaluating the model’s performance accurately. For evaluating model performance, we considered the F1 score as the primary metric since it provides a balance between precision and recall.
We assessed the performance of CatBoost, XGBoost, NODE, and TransTab, when trained on the ICU delirium-derived dataset using various data preprocessing approaches. In particular, we examined how these models performed after applying different data preprocessing techniques. Considering that CatBoost, NODE, and TransTab are well- suited for handling non-numerical data, we evaluated their performance on the raw dataset, with only missing value imputation applied. This allowed us to investigate the effectiveness of these models without additional preprocessing steps. The results obtained from these three models are presented in the first section of Table 2. For models requiring numerical data for training, ordinal encoding was applied. CatBoost demonstrated the best performance across all assessment measures when trained on the dataset with and without ordinal encoding, as shown in c.
 |
Table 2 Performance on ICU Delirium MIMIC-III Derived Dataset Under Different Training Setups: Trained on Raw Data, Data with Ordinal Encoding, and Data with the Exclusion of the Length of Stay (LOS) Feature |
Table 3 presents the performance of various machine learning models in identifying hospitalized patients with delirium. Ordinal encoding was utilized for models requiring the transformation of categorical data into a numerical representation. The best-performing CatBoost models, for both ICU and hospitalized patients, were trained using the default hyperparameters. For the best-performing XGBoost model for hospitalized delirium patients, hyperparameters were optimized using RandomSearch from the Sklearn library. The final model used a subsample rate of 0.9, 200 estimators, a maximum depth of 3, a learning rate of 0.1, gamma set to 0, and a colsample_bytree of 1.0.
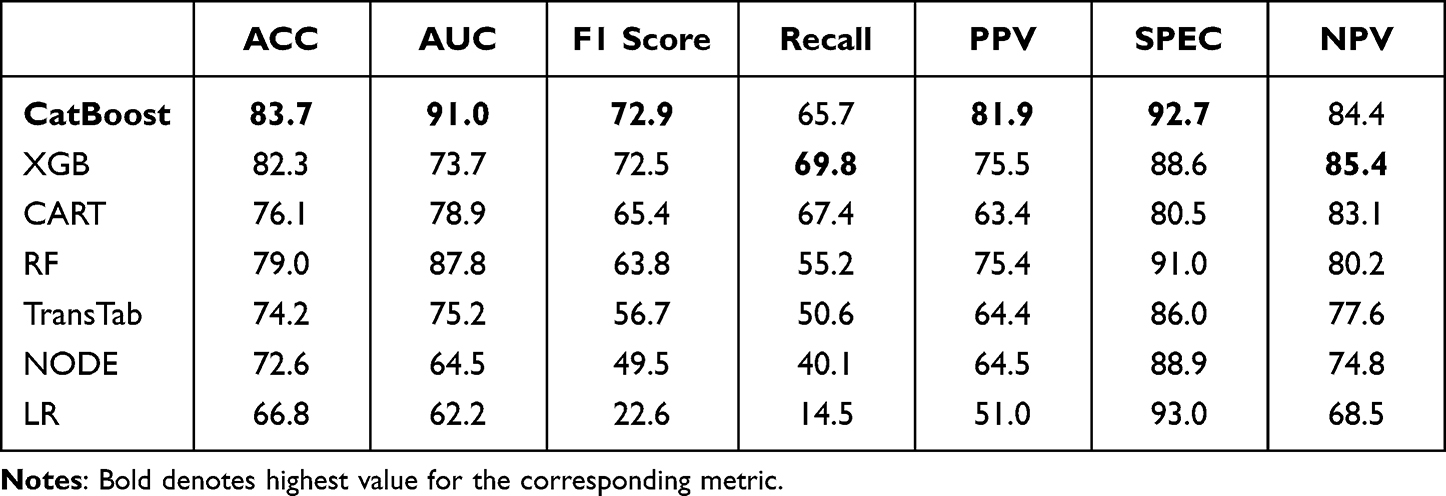 |
Table 3 Performance on Hospital-Acquired Delirium AUBMC Dataset |
Feature Importance Analysis
After determining the best-performing models on the hospital-acquired delirium AUBMC extracted dataset, we analyzed the models’ feature importance and removed the features that did not contribute to the model’s learning. The following features were considered unimportant by the CatBoost model: binary indicators of Alzheimer’s disease, OCD, and anxiety, history of bipolar disorder, history of abuse, use of antipsychotics and lithium, as well as smoking pipes. These features were subsequently removed from our training and testing sets. As a result, the models’ performance improved significantly in terms of recall and F1 score as shown in Table 4, while some other metrics experienced slight degradation when compared to results of the same models when trained on AUBMC dataset with the full feature set shown in Table 3. Identifying Delirium Patients of Table 3 is discussed in section 3.4 of the paper.
 |
Table 4 Performance of Gradient Boosting Algorithms Trained on Hospital-Acquired Delirium AUBMC Under Different Training Setups: Models Trained on Selected Features, Models’ Performance After Threshold Adjustment, Models Trained Without the LOS Feature |
Identification of Top Predictors for ICU Delirium and Hospital-Acquired Delirium Using CatBoost Model
The CatBoost model identified the top 20 predictors for ICU delirium and hospital-acquired delirium datasets. Among these, 17 clinical features were identified as strong predictors, including hematocrit, prothrombin time (PT), platelet count, oxygen saturation pulse oximetry, non-invasive blood pressure, Glasgow Coma Scale (GCS) verbal response, Weight, GCS Motor Response, Mean Airway Pressure (MAP), Braden Score, age, respiratory rate, non-invasive blood pressure, anion gap, GCS total, exhaled minimum volume, arterial PaCO2, GCS eye opening, serum chloride, and length of ICU stay.
Similarly, the top 20 predictors, sorted based on importance, in the hospital-acquired delirium dataset for our CatBoost model, included a mix of clinical and non-clinical features such as alanine transaminase (ALT), length of hospital stay, age, alcohol use, procalcitonin, aspartate aminotransferase (AST), glucose, albumin, number of tobacco packets (pack years), gamma-glutamyl transferase, patient’s address, midazolam medication administration count for the patient, calcium, alkaline phosphatase, mean corpuscular volume (MCV), platelet count, temperature, lactic acid venous, bromazepam medication administration count for the patient, and Basophils.
These findings align with the results reported by Kim et al in their study,20 where smoking status, alcohol consumption, age, respiratory rate, and ALT were identified among the top 20 features out of the 39 features used to predict delirium in patients with advanced cancer receiving palliative care.
Exploring False Negatives in Hospital-Acquired Delirium Prediction Model: Analysis of Misclassified Cases
We analyzed false negative cases produced by our delirium prediction model to identify patterns that may have led to misclassification. As presented in Figure 3, a misclassified delirium patient is presented with a lower probability score of 0.44, where the model considers advanced age, lactic acid venous level below a predetermined threshold, and high total protein levels among other closures as potential indicators of delirium, while other features including normal values of albumin level and ALT contributed to a probability score of 0.56 for the absence of delirium. These findings suggest that the incorporation of multiple clinical indicators in the model’s algorithm may increase the accuracy of delirium prediction. Similarly, in another false negative case shown in Figure 3, the model interprets normal levels of glucose, gamma-glutamyl transferase, and temperature as indicators of the absence of delirium. However, it also considers factors like low albumin levels, advanced age, and a slightly elevated mean corpuscular volume as potential indicators of delirium, along with other features. This results in a probability score of 0.4 for the occurrence of delirium in this patient.
 |
Figure 3 Misclassified Hospital-acquired Delirium Patients: False Negative Cases. |
After analyzing some of the misclassified patient records, we found that our prediction model assigned risk scores between 0.4 and 0.5 to a significant number of our delirium cases. As a result, we have decided to lower the threshold for identifying delirium cases from 0.5 to 0.4. This means that any patient with a probability score of 0.4 or higher will now be classified as a delirium case by our models. We anticipate that this adjustment will enhance the model’s sensitivity in detecting delirium cases, particularly those with lower probability scores, as shown in Table 4’s second section.
Discussion
Impact of Encoding Strategies on Model Performance
The CatBoost model’s slightly better performance on raw data using its built-in encoding strategy suggests that built-in handling of categorical data may be more effective than applying ordinal encoding for certain models. This observation aligns with existing literature that emphasizes the importance of preserving the natural structure of categorical data during model training.
XGB’s higher recall rate, despite CatBoost’s overall superior performance, indicates a trade-off between overall accuracy and sensitivity to identifying delirium cases. This suggests that different models may excel in different aspects of delirium detection, depending on the specific metric of interest.
Interpretation of CatBoost Decisions Using Tabular LIME
The tabular version of LIME21 was used to interpret the CatBoost model trained on the ICU delirium dataset in order to comprehend the logic it uses to determine if an input represents an occurrence of delirium. Figure 4 displays a true positive example and the logic underlying the result of the model, where orange-colored features act as indicators of delirium incidence. In the ICU delirium instance, the model considers the patient’s PT, being more than the threshold of 16.4 that the model has established for this variable, as an indication that the patient had a higher likelihood of experiencing delirium. PT is a blood test that measures the time it takes for blood to clot and is used to assess the activity of the clotting factors produced by the liver. High PT or prolonged coagulation time has been associated with an increased risk of delirium in some studies. One possible reason for the association between high PT and delirium is that high PT may reflect liver dysfunction or damage, which can lead to an accumulation of toxins in the body that can affect brain function. Additionally, coagulation factors, including those assessed by PT, have been shown to play a role in inflammation and immune responses, which can contribute to the development of delirium.22 The model’s decision-making process involves assessing values across the variables it has been trained on, with varying degrees of importance assigned to each variable.
 |
Figure 4 Correctly Classified ICU and Hospital-acquired Delirium Patients: True Positive Cases. |
In addition, the model detects the patient’s hematocrit of 23.68, which is below a predetermined threshold of 29.61, as an indicator of delirium incidence. In their study, Potharajaroen et al conclude that low hematocrit is a significant predictor of delirium, which is consistent with our model’s logic.23 Hematocrit is a measure of the proportion of red blood cells in the blood and is an indicator of the oxygen-carrying capacity of the blood.24 Low hematocrit levels also been found to be associated with an increased risk of delirium in some studies.25 One possible reason for the association between low hematocrit levels and delirium is that low levels of oxygen in the blood could lead to reduced oxygen supply to the brain, which could affect brain function and contribute to the development of delirium. Additionally, low hematocrit levels may be a marker of anemia, which can be caused by a variety of factors including nutritional deficiencies, chronic illness, and medication side effects. Anemia can lead to reduced oxygen supply to the brain and may also contribute to the development of delirium.24
Figure 4 also presents the LIME interpretations for a correctly classified patient with hospital-acquired delirium. Positive importance indicates features that contribute positively to a model’s prediction, making it more confident in the predicted class, such as “Age > 77.43” increasing the likelihood of predicting hospital-acquired delirium. Conversely, negative importance denotes features that detract from the confidence in the prediction, like “Gamma-Glutamyl Transferase > 55.25” reducing the likelihood. These importances are visualized with green bars for positive contributions and red bars for negative ones, aiding in the interpretability of the model’s decision-making process.
The model identifies the patient’s advanced age, extended length of hospital stay, and high body mass index as non-clinical predictors of delirium. There is evidence that a high BMI may be associated with an increased risk of delirium, especially in older individuals; possible explanations are that being overweight increases inflammation and other weight-associated conditions such as obstructive sleep apnea. Additionally, the combination of albumin, gamma-glutamyl transferase, glucose, and phosphate values serves as clinical indicators of delirium for this patient. Albumin is a liver-produced protein that is essential for maintaining fluid homeostasis in the body. It is also involved in the transport of hormones, pharmaceuticals, and fatty acids throughout the body. One possible explanation for the association between low albumin levels and delirium is that low albumin levels may indicate malnutrition or protracted illness, both of which can increase the risk of developing delirium.26 Additionally, albumin possesses antioxidant properties and may protect the brain from oxidative stress, which has been linked to the development of delirium.
Assessing the Impact of Length of Stay Variability on Our Delirium Detection Models
The length of stay feature represents the anticipated or actual duration of a patient’s stay in the ICU or hospital room during the recording of the clinical variables in our datasets. Although the patient’s length of stay in the ICU or hospital rooms is a crucial factor for our models to detect delirium based on their medical records, it is important to note that this feature can exhibit high variability in real-time settings. Our dataset did not reflect this variability since we had access to the exact length of stay. To evaluate the performance of our models under conditions where the length of stay variable is unknown, we conducted experiments using gradient boosting on decision trees approaches on our datasets excluding the length of stay feature.
Results demonstrated in Table 2’s third section demonstrate that removing the length of stay feature did not significantly affect the performance of models trained on the ICU delirium MIMIC-III derived dataset. Surprisingly, the models still achieved high performance without this feature, suggesting that the model might prioritize other features during its training. This inference is supported by the important feature ranking for the CatBoost model trained on the ICU delirium dataset, which placed the patient’s length of stay at rank 20. In contrast, the same model trained on the hospital-acquired delirium dataset ranked the patient’s length of stay as the second most important feature among its predictors. Excluding this variable led to a reduction in the performance of our best-performing models trained on the hospital-acquired delirium AUBMC dataset across all variables, as shown in Table 4, in comparison to models trained with the same set of selected features but with the inclusion of the length of stay feature.
In real-time applications, the length of stay variable may still be useful as an indicator of the number of days a patient has been in the ICU or hospital room. Clinically, the longer the LOS, the higher the likelihood of acquiring infections or incurring injuries/accidents at the hospital, which can increase the chances of developing delirium However, it should be properly aligned with the time at which the clinical variables used as input to the model were recorded in the patient’s medical record.
Integrating Machine Learning Models into Clinical Practice: Challenges and Potential
The machine learning models developed in this research have the potential to significantly enhance delirium detection and management in clinical settings, particularly in intensive care units (ICUs) and hospital wards. These models can accurately identify patients at risk of delirium, even when some data is missing, making them especially suitable for real-time applications where perfect data availability is often not feasible. By integrating these models into electronic health record (EHR) systems, hospitals could automate risk assessments, flagging high-risk patients for immediate clinical attention and potentially reducing the incidence and severity of delirium. However, successful implementation requires careful preparation, including technical integration with EHR systems, training clinical staff to interpret and act on model outputs, and rigorous validation across diverse clinical environments to ensure the models’ robustness and adaptability to different patient populations and data variability. By taking these steps, healthcare institutions can effectively leverage these models to improve patient outcomes and optimize resource use.
Limitations
Several limitations should be acknowledged in this research. First, our study relied on a dataset with a limited number of delirium cases, which may affect the generalizability of our model’s performance to broader, more diverse patient populations. Additionally, our models were trained on a static dataset, and their performance in real-time clinical settings, where data variability is higher, remains uncertain. Although we assessed the model’s performance without the length of stay variable, this exclusion may impact the model’s accuracy in scenarios where length of stay is a critical predictor of delirium.
Conclusions
Our results demonstrate the potential for machine learning models to significantly improve detection rates, delivery of care, and efficiency in hospitals’ electronic systems. By combining big data with machine learning techniques, our study represents a step forward in enhancing patient care and outcomes by improving the identification of delirium and reducing associated morbidity and mortality. The frequent admission of patients with cardiovascular disease, stroke, or other serious medical conditions to hospital rooms or ICUs often shifts healthcare providers’ focus towards stabilizing the patient, sometimes overlooking delirium, which can develop due to complex multifactorial interactions during a hospital stay. Future work should focus on validating the model’s effectiveness through in vitro experiments. To validate the model’s performance using real-time patient data, obtaining Institutional Review Board (IRB) approval and collecting relevant features from a newly admitted patient population over a predefined duration is necessary. During this period, psychiatrists would evaluate patients for delirium symptoms. Subsequently, the model’s output would be compared to the clinical judgment of doctors to assess its accuracy.
Abbreviations
EHR, Electronic Health Record; MIMIC, Medical Information Mart for Intensive Care; ICU, intensive care units; AUB, American University of Beirut; AUBMC, American University of Beirut Medical Center; CART, Classification and Regression Tree; ADL, Activities of Daily Living; SMOTE, Synthetic Minority Oversampling Technique; AUC, Area Under the Curve; POD, Postoperative Delirium; SAGES, Successful Aging after Elective Surgery; CAM, Confusion Assessment Method; LR, Logistic Regression; RF:, Random Forest; XGB, Extreme Gradient Boosted Trees; SVM, Support Vector Machine; BMI, Body Mass Index; BIDMC, Beth Israel Deaconess Medical Center; OCD, Obsessive-Compulsive Disorder; FT, Farid Talih; MB, Maya Bizri; HS, Halim Saasd; LOOE, Leave-One-Out Encoding; NODE, Neural Oblivious Decision Ensembles; ODE, Ordinary Differential Equations; PT, Prothrombin Time; GSC, Glasgow Coma Scale; MAP, Mean Airway Pressure; NIBP, Non-invasive Blood Pressure; ALT, Alanine Transaminase; AST, Aspartate Aminotransferase; MCV, Mean Corpuscular Volume; IRB, Institutional Review Board.
Ethics Approval and Consent to Participate
The study was approved by the International Review Board (IRB) at the American University of Beirut (AUB) which is based on internationally recognized regulations presented in the Declarations of Helsinki, the Belmont Report, and the Declaration of Oviedo in Europe. The American University of Beirut and its Institutional Review Board, under the Institution’s Federal Wide Assurance with OHRP, comply with the Department of Health and Human Services (DHHS) Code of Federal Regulations for the Protection of Human Subjects (“The Common Rule”) 45CFR46, subparts A, B, C, and D, with 21CFR56; and operate in a manner consistent with the Belmont report, FDA guidance, Good Clinical Practices under the ICH guidelines, and applicable national/local regulations. Consent forms are not applicable. The need for consent forms was waivered by the international Review Board (IRB) at the American University of Beirut (AUB). All data accessed complied with relevant data protection and privacy regulations.
Acknowledgments
Farouk Jabre Biomedical Research Grants (American University of Beirut)
We would like to thank Dr. Hassan Mallah, Medical Informatics specialist at AUBMC, for extracting the data tables used in this research study from AUBMC’s EHRs. We would also like to acknowledge the contributions of the medical students from the American University of Beirut, Badr Abi Ali, Jana Haidar, Ahmad Mohamad Watfa, Alex El Darzi, Jad Tabet, Karim Lakkis, Lama Ammar, Nadine Sunji, and Nour Abi Chakra, for their volunteer work in annotating the dataset used in this research. Their efforts were instrumental in ensuring the completeness of our research study.
Funding
The project was funded by the Farouk Jabre Biomedical Research Grant.
Disclosure
The authors declare that they have no competing interests.
References
1. Davoudi A, Ozrazgat-Baslanti T, Ebadi A, Bihorac A, Rashidi P. Delirium prediction using machine learning models on predictive electronic health records data, in:
2. Corradi JP, Thompson S, Mather JF, Waszynski CM, Dicks RS. Prediction of incident delirium using a random forest classifier. Journal of Medical Systems. 2018;42(12):1–10.
3. Castro VM, Sacks CA, Perlis RH, McCoy TH. Development and external validation of a delirium prediction model for hospitalized patients with coronavirus disease 2019. J Acade Consu Psych. 2021;62(3):298–308.
4. Wong A, Liang AS, Gonzales R, Douglas VC, Hadley D. Development and validation of an electronic health record–based machine learning model to estimate delirium risk in newly hospitalized patients without known cognitive impairment. JAMA network open. 2018;1(4):e181018–e181018.
5. Mattison ML, Delirium. Annals of internal medicine. 2020;173(7):ITC49–ITC64.
6. Al-Qadheeb NS, Hashhoush M, Maghrabi K, et al. Point prevalence of delirium among critically ill patients in Saudi Arabia: a multicenter study. Saudi Critical Care Journal. 2020;4(1):9.
7. Ibrahim MHE-D, Elmasry M, Nagy F, Abdelghani A. Prevalence and risk factors of delirium and subsyndromal delirium in older adults. Egyptian J Inte Med. 2021;33(1):1–6.
8. Zrour C, Haddad R, Zoghbi M, Kharsa Z, Hijazi M, Naja W. Prospective, multi-centric benchmark study assessing delirium: prevalence, incidence and its correlates in hospitalized elderly Lebanese patients. Aging Clin Experiml Rese. 2020;32:689–697.
9. Hassnin Eita L. Mohamed Abdelaal, Nursing knowledge and practices regarding delirium as an under-recognized syndrome in intensive care units (icu psychosis. Egyptian J Health Care. 2021;12(1):904–920.
10. Salameh B, Al Razeeni DM, Mansor K, Abdallah JM, Ayed A, Salem H. Delirium in intensive care units: perceptions of physicians and nurses. Critical Care Nursing Quarterly. 2021;44(4):393–402.
11. Li Q, Zhao Y, Yue J, et al. Developing a machine learning model to identify delirium risk in geriatric internal medicine inpatients. Eur Geriatric Med. 2022;13(1):173–183.
12. Racine AM, Tommet D, D’Aquila ML, et al. Machine learning to develop and internally validate a predictive model for post-operative delirium in a prospective, observational clinical cohort study of older surgical patients. J Gen Intern Med. 2021;36(2):265–273.
13. Hu X-Y, Liu H, Zhao X, et al. Automated machine learning-based model predicts postoperative delirium using readily extractable perioperative collected electronic data. CNS Neurosci Ther. 2022;28(4):608–618.
14. Johnson AE, Pollard TJ, Shen L, et al. Mimic-iii, a freely accessible critical care database. Scientific Data. 2016;3(1):1–9.
15. Johnson A, Pollard T, Mark R. Mimic-iii clinical database (version 1.4. PhysioNet. 2016;10:C2XW26.
16. Yujian L. A normalized levenshtein distance metric, IEEE transactions on pattern analysis and machine intelligence 29 (6) (2007) 1091–1095.
17. Biessmann F, Rukat T, Schmidt P, et al. Datawig: missing value imputation for tables. J Mach Learn Res. 2019;20(175):1–6.
18. Popov S, Morozov S, Babenko A. Neural oblivious decision ensembles for deep learning on tabular data. arXiv prepr arXiv. 2019;
19. Wang Z, Sun J. Transtab: learning transferable tabular transformers across tables. Advan Neural Inform Proce Syst. 2022;35:2902–2915.
20. Kim YJ, Lee H, Lee SW, et al. Machine learning-based model to predict delirium in patients with advanced cancer treated with palliative care: a multicenter, patient-based registry cohort. Sci Rep. 2024;14(1):11503.
21. Ribeiro MT, Singh S, Guestrin C, ” why should i trust you?” explaining the predictions of any classifier, in:
22. Yang R, Moosavi L. Prothrombin time. In: StatPearls [Internet]. StatPearls Publishing; 2022.
23. Potharajaroen S, Tayjasanant T, Anderson G, et al. Bright light and oxygen therapies decrease delirium risk in critically ill surgical patients by targeting sleep and acid-base disturbances. Psychiatry Res. 2018;261:21–27.
24. Czer LS, Shoemaker WC. Optimal hematocrit value in critically ill postoperative patients. Surg Gynecol Obstet. 1978;147(3):363–368.
25. Marcantonio ER, Goldman L, Orav EJ, Cook EF, Lee TH. The association of intraoperative factors with the development of postop- erative delirium. Am j Med. 1998;105(5):380–384.
26. Bekker AY, Weeks EJ. Cognitive function after anaesthesia in the elderly. Best Pract Res Clin Anaesth. 2003;17(2):259–272.
 © 2024 The Author(s). This work is published and licensed by Dove Medical Press Limited. The
full terms of this license are available at https://www.dovepress.com/terms.php
and incorporate the Creative Commons Attribution
- Non Commercial (unported, 3.0) License.
By accessing the work you hereby accept the Terms. Non-commercial uses of the work are permitted
without any further permission from Dove Medical Press Limited, provided the work is properly
attributed. For permission for commercial use of this work, please see paragraphs 4.2 and 5 of our Terms.
© 2024 The Author(s). This work is published and licensed by Dove Medical Press Limited. The
full terms of this license are available at https://www.dovepress.com/terms.php
and incorporate the Creative Commons Attribution
- Non Commercial (unported, 3.0) License.
By accessing the work you hereby accept the Terms. Non-commercial uses of the work are permitted
without any further permission from Dove Medical Press Limited, provided the work is properly
attributed. For permission for commercial use of this work, please see paragraphs 4.2 and 5 of our Terms.