")
Back to Journals » Open Access Journal of Sports Medicine » Volume 15
Video Analysis of Elite American Football Athletes During Vertical Jump
Authors Grace JL, Hancock ME, Malone ML, Adlou B , Kosek JJ, Houde HR, Wilburn CM, Weimar WH
Received 23 July 2024
Accepted for publication 19 November 2024
Published 3 December 2024 Volume 2024:15 Pages 197—208
DOI https://doi.org/10.2147/OAJSM.S481805
Checked for plagiarism Yes
Review by Single anonymous peer review
Peer reviewer comments 2
Editor who approved publication: Prof. Dr. Andreas Imhoff
John L Grace, Meghan E Hancock, Madison L Malone, Bahman Adlou, Jerad J Kosek, Hannah R Houde, Christopher M Wilburn, Wendi H Weimar
School of Kinesiology, Auburn University, Auburn, AL, USA
Correspondence: John L Grace, School of Kinesiology, Auburn University, 301 Wire Road, Auburn, AL, 36849, USA, Tel +1 (334) 844-1468, Fax +1 (334) 844-1469, Email [email protected]
Introduction: The National Football League (NFL) combine tests the athleticism of prospects competing for the draft. The vertical jump is included to test lower extremity power, yet the components which lead to the greatest performance remain elusive. Therefore, this study aimed to utilize a sample of elite athletes to analyze vertical jump components associated with increased performance and the relationship between vertical jump performance and rookie-year success.
Methods: Videos of 50 NFL prospects performing the vertical jump task were analyzed for various countermovement jump components. Regression analyses examined the components in relation to normalized jump height and rookie Approximate Value (AV) using an alpha level of 0.05.
Results: After analysis, only the overall model for normalized jump height was statistically significant (R^2^ = 0.69, p = 0.002).
Discussion: While no single variable predicted jump height, distinct strategies were evident between the top and bottom 25% performers based on component correlations. The regression model approached significance in predicting rookie AV (R^2^ = 0.94, p = 0.052), with notable components like heel pauses for skilled positions and greater knee flexion for linemen. By creating models that can predict jump height or AV, variables can be identified that can be used to improve one’s jump height or, in the case of AV, that can be used to predict which draft prospects will perform better in the NFL.
Keywords: athletes, technique, biomechanics, sport, video analysis
Introduction
Jumping is incorporated into most overground physical activities and is often associated with athletic performance in sports like basketball, volleyball, and American football. The countermovement vertical jump (CMJ) is used to train, measure performance,1 and identify injury risks.2 The NFL utilizes CMJ performance at the annual combine to evaluate prospects.3 Given its importance, athletes, coaches, biomechanists, and allied professionals highly seek the optimal combination of techniques to improve CMJ performance.
Previous research has identified peak force, rate of force development, impulse, angular velocity, and torque as contributing factors to successful CMJ performance. However, lower-extremity power is often reported as the best single predictor.4 Although the CMJ is well studied,4–6 little is known about the self-determined techniques used by professional athletes during maximum effort vertical jumps. As vertical jumping is a complex movement, evaluating the techniques used by elite athletes may benefit our understanding of parameters most related to performance improvement.
While researchers attempt to mimic competitive environments, an athlete’s mindset during research may prevent optimum performance.7 Fortunately, professional sports leagues have begun recording test performances along with videos of the athletes.8 Previous studies have utilized YouTube videos mainly for injury or case studies, but this methodology has yet to be fully utilized for biomechanical performance.9–12
With advanced video analysis, the CMJs can be transcribed to allow for sophisticated analyses. To better understand the techniques used by elite NFL athletes to achieve the best CMJ results, official combine footage was obtained and analyzed in this study.
The purpose of this study was to analyze specific CMJ components of draft-eligible American football athletes during an intense combine competition and their association with jump height and rookie-year performance. It was hypothesized that certain jump components would be associated with increased jump height or rookie performance. Additionally, it was hypothesized that a pattern would exist for groups of CMJ components that athletes and professionals employ to improve jump performance.
Methods
Study Design and Participants
Fifty NFL draft-eligible player’s videos performing a CMJ at the NFL combine were saved from publicly available data.13 Videos representing combine performances from 2015 to 2022 were considered. The CMJ height was measured at the NFL combine using a traditional mechanical vertical jump tester, such as a Vertec. The inclusion criteria for the analysis were that the player had to have decided to enter the NFL Draft and the player’s official CMJ video must have been documented prior to their draft day and had a camera angle in which each variable could be analyzed with confidence by the investigators. The exclusion criteria were if the player had a preexisting injury or had gotten injured during their vertical jump trials. The Auburn University Institutional Review Board has reviewed this study and deemed it “Exempt” under federal regulation 45 CFR 46.104(b)(4).
Procedures
A data acquisition spreadsheet with the CMJ components was prepared in Microsoft Excel. Three investigators (JG, MH, MM) independently reviewed the videos to document their evaluation of the specified CMJ components in a spreadsheet unique to them. Answers to each variable were either binomial or categorical (three to five factor levels). CMJ phases required for analysis were predetermined14 and included weighing, unweighting, braking, propulsion, flight, and landing. However, a list of specific movements within each phase was developed (Table 1).
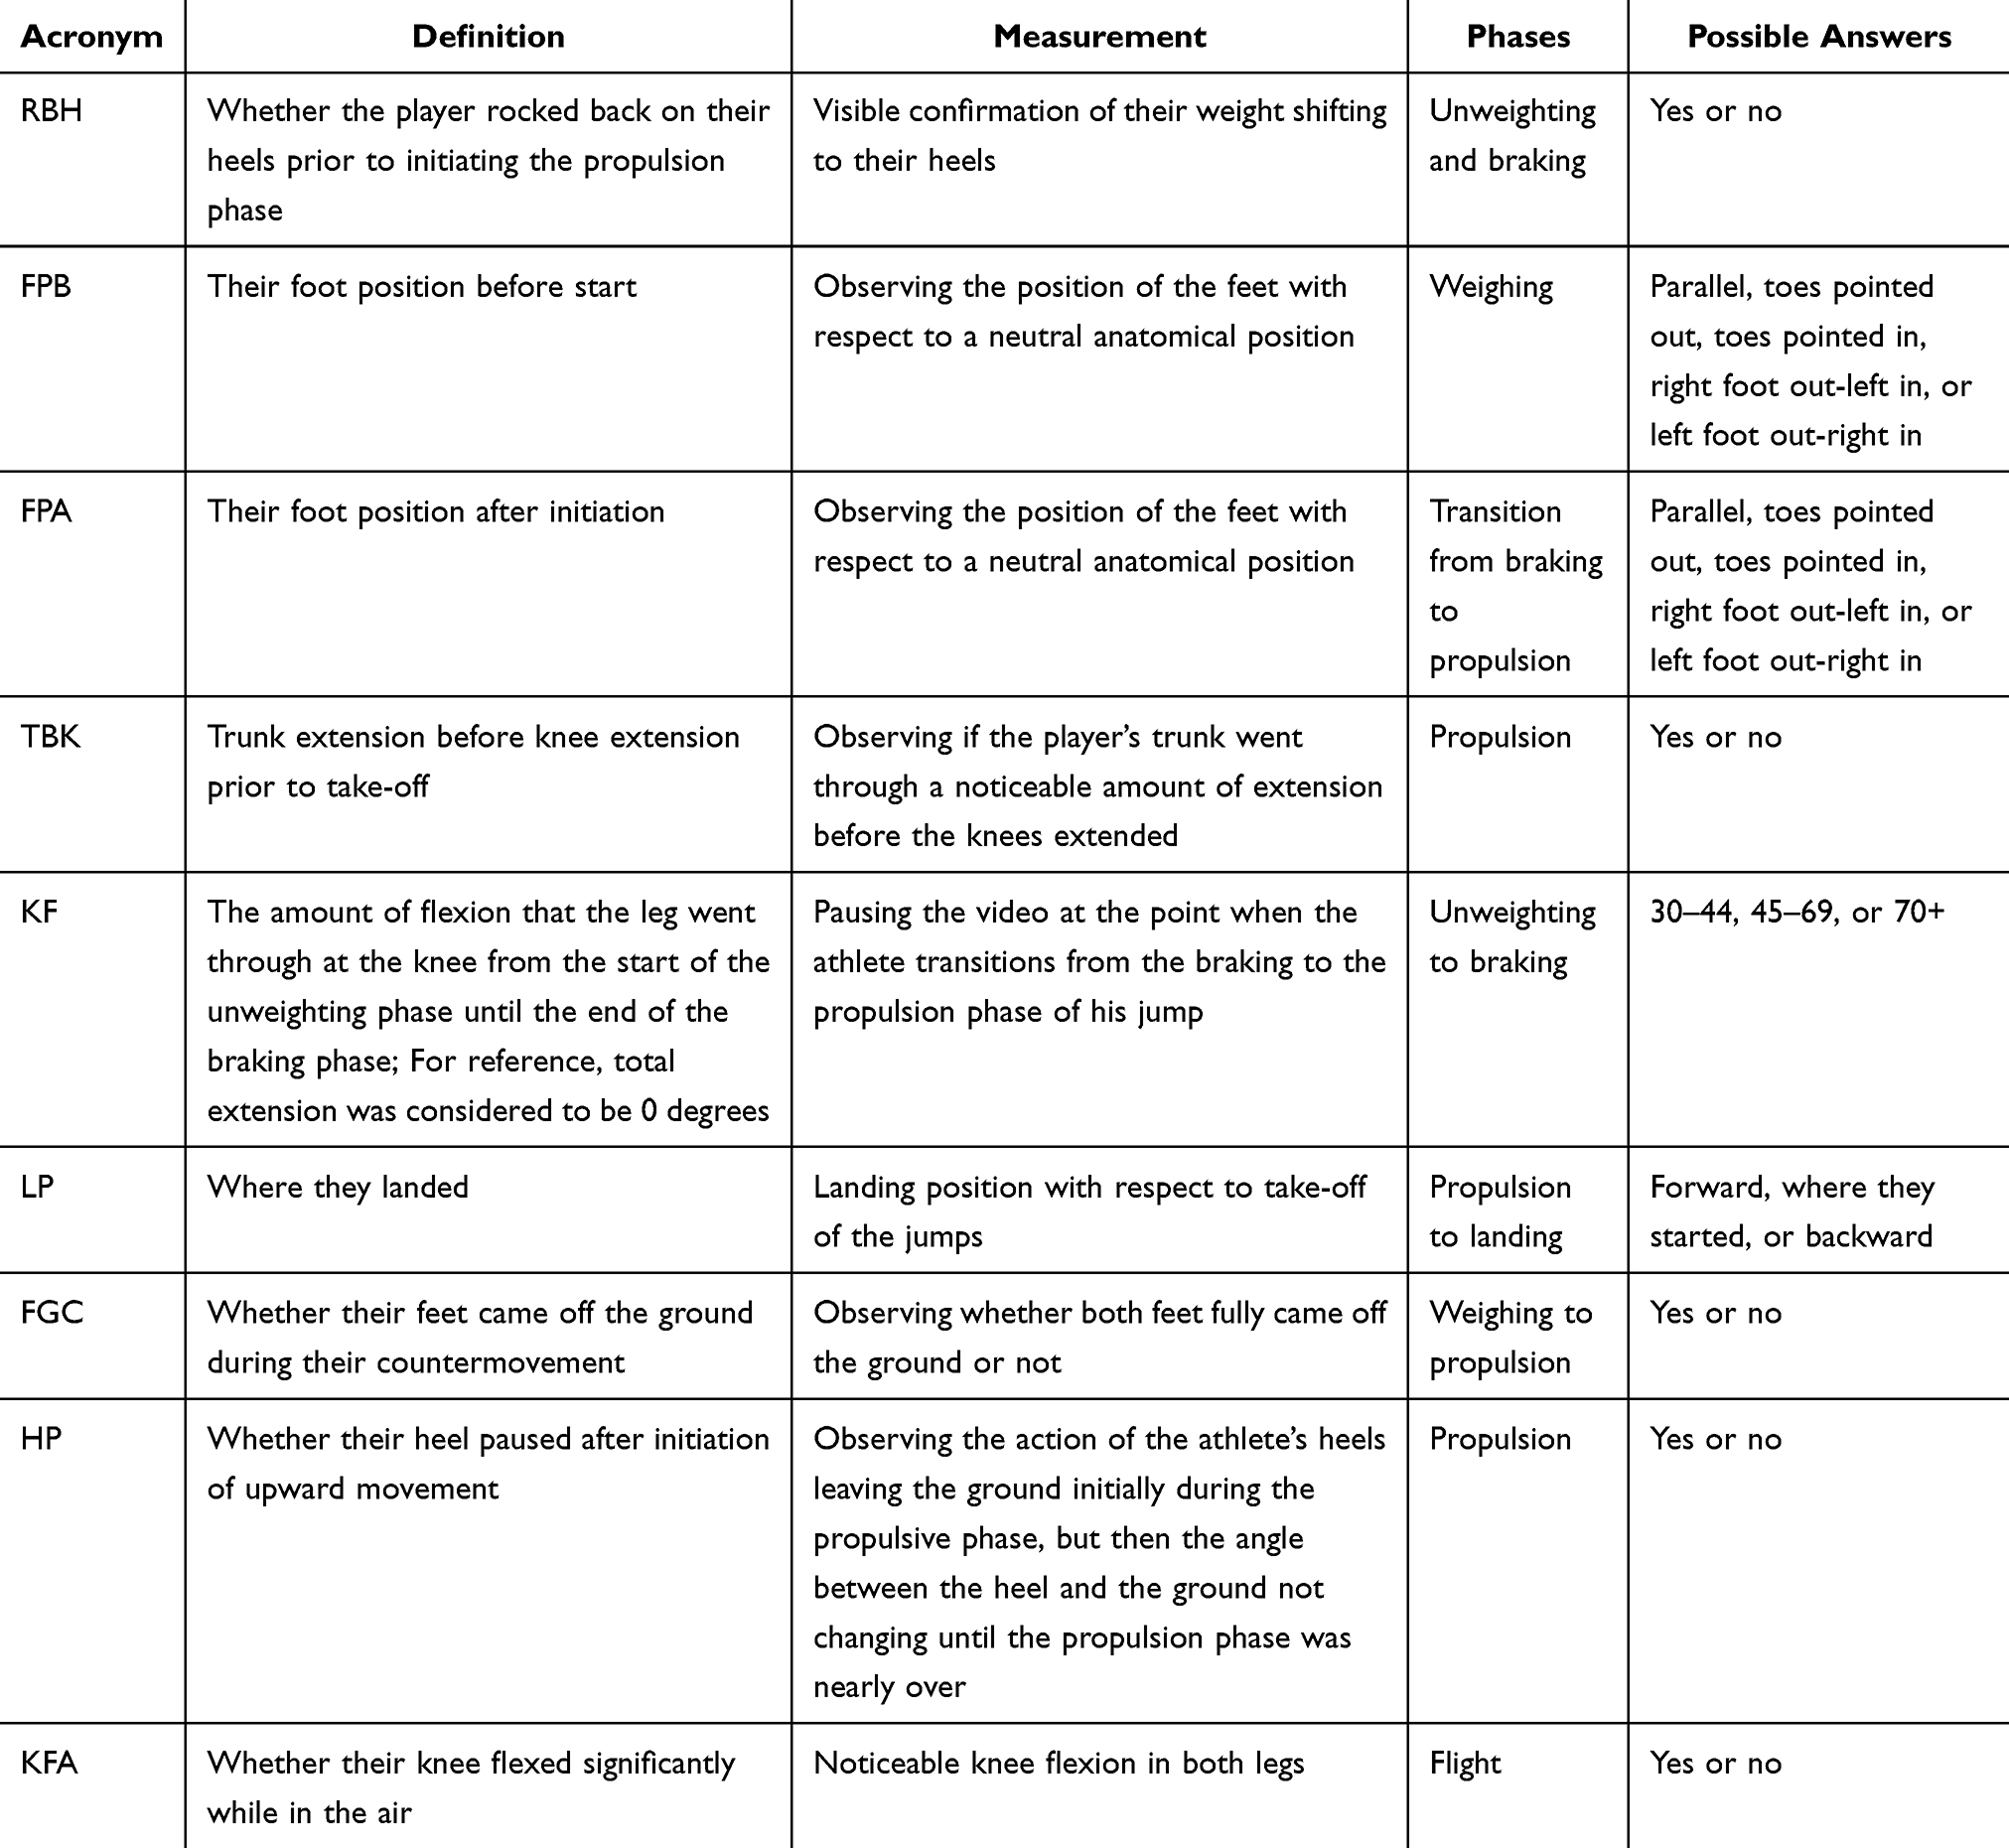 |
Table 1 List of Component Acronyms and a Description of How They Were Measured |
Each players’ football position (POS), vertical jump height (JH), height (cm), and mass (kg) were also recorded from the NFL combine website.13 The components, measurements, and demographics collected by the investigators were then compiled into a single database, and a final decision on conflicting variable analyses was made through a consensus of the three investigators. If a decision was not agreed upon by the three reviewers for variables with three or more choices, a fourth field expert (WW) served as the tiebreaker.
Approximate Value (AV), produced by ProFootballReference, was used as an estimate of the athlete’s performance during the season. AV metric mathematically quantifies the athlete’s overall performance in a single season based on various factors15 and has been utilized in the literature to evaluate performance before and after a sport injury.16 In the present study, AVs of the first season following combines (rookie season) were utilized for analysis. Since AVs increase with every single game played, AV-per-game was computed to normalize the variable for all players. The normalized AV, therefore, will account for missed games during a season. For this metric, the athletes were separated into groups based on the groupings in the mathematical calculation for AV and the differences in responsibilities per position in the sport. So, offensive and defensive linemen were grouped together, and all other positions were analyzed individually.
An additional database of measures from every player who has attended the NFL combine was created for comparative analysis to the players included in this study. The measures, including height, mass, vertical jump height, and year drafted, were acquired from Pro Football Reference.17 The database of all NFL combine results from 2000 to 2023 was used to get statistics on all players’ jump heights, mass, normalized jump heights, and the percentile ranks of the population.
Statistical Analysis
The dataset was screened for missing data and outliers using the interquartile (IQR) method. The predictor variables included RBH, FPB, FPA, POS, TBK, KF, LP, FGC, HP, and KFA. Normalized JHs and AVs were treated as outcome variables separately. To determine the best predictor(s) of combine jump height performances and rookie season performances (AV), a separate stepwise linear regression model using bidirectional elimination was fitted to each dataset (CMJs and AVs). The alpha-to-remove was set to 0.15, and the alpha-to-keep was set to 0.05 to allow for a less stringent removal criteria to avoid exclusion of potentially important predictors during the backward passes. The Akaike Information Criterion (AIC) was used to select the final model that optimizes the goodness of fit while minimizing model complexity. Lower AIC values indicate better model fit after accounting for model parsimony. The underlying assumptions of the linear regression model (linearity, homoscedasticity, normality and independence of residuals) were checked using residual plots and the Shapiro–Wilk test. Multicollinearity was assessed by examining variance inflation factors (VIF).
To further analyze whether predictors influenced jump height differently for high versus low performers, the data was split into the top and the bottom 25th percentile of jump heights (n = 13 in each group). Separate stepwise regression models were then run on each group with the same initial set of predictors. The final models obtained from the stepwise regression contained the most relevant predictors within each performance group. Standardized beta coefficients were used to compare the relative contributions of the variables. The overall fit was assessed using the model R2 and F-test for overall significance. The significance level was set at 0.05 for all tests.
All analyses were conducted using R statistical software (R Core Team, 2018, Version 4.3.1).
Results
There was no missing data in the dataset, and inspection of interquartile ranges revealed no extreme outliers. Unless otherwise stated, all descriptive statistics of the variables are reported in mean and standard deviation (mean(SD)). Descriptive statistics are reported in Table 2, along with position specific descriptive statistics in Table 3. Supplementary Figure 1 shows a flowchart of the positions of the players.
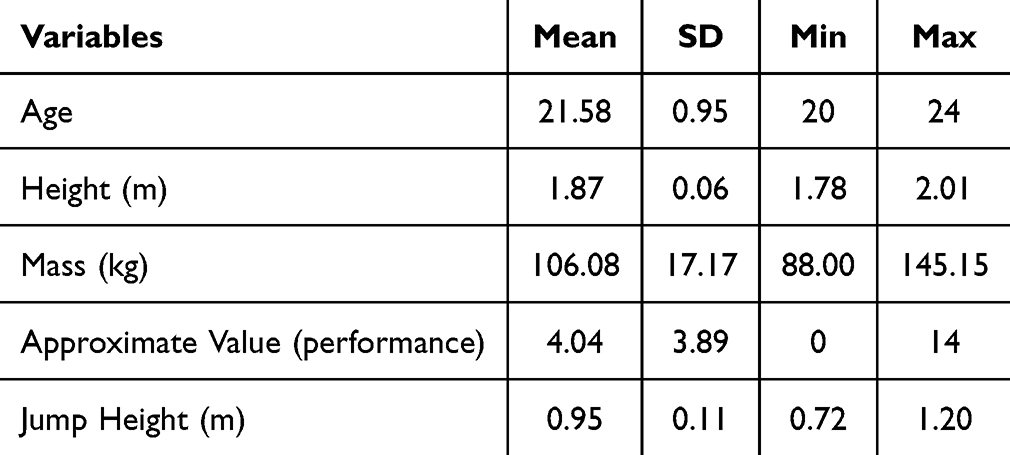 |
Table 2 Participant Demographics |
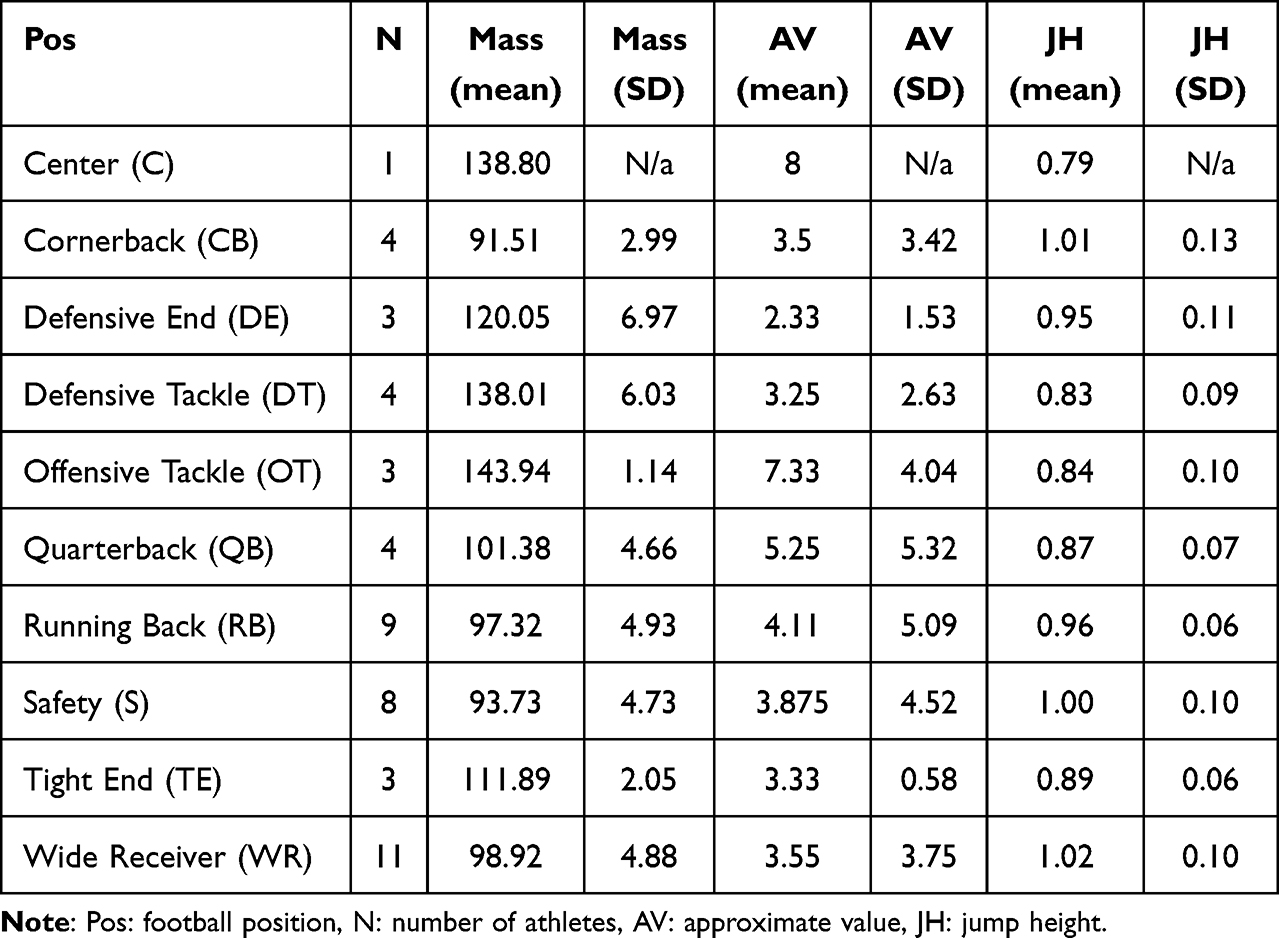 |
Table 3 Participant Demographics by Position |
A stepwise bidirectional regression analysis was conducted to determine which jump components were predictive of normalized jump height. The stepwise linear regression for the overall sample retained eight predictors (out of 10 entered predictors) in the final model, which explained 69% of the variance in normalized jump height (adjusted R2 = 0.475, F(20,29) = 3.213, p = 0.002). Table 4 shows the coefficient estimates, standard errors, t-values, and significance levels for each predictor in the final model.
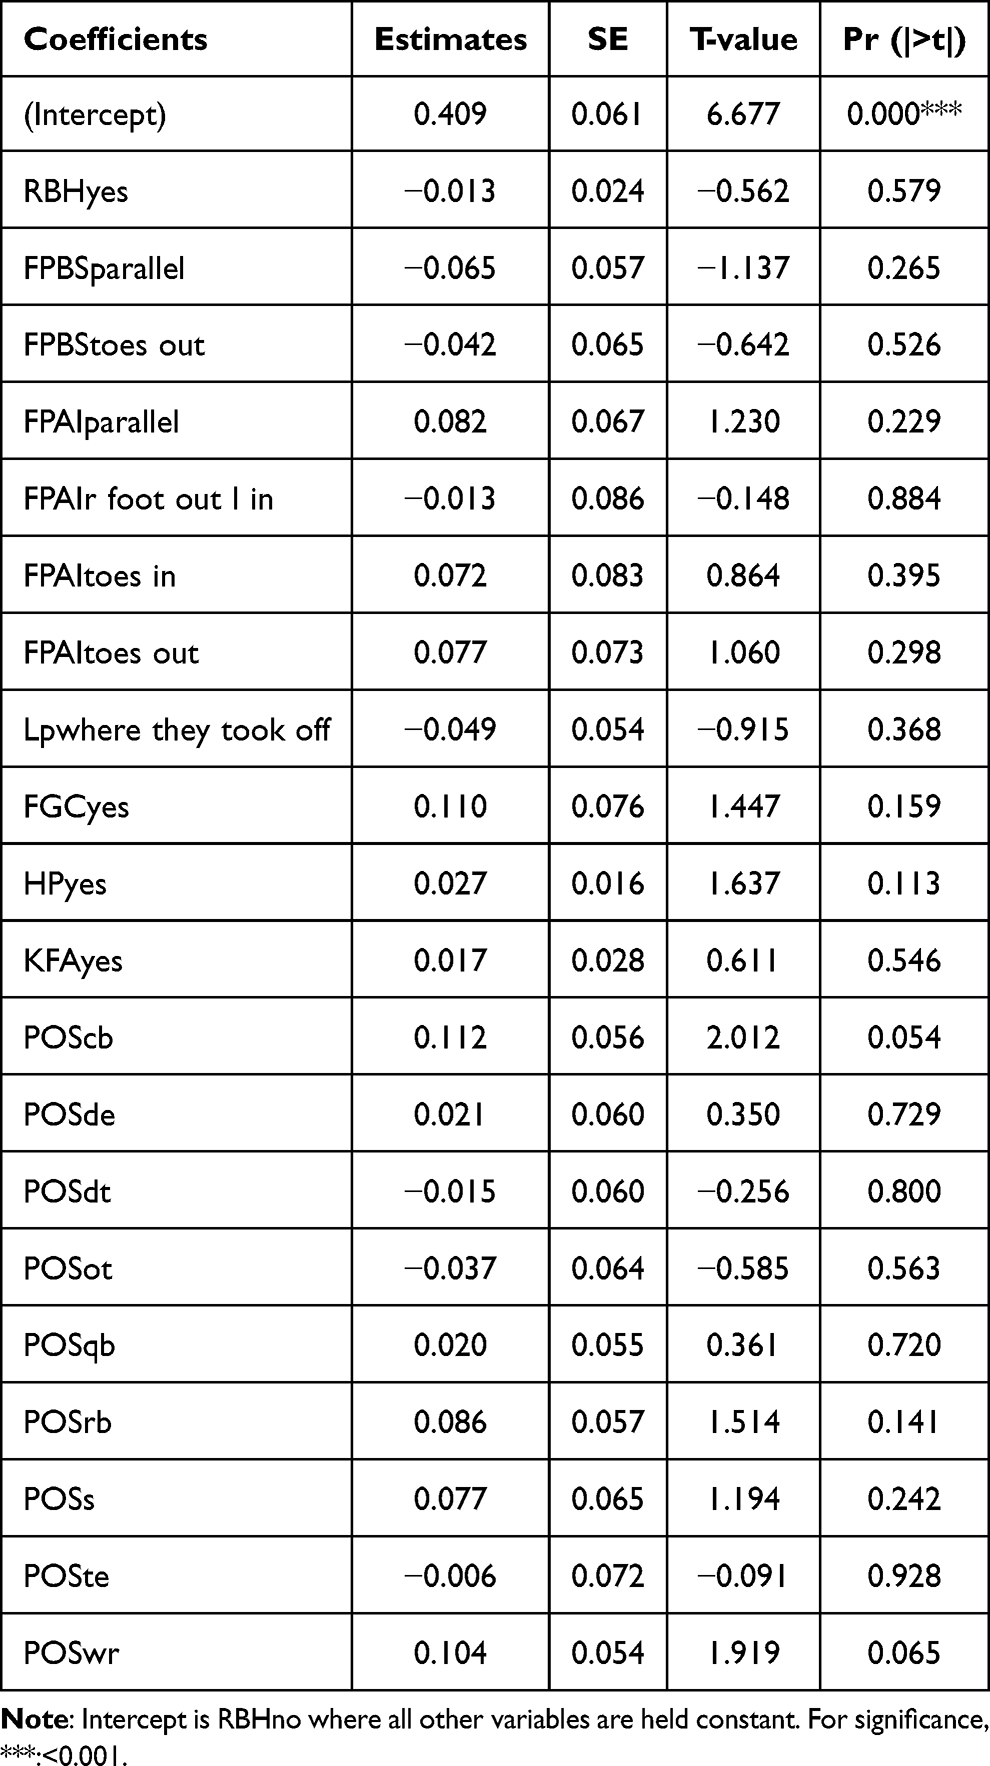 |
Table 4 Results from Stepwise Linear Regression Final Model for the Overall Dataset with Normalized Jump Height as the Outcome |
Predictors retained in the model were RBH, FPB, FPA, LP, FGC, HP, KFA, and POS. FGC (β = 0.11, p = 0.159) had a small positive standardized beta coefficient but did not reach statistical significance. The remaining components, RBH, FPB, FPA, HP, KFA and LP, all had smaller, non-significance coefficients (all β < 0.05, p > 0.05), suggesting these factors did not individually significantly predict jump height in this sample. WR (POSwr: β = 0.10, p = 0.065) and CB (POScb: β = 0.11, p = 0.054) had moderate positive coefficients approaching significance. To examine if any of the predictor variables would individually influence CMJ performances, a linear regression was performed and demonstrated evidence that rocking back on heels (RBHyes; F(1,48) = 4.12, p = 0.048), feet coming off during countermovement (FGCyes; F(1,48) = 4.48, p = 0.04), and player positions (F(9,40) = 5.03, p < 0.001) individually influenced the CMJ performance.
To assess whether predictors had differential effects for high versus low performers, separate stepwise regression models were built for the upper and lower quartiles of jump height (n = 13 each). For the higher performance group, the model explained 99% of the variance (R2 = 0.9875) in normalized jump height among higher performing athletes. The adjusted R-squared was 0.85, controlling for the number of predictors in the model, but was not statistically significant (F(11, 1) = 7.19, p = 0.284). As with the overall model shown in Table 5, no individual predictors had significant coefficients (all p >0 0.05) in this subgroup.
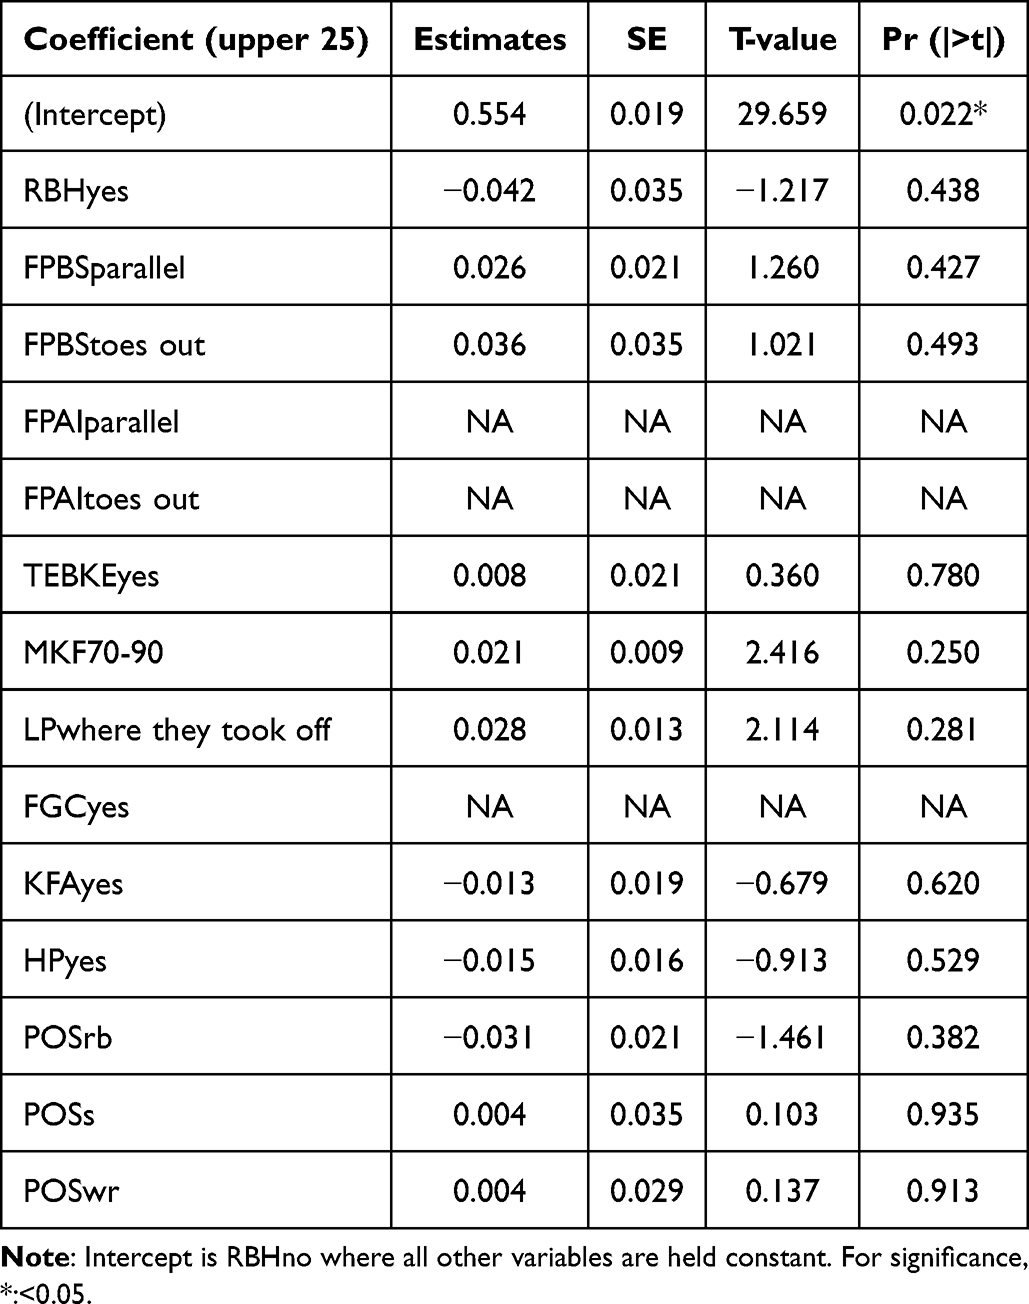 |
Table 5 Results from the Stepwise Regression Model for the High Performing Group with Normalized Jump Height as the Outcome |
For the lower performance group (bottom 25th percentile), the stepwise regression resulted in a model with 3 predictors (RBH, FPB, and POS). This model explained 84% of the total variance (R2 = 0.84) in normalized jump height for lower performing athletes. However, the adjusted R-squared value, which accounts for the number of parameters, was only 0.038 for the model (3.8%). The overall model, shown in Table 6, was not statistically significant in predicting jump height (F(10,2) = 1.047, p = 0.58). Toes out foot position (FPBS) had one of the stronger negative relationships with normalized jump height (β = −0.05), though it was not significant in this model fit (p = 0.38).
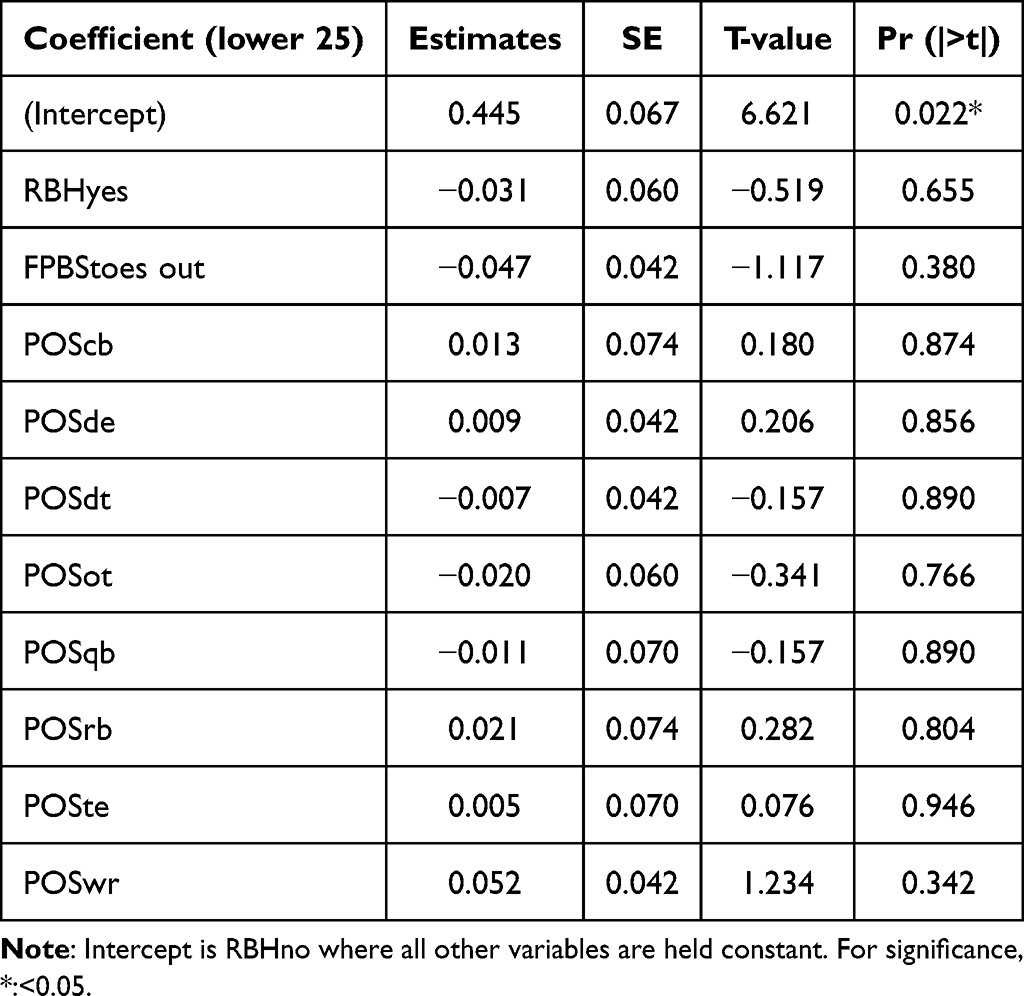 |
Table 6 Results from the Stepwise Regression Model for the Low Performing Group with Normalized Jump Height as the Outcome |
A similar stepwise bidirectional regression approach was used to determine which jump components and their interactions with player position were predictive of rookie season performance (AV per game). The initial full model contained all main effects and two-way interactions. The final model retained 15 two-way interactions that optimized the AIC criterion and explained 94.5% of the variance in AV per game (adjusted R2 = 0.659, F(36,7) = 3.309, p = 0.052). Table 7 shows the coefficient estimates for each predictor in the final rookie performance model. Notable relationships included increased performance for WR and RB demonstrating heel pauses, offensive linemen (OL) with greater knee flexion, and RB landing forward. Defensive linemen (DL) and TE with trunk extension had poorer rookie performance. Supplementary Table 1 shows the full table including the predictors that did not reach significance.
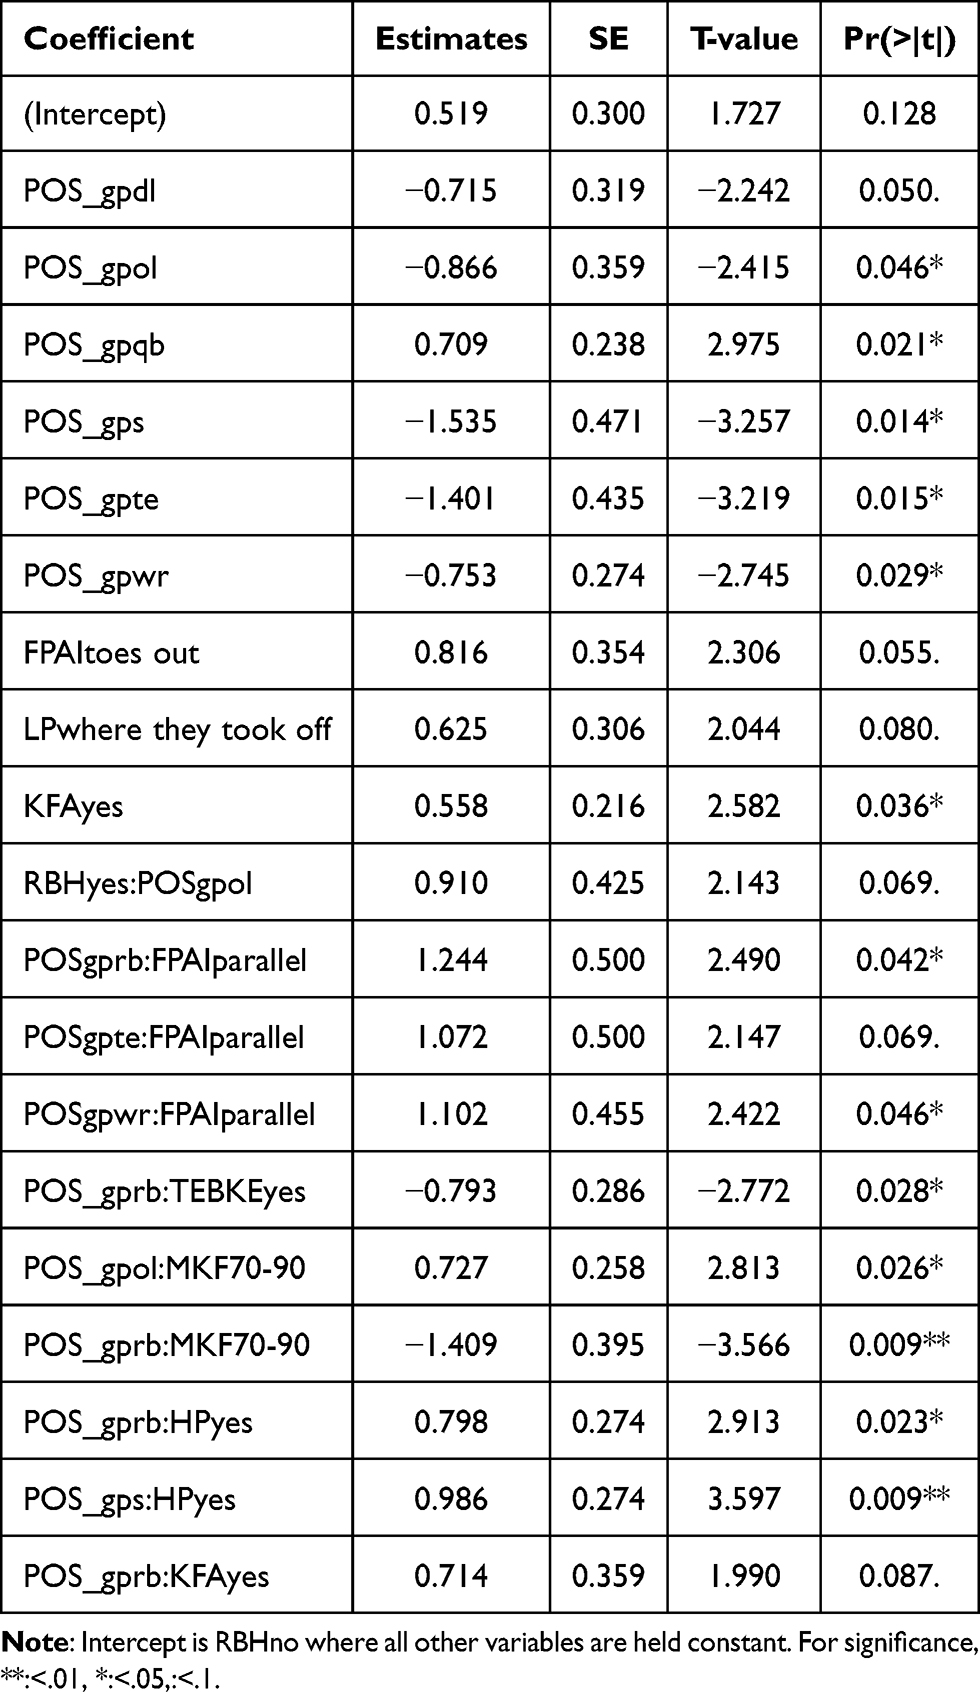 |
Table 7 All Results with a P-value of 0.1 or Less from the Stepwise Bidirectional Approach with AV per Game as the Outcome |
After screening for outliers, stepwise regression on the overall dataset for normalized jump height retained eight predictors, explaining 69% of the variance (p = 0.002). However, no single variable significantly predicted jump height. For the top 25% performers, the model explained 99% of the variance but was non-significant. Increased knee flexion had a positive relationship with jump height. For the bottom 25%, the model explained 84% of the variance but was non-significant. A toes-out foot position had a negative relationship.
For rookie AV, the model retained 15 two-way interactions, explaining 94.5% of the variance and approaching significance (p = 0.052). Notable relationships included increased AV for skilled positions demonstrating heel pauses, offensive linemen with greater knee flexion, and running backs landing forward.
Discussion
The purpose of this study was to utilize draft-eligible NFL prospects’ combine footage to analyze the components of maximal effort vertical jumps in a competitive environment. It was hypothesized that one or more of the jump components examined would influence the jump height (ie, predicted the jump height with confidence). In addition to statistically analyzing the entire dataset, the performances were split into top and bottom 25th percentile to compare how the predictor variables influenced the jump heights of the split groups. While the stepwise regression analysis explained a large variation in all three models (69–99%), only the overall dataset model was found to be statistically significant R2 = 0.69, F(20, 29) = 3.21, p = 0.002). Additionally, in the presence of other retained jump components in the final stepwise models, there was no evidence to support the influence of any single variable to predict the CMJ performance. However, evident positive or negative correlations to jump height in both the high and low performing group suggest interesting distinct techniques used by top and bottom elite performances. The regression analyses identified both individual jump components and interactions with player position that were predictive of jump height and rookie success. Mechanics related to foot positioning, countermovement, and takeoff appeared most relevant for maximal jump height. Interactions between position and mechanics were predictive of rookie performance. Eight predictors included in the final model of the overall dataset play a major role in determining the normalized jump height of the elite NFL athletes. However, the adjusted R2 (0.475) suggests that there are other jump components and factors not included in the model that also contribute to the normalized jump height. Players’ positions showed some interesting results. For example, CB and WR positions coefficient were positive and marginally significant (p = 0.054, p = 0.065, respectively) that suggests that players in these positions tend to have higher normalized jump heights compared to C. However, this provides weak evidence of a potential positive relationship between these player positions and jump height that would need to be confirmed in larger samples. When each predictor variable’s influence on vertical jump height was analyzed, three predictors (RBH, FGC, and POS) had a significant influence on the normalized jump height, which warrant further studies in controlled environments to identify the underlying mechanisms.
Previous studies have evaluated sport injury using a similar video analysis method as this study.9–12 In studies on NFL athletes in combines, there are a few studies that focused on linear sprint mechanics of the 40 yard dash test.18–20 For studies that utilized biomechanical principles in NFL, they primarily investigated the biomechanics of concussions.21,22 There are only a limited number of studies that biomechanically analyze professional NFL players’ performances, with only one study on the combine results.23–25 The present study aimed to evaluate the NFL players’ performance during their combine to better understand the professional players’ biomechanics in an intense competition setting. This was made possible due to high-quality official videos of the combines and sophisticated software to help allied health professionals and coaches with in-depth actionable performance metrics. The main dataset was split into a high performers group (75th percentile and above) and a low performers group (25th percentile and below). To verify if our dataset is representative of overall NFL combine performances, the past 23 years of NFL combine performances were compiled to compare with the included 50 players’ jump performances in the present study. Compared to the compiled comprehensive NFL combine data, high performers’ CMJ performances fell within the top three percentile (97–99%). On the other hand, the low performers group fell within a wider range, between the 15th and 58th percentile. Therefore, the top 25% of subjects in our study were not representative of the top 25% of all NFL prospects, and, rather, they represented a much more elite population. Indeed, some of the included players were in the highest jumpers to ever attend the NFL Combine. Also, the bottom 25% in our study actually represented a much broader population of NFL prospects (>25%). The difference in representation between this study’s groups and the overall population was likely due to a bias toward posting the videos of elite jumpers since that is what the general population would be more likely to engage with in the media. This stratification of performances of those evaluated in this study could explain the differences in the retained predictor variables for each subgroup, and why the top performing group’s model explained a larger portion of the variance in the CMJ performances than their counterparts.
For the lower performers, rocking back on the heels (RBHyes) and foot position before start (FPBtoes out) had negative coefficient, indicating toes out and rocking back on the heels before countermovement was associated with lower jump heights in this group; however, there were no statistical evidence (p > 0.05) to support this observation. This may be due to sample size for each predictor variable. Albeit with little research on foot position in the transverse plane involving vertical jumps, one study did find that an extreme toes out position negatively affected vertical jump height compared to a neutral position.26 Having toes out foot position before the start of the countermovement could imply that the athlete’s hips are externally rotated along with his feet, since the knees would be fully extended. Before initiating their CMJ from a neutral stance, the athlete’s position could indicate tight hip external rotators or weak internal rotators. Since most of the external rotators of the hip are also hip extensors, their hip extensors could also be tight. The hip extensors being tight and starting in a shortened position could compromise the effectiveness of the stretch-shortening cycle in those muscles, leading to a shorter CMJ height.
In contrast to the low performing group, the model for higher performers retained more variables to predict the jump performance, although none of the variables reached statistical significance in their influence. Interestingly, similar to the low performing group, rocking back on the heel had a negative coefficient that suggested a reduction in jump height when present. Intuitively, since CMJ performance is uniplanar, it is possible that any shifting of the center of mass outside of this plane is energy spent outside of the objective. Among other predictor variables retained in this stepwise regression model was a higher magnitude of knee flexion at the bottom of the countermovement, which had a positive coefficient in predicting the jump height performance. Gheller et al (2015) observed a similar pattern, where increased squat depth resulted in an increased jump height in both squat jumps and countermovement jumps in both basketball and volleyball athletes.27 Previous studies hypothesized that even if someone jumps the same height from a deeper squat position as they do from their preferred depth, they should be able to quickly learn the new deeper motion and improve their jump height.28 It is well established that increasing squat depth is associated with higher vertical jumps and corroborates our findings in the high performing group.
Playing position also differed between high and low performers. Notably, the high performing group consisted of players who play four different positions (RB, WR, CB, S), and the low performing group had players who play nine different positions (OT, DT, QB, DE, C, TE, CB, RB, WR). Similar demands from players (or positions) on the field may explain why the model for the high performing group explains 99% of the variance as opposed to 84% for the low performing group. Sanchez et al found significant differences in multiple different in-game movement demands for different positions, including the highest amount of acceleration and deceleration moments for WR and defensive back (CB & S).29 Another explanation could be that when referring to the entire population of NFL prospects, the high performers group has very similar results, while the low performers group is more widespread. Of note, being an RB in the top performing group had the strongest negative coefficient out of all positions retained in the model, while it had the strongest positive coefficient for the low performing group. Interestingly, only three positions were found to adequately predict the jump height in the high performing group compared with the eight for the lower performing group. Merrigan et al found that hybrid athletes (TE, RB, LB) had lower average jump heights than skill athletes (WR, CB, S).30 Our study points to this direction, where a weak positive association between WR and CB and JH was demonstrated. The top performers group included only WR, CB, S, and RB, so the present study’s findings corroborate previous literature. The difference in performance in the high performers group between RB and WR, CB, and S may be caused by the different skills required by each position. Successful WR, CB, and S will need to have a high CMJ to win 50–50 balls in the air during the play. Also, as previously mentioned, the highest amount of acceleration and deceleration moments occurred with WR and defensive backs, generating a need for quick force generation from their lower extremity, similar to performing a vertical jump.29 Another factor could be that RB generally weigh more because of their duties near the line of scrimmage and to carry more muscle to deal with the constant hits taken in that position.31
Regarding player performance, only rookie season AV was used because of the proximity to the videos that were used. The final stepwise bidirectional regression model retained 15 two-way interactions that optimized the AIC criterion and explained 94.5% of the variance in AV per game (adjusted R2 = 0.659, F(36,7) = 3.309, p = 0.052). Notable relationships included increased performance for WR and RB who demonstrated heel pauses, OL with greater knee flexion, and RB landing forward. For the OL, greater knee flexion may demonstrate an ability to produce force through a wider range of motion, benefiting their adaptability on the field to block in many different scenarios or show an ability to get a lower center of mass than your opponent, creating an advantage while blocking.32 For RB, landing forward on the CMJ test could just be a proclivity for always falling forward, which is a good trait to have for that position since they can get every possible yard out of a run. DL and TE with trunk extension before knee extension had poorer rookie performance. If the biomechanics of their vertical jump translates to their movement on the field and these players are raising their chest during initiation of force at the line of scrimmage, they may be losing leverage due to a more posterior center of gravity and could be knocked back onto their heels with a lower force required from the opposition.32 Developing a model to predict on-field performance from these biomechanical variables can lead to greater knowledge of tendencies and movement patterns that separate the best athletes from the rest of an already elite group.
Limitations
CMJs are complex sequential movements with components that were subjectively indicated, which could result in biased and inaccurate indications. In this study, we utilized the scores independently provided by three investigators and merged them through a consensus process. Additionally, incorporating binomial variables, such as definitive “Yes” and “No” variables, reduces the potential influence of subjective measures in the analysis.12 This means that while data was collected about whether athletes did one thing or another during their vertical jump, the magnitude of that position was not a factor. The way we addressed this issue was by including more reviewers so that the subjective identification of the predictors was more likely to be accurately collected. Although athletes analyzed in this study were elite and specialized in diverse positions in American Football, all were male and from one sport, there are currently very limited similar competitions data available from any other national league or internal qualifiers. This work highlights the importance of aggregating data to improve performance and technique for all athletes.
Conclusion
NFL athletes’ combine countermovement jumps were examined to determine the movement components that best predicted their performances. Predictor variables retained in the model explained a large variance in the performance and impacted the jump heights differently for high and low performing athletes. The models’ results showed potential to identify components that could enhance countermovement jump performance among several positions in the NFL. Low sample size and number of datapoints per predictor variable reduced the statistical power, which was a limitation of the study. Although this study is one of the first of its kind and had limitations, it should be used as an inspiration for other versions of data analysis that can give insight into certain aspects of human movement that can be expanded upon in a laboratory setting. Future studies should focus on utilizing this technique on various other sports to generalize biomechanical analysis for sports performance.
Data Sharing Statement
The data evaluated in this project were extracted from videos and databases in the public domain from the following sources: https://www.youtube.com/watch?v=sXwfeX8ma88&ab_channel=NFL, https://www.youtube.com/watch?v=WjszgDFgb_4&ab_channel=SanFrancisco49ers, https://www.youtube.com/watch?v=-qXYA0Ol5Qg&ab_channel=NFL, https://www.youtube.com/watch?v=y3ItDugEYg0&ab_channel=NFL, https://www.youtube.com/watch?v=x76e2G5t770&ab_channel=NFL, https://www.youtube.com/watch?v=NZ3BrZUsYj4&ab_channel=NFL, https://www.youtube.com/watch?v=Bc9fG3xaVqQ, https://www.youtube.com/watch?v=UUqWQNGYGAA&ab_channel=NFL, https://www.youtube.com/watch?v=DIIsMTNLx7Q&ab_channel=NFL, https://www.youtube.com/watch?v=iTfj7LH-aOk&ab_channel=NFL, https://www.youtube.com/watch?v=Ppeu6Mm4cT8&ab_channel=NFL, https://www.youtube.com/watch?v=Oko9qnYgoxU, https://www.youtube.com/watch?v=IbXcgE4w9JE&ab_channel=sportstube, https://www.youtube.com/watch?v=−0f7FQ8DWYk&ab_channel=NFL, https://www.youtube.com/shorts/tHgB_25df-Y, https://www.youtube.com/watch?v=BhnLD41Zi9Y&ab_channel=NBAGametime, https://www.youtube.com/watch?v=YEnOM0nUJmA&ab_channel=FootballFilms, https://www.detroitlions.com/video/myles-garrett-astonishes-with-41-inch-vertical-jump-at-nfl-combine-18615688, https://www.nfl.com/videos/donovan-peoples-jones-leaps-44-5-on-vertical-jump, https://www.youtube.com/shorts/noaV4PHmACs, https://www.youtube.com/watch?v=af4oD0TVpv0&ab_channel=NFL, https://www.pro-football-reference.com/draft/, https://www.pro-football-reference.com/about/approximate_value.htm, https://www.nfl.com/combine/.
Ethics Statement
This project was approved by the Auburn University IRB, Protocol #: 24-732 EX 2403.
Disclosure
The authors have no conflicts of interest to declare. The authors did not receive funding for this project.
References
1. Cormack SJ, Newton RU, McGuigan MR, Doyle TLA. Reliability of Measures Obtained During Single and Repeated Countermovement Jumps. Inte J Sports Physio Perform. 2008;3(2):131–144. doi:10.1123/ijspp.3.2.131
2. Redler LH, Watling JP, Dennis ER, Swart E, Ahmad CS. Reliability of a field-based drop vertical jump screening test for ACL injury risk assessment. Physic Sports Med. 2016;44(1):46–52. doi:10.1080/00913847.2016.1131107
3. Four things to watch for at 2022 NFL Scouting Combine. NFL.com.
4. Moura T, Okazaki V. Kinematic and kinetic variable determinants on vertical jump performance a review. MOJ Sports Medicine. 2022;5:25–33. doi:10.15406/mojsm.2022.05.00113
5. Claudino JG, Cronin J, Mezêncio B, et al. The countermovement jump to monitor neuromuscular status: a meta-analysis. J Sci Med Sport. 2017;20(4):397–402. doi:10.1016/j.jsams.2016.08.011
6. Van Hooren B, Zolotarjova J. The Difference Between Countermovement and Squat Jump Performances: a Review of Underlying Mechanisms With Practical Applications. J Strength Cond Res. 2017;31(7):2011. doi:10.1519/JSC.0000000000001913
7. Academy USS. The Effects of Competitive Orientation on Performance in Competition. The Sport Journal. https://thesportjournal.org/article/the-effects-of-competitive-orientation-on-performance-in-competition/.
8. Top Broad & Vertical Jumps | 2019 NFL Scouting Combine Highlights; 2019.
9. Araújo R, Ferreira JJ, Antonini A, Bloem BR. “Gunslinger’s gait”: a new cause of unilaterally reduced arm swing. BMJ. 2015;351:h6141. doi:10.1136/bmj.h6141
10. Kwon JY, Chacko AT, Kadzielski JJ, Appleton PT, Rodriguez EK. A Novel Methodology for the Study of Injury Mechanism: ankle Fracture Analysis Using Injury Videos Posted on YouTube.com. J of Orthop Trauma. 2010;24(8):477. doi:10.1097/BOT.0b013e3181c99264
11. Schreiber JJ, Warren RF, Hotchkiss RN, Daluiski A. An Online Video Investigation Into the Mechanism of Elbow Dislocation. J Hand Surg. 2013;38(3):488–494. doi:10.1016/j.jhsa.2012.12.017
12. Yüce A, Oto O, Misir A. Systemic video analysis of hamstring injury mechanism for professional athletes: sprint-type injuries occurring during the swing phase of the running cycle. Med Sport. 2022;75(3). doi:10.23736/S0025-7826.22.04121-7
13. NFL.com | official Site of the National Football League. NFL.com.
14. McMahon JJ, Suchomel TJ, Lake JP, Comfort P. Understanding the Key Phases of the Countermovement Jump Force-Time Curve. Streng Condi J. 2018;40(4):96–106. doi:10.1519/SSC.0000000000000375
15. Approximate Value. Pro-Football-Reference.com.
16. Khalil LS, Lindsay-Rivera KG, Abbas MJ, et al. Game Utilization and Performance Following RTP From ACL Reconstruction Does not Influence a Subsequent Second ACL Injury in National Football League Players. Arthro Sport Med Rehabili. 2021;3(5):e1377–e1385. doi:10.1016/j.asmr.2021.07.002
17. NFL and AFL Draft History. Pro-Football-Reference.com.
18. Clark KP, Rieger RH, Bruno RF, Stearne DJ. The National Football League Combine 40-yd Dash: how Important is Maximum Velocity? J Strength Cond Res. 2019;33(6):1542. doi:10.1519/JSC.0000000000002081
19. Gillen ZM. Position-Specific Differences in Speed Profiles Among National Football League Scouting Combine Participants. J Strength Cond Res. doi:10.1519/JSC.0000000000004958
20. Kent RW, Lievers WB, Riley PO, Frimenko RE, Crandall JR. Etiology and Biomechanics of Tarsometatarsal Injuries in Professional Football Players: a Video Analysis. Orthopaedic J Sports Med. 2014;2(3):2325967114525347. doi:10.1177/2325967114525347
21. Kelley M, Urban J, Jones D, et al. Football concussion case series using biomechanical and video analysis. Neurology. 2018;91(23_Supplement_1):S2–S2. doi:10.1212/01.wnl.0000550623.36010.20
22. Hickey KC, Quatman CE, Myer GD, Ford KR, Brosky JA, Hewett TE. Methodological Report: dynamic Field Tests Used in an NFL Combine Setting to Identify Lower-Extremity Functional Asymmetries. J Strength Cond Res. 2009;23(9):2500. doi:10.1519/JSC.0b013e3181b1f77b
23. Riley PO, Kent RW, Dierks TA, Lievers WB, Frimenko RE, Crandall JR. Foot kinematics and loading of professional athletes in American football-specific tasks. Gait Posture. 2013;38(4):563–569. doi:10.1016/j.gaitpost.2012.03.034
24. Pollock JR, Doan MK, Asprey WL, et al. Can NFL Combine Results be Used to Estimate NFL Defensive Players Longevity? Sports Med Intern Open. 2021:5:E59–E64. doi:10.1055/a-1485-0031
25. Mokha GM, Berrocales M, Rohman A, et al. Morphological and Performance Biomechanics Profiles of Draft Prep American Style Football Players.
26. Alfiero CJ, Brown AF, Chun Y, Holmes A, Bailey JP. The Effect of Foot Position and Lean Mass on Jumping and Landing Mechanics in Collegiate Dancers. J Appl Biomechanics. 2022;39(1):15–21. doi:10.1123/jab.2021-0319
27. Gheller RG, Dal Pupo J, Ache-Dias J, Detanico D, Padulo J, Dos Santos SG. Effect of different knee starting angles on intersegmental coordination and performance in vertical jumps. Human Mov Scie. 2015;42:71–80. doi:10.1016/j.humov.2015.04.010
28. Domire ZJ, Challis JH. The influence of squat depth on maximal vertical jump performance. J Sports Sciences. 2007;25(2):193–200. doi:10.1080/02640410600630647
29. Sanchez E, Weiss L, Williams T, et al. Positional Movement Demands during NFL Football Games: a 3-Year Review. Appl Sci. 2023;13(16):9278. doi:10.3390/app13169278
30. Merrigan JJ, Rentz LE, Hornsby WG, et al. Comparisons of Countermovement Jump Force-Time Characteristics Among National Collegiate Athletic Association Division I American Football Athletes: use of Principal Component Analysis. J Strength Cond Res. 2022;36(2):411. doi:10.1519/JSC.0000000000004173
31. Lockie RG, Lazar A, Orjalo AJ, et al. Profiling of Junior College Football Players and Differences between Position Groups. Sports. 2016;4(3):41. doi:10.3390/sports4030041
32. Gay T. Football Physics: The Science of the Game. Harmony/Rodale; 2004.
 © 2024 The Author(s). This work is published and licensed by Dove Medical Press Limited. The
full terms of this license are available at https://www.dovepress.com/terms.php
and incorporate the Creative Commons Attribution
- Non Commercial (unported, 3.0) License.
By accessing the work you hereby accept the Terms. Non-commercial uses of the work are permitted
without any further permission from Dove Medical Press Limited, provided the work is properly
attributed. For permission for commercial use of this work, please see paragraphs 4.2 and 5 of our Terms.
© 2024 The Author(s). This work is published and licensed by Dove Medical Press Limited. The
full terms of this license are available at https://www.dovepress.com/terms.php
and incorporate the Creative Commons Attribution
- Non Commercial (unported, 3.0) License.
By accessing the work you hereby accept the Terms. Non-commercial uses of the work are permitted
without any further permission from Dove Medical Press Limited, provided the work is properly
attributed. For permission for commercial use of this work, please see paragraphs 4.2 and 5 of our Terms.