")
Back to Journals » Diabetes, Metabolic Syndrome and Obesity » Volume 18
Correlations Between TyG-Related Indices and Bone Health: A Cross-Sectional Study of Osteoporosis in a Rural Chinese Population
Authors Jia F, Lu Y , Wen H, Tu J, Ning X, Wang J , Li P
Received 6 November 2024
Accepted for publication 22 April 2025
Published 7 May 2025 Volume 2025:18 Pages 1445—1458
DOI https://doi.org/10.2147/DMSO.S505024
Checked for plagiarism Yes
Review by Single anonymous peer review
Peer reviewer comments 3
Editor who approved publication: Professor Jae Woong Sull
Fang Jia,1,* Yuting Lu,2,* Haotian Wen,3 Jun Tu,4– 6 Xianjia Ning,4– 6 Jinghua Wang,4– 6 Ping Li1
1Department of Anesthesia, Tianjin Hospital, Tianjin, 300211, People’s Republic of China; 2School of Basic Medical Sciences, Tianjin Medical University, Tianjin, 300070, People’s Republic of China; 3The First Clinical School of Southern Medical University, Guangzhou, Guangdong Province, 510515, People’s Republic of China; 4Department of Neurology, Tianjin Medical University General Hospital, Tianjin, 300052, People’s Republic of China; 5Laboratory of Epidemiology, Tianjin Neurological Institute, Tianjin, 300052, People’s Republic of China; 6Tianjin Neurological Institute, Key Laboratory of Post-Neuroinjury Neuro-Repair and Regeneration in Central Nervous System, Ministry of Education and Tianjin City, Tianjin, 300052, People’s Republic of China
*These authors contributed equally to this work
Correspondence: Ping Li, Department of Anesthesia, Tianjin Hospital, 406 Jiefang Road, Hexi District, Tianjin, 300211, People’s Republic of China, Tel +86-22-60913000, Fax +86-22-60910608, Email [email protected]
Background: Osteoporosis (OP) is a major metabolic bone disease with significant health and socioeconomic impacts. The triglyceride-glucose (TyG) index and its derivatives, which reflect insulin resistance (IR), may play a role in bone metabolism. However, the relationship between TyG indices and OP is unclear. This study aimed to explore the association between TyG indices and OP in a low-income rural Chinese population.
Methods: This cross-sectional study was conducted in rural Tianjin, China, in 2020. Participants aged 60 years or older were included. Data were collected through interviews, including sociodemographic and clinical information, and physical examinations. Bone mineral density (BMD) of the femoral neck was measured using dual-energy X-ray absorptiometry (DXA). Multivariate regression models and restricted cubic spline (RCS) curves were used to assess the relationships between TyG indices and OP.
Results: A total of 437 individuals were included in the final analysis, with 38 diagnosed with osteoporosis (prevalence of 8.7%). After adjusting for all covariates, each 1-unit increase in triglyceride-glucose-body mass index (TyG-BMI) was associated with a 2% lower risk of osteoporosis, (OR: 0.98, 95% CI: 0.96– 1.00, P=0.029), especially in women, individuals with hypertension, and non-diabetic populations. The OP risk of the fourth quartile (Q4) of the triglyceride-glucose-waist circumference (TyG-WC) index after correcting for all covariates is 5.58 times that of the first quartile (Q1)(OR: 5.58, 95% CI: 1.14– 27.41, P=0.034). Linear regression showed a positive correlation between TyG-BMI and BMD, particularly in women, individuals under 70, and those with hypertension or non-hypertension, with the strongest correlation in the non-hypertensive group.
Conclusion: TyG-related indices are associated with OP, suggesting a potential role in the early prevention and management of osteoporosis in this population, ultimately improving public health outcomes.
Keywords: triglyceride glucose, triglyceride glucose-waist circumference, osteoporosis, bone mineral density, restricted cubic spline
Introduction
Osteoporosis (OP) is a metabolic bone disease characterized by low bone mass and the deterioration of bone tissue microarchitecture, leading to reduced bone strength and an increased risk of low-energy or fragility fractures.1 The prevalence of OP is significantly higher in developing countries than in developed countries, with urban areas showing slightly higher rates than rural regions.2 Approximately 10 million Americans over the age of 50 suffer from OP, with an estimated 1.5 million fragility fractures occurring annually.3 The prevalence of OP in Chinese adults aged 60 and older is 37.7%, increasing with age.4 A recent large-scale cross-sectional study5 conducted in China revealed that the prevalence of OP among individuals aged 40 years and older was 5.0% in men and 20.6% in women. In 2010, OP ranked as the third leading risk factor for injuries in China,6 indirectly contributing to an increase in mortality rates. By 2025, the annual direct costs of OP are projected to reach approximately $25.3 billion.7 The average hospitalization cost for osteoporotic fractures (OPF) in China is 27,561.27 yuan, with women being the most affected, posing a significant socioeconomic burden.8
OP commonly affects the spine, hip (including the femoral neck), lumbar spine, distal radius (wrist), and proximal humerus (upper arm), with the femoral neck being the most dangerous and potentially lethal fracture, described as is the most common type of hip fracture, often referred to as the “last fracture in life” in older adults.9,10 BMD is the primary method for diagnosing OP,11 with lower BMD levels associated with higher OP risk. Elevated serum triglyceride (TG) levels are negatively correlated with Bone mineral density (BMD), while high glucose levels and advanced glycation end products (AGEs) increase the expression of sclerostin, a negative regulator of bone formation.12 Insulin signaling plays a critical role in regulating bone marrow metabolism, suggesting a link between insulin resistance (IR) and bone health.13,14 The triglyceride-glucose (TyG) index, derived from fasting blood glucose (FBG) and TG, is considered a reliable marker for IR.15,16 Obesity plays a vital role in OP development,17 and the TyG-BMI and TyG-WC indices, which combine the TyG index with obesity measures such as body mass index (BMI) and WC, are good predictors of IR.18,19
Association of TyG index with BMD is controversial. A cross-sectional study found that the TyG index was negatively correlated with femoral neck BMD in non-diabetic men and women, with the strongest correlation observed in women with a BMI < 23 kg/m².20 Similarly, the TyG index was significantly associated with lower bone mass and increased risk of OP in the femur, hip, and lumbar spine.21 In the US, the TyG index was negatively correlated with BMD, although no significant interaction was observed between gender, age, or diabetes status.22 In non-diabetic US adults, a significant positive correlation was found between the TyG-BMI index and femoral BMD, with higher TyG-BMI levels associated with a lower risk of OP, especially in postmenopausal women over 40 and men over 60.23 In middle-aged and elderly non-diabetic Chinese individuals, the TyG-BMI index was positively correlated with femoral neck BMD and negatively associated with fracture risk in both men and women.24 Xuan X. et al25 concluded that there is a non-linear association between the TyG-BMI index and femoral neck BMD in non-diabetic patients, with stronger correlations observed at higher TyG-BMI levels. The previous study observed positive correlations between the TyG-BMI and TyG-WC indices and BMD, with regression coefficients decreasing beyond certain thresholds,26 differing from other studies but consistent with findings in HIV-infected individuals.27 Some studies found no association between the TyG index and BMD or OP.28,29
However, research on the TyG-BMI index has primarily focused on non-diabetic populations, while studies on the TyG-WC index are scarce, as well as most data are derived from public databases or hospitalized patients, with no studies reporting on rural populations. Previous studies have predominantly focused on either OP or BMD as single outcomes. To gain a more comprehensive understanding of the impact of the TyG index on bone health, we have chosen OP as the primary outcome and BMD as the secondary outcome, thereby corroborating our findings from different perspectives.
Therefore, we aim to evaluate the relationship between the TyG index, its derivative indices, and OP or BMD in the femoral neck of a low-income rural Chinese population through a cross-sectional study.
Methods
Study Population
This cross-sectional study selected participants from a low-income, low-education population in rural Tianjin, China in 2020. Individuals aged 60 and older (all females were postmenopausal) without malignancies, thyroid or parathyroid dysfunction, or other diseases affecting bone metabolism were invited to participate. After excluding individuals with incomplete BMD, TG, and FBG data, a total of 437 individuals were included in the final study. The study adhered to the principles of the Declaration of Helsinki and was approved by the Ethics Committee of Tianjin Medical University General Hospital (approval number: IRB2018-100-01). All participants provided written informed consent.
Data Collection
Sociodemographic and clinical information was collected through face-to-face interviews conducted by trained researchers. The data included name, gender, age, years of education, age at which the participant began working, smoking and drinking habits, and history of diabetes and hypertension. Laboratory data included TG, FBG, total cholesterol (TC), high-density lipoprotein (HDL), and low-density lipoprotein (LDL). All participants underwent physical examinations, during which they wore light, loose-fitting clothing. Weight was measured using a standard scale, height was measured while participants stood straight, and WC was measured at the midpoint between the iliac crest and the lowest rib using a flexible measuring tape. All measurements were recorded by the same researcher to minimize systematic error.
BMD Assessment
BMD of the femoral neck was measured using dual-energy X-ray absorptiometry (DXA), and T-scores were recorded (ASY-00409, Hologic, MA, USA).30 T-score is defined as patient measured BMD (in g/cm) value minus the reference BMD value (sex-matched, young adult reference population) divided by the reference standard deviation(SD). (sex-matched, young adult reference population).31 According to the World Health Organization’s diagnostic criteria for individuals aged 50 and above, OP is defined as a T-score ≤ −2.5.32
Definitions and Groupings
Hypertension was defined as systolic blood pressure (SBP) ≥ 140 mmHg and/or diastolic blood pressure (DBP) ≥ 90 mmHg, or a self-reported history of antihypertensive medication use.33 Diabetes was defined as HbA1c ≥ 6.5% (≥ 48 mmol/mol), FPG ≥ 126 mg/dL (≥ 7.0 mmol/L), or a 2-hour postprandial glucose ≥ 200 mg/dL (≥ 11.1 mmol/L) during an oral glucose tolerance test (OGTT), or a self-reported history of diabetes or use of anti-diabetic medication.34 BMI was calculated as weight in kilograms divided by height in meters squared (kg/m²). Underweight was defined as BMI < 18.5 kg/m², normal weight as 18.5 ≤ BMI < 24 kg/m², overweight as 24 ≤ BMI < 28 kg/m², and obesity as BMI ≥ 28 kg/m².35 The TyG index and its related indices were calculated using standardized formulas: TyG = ln[TG (mg/dL) × FPG (mg/dL) / 2]; TyG-BMI = TyG × BMI; TyG-WC = TyG × WC.36 Participants were grouped into quartiles based on these indices.
Statistical Analysis
According to Kolmogorov-Smirnoff test and Shapiro–Wilk test, the normality of continuous variables in the non-osteoporosis group and the osteoporosis group were tested respectively, and the normal distribution histogram was used to judge. Continuous variables were expressed as means and SD or medians (interquartile ranges) and compared using Student’s t-test or the Mann–Whitney U-test. Categorical variables were presented as frequencies and percentages, with comparisons made using chi-square tests. Multivariate logistic regression was used to examine the relationship between TyG-related indices and OP. Subgroup analyses based on variables from the univariate analysis were performed to further explore the relationship between TyG-related indices and OP in different population subgroups. The relationship between indices and OP was expressed using adjusted odds ratios (OR) and 95% confidence intervals (CI). Linear regression models were used to verify the associations between TyG-related indices and BMD. For linear indices, multivariate linear regression was employed to confirm correlations, and subgroup analyses were performed based on age, gender, diabetes, and hypertension status. Standardized regression coefficients (β) and 95% CIs were used to express linear correlations. For non-linear indices, restricted cubic spline (RCS) curves were used to explore dose-response relationships between the indices and BMD. The number of knots was determined using the Bayesian Information Criterion (BIC). In the RCS graphs, bold lines represent point estimates of regression coefficients, and shaded areas represent 95% CIs. Statistical significance was set at P < 0.05. All statistical analyses were conducted using SPSS v.27.0.1 software (IBM Corp., Armonk, NY, USA). Flowcharts and forest plots were generated using GraphPad Software, Inc., San Diego, CA, USA (v.10.2.3), and R Foundation for Statistical Computing, Vienna, Austria (v.4.2) was used to create RCS curves.
Results
Baseline Demographic Characteristics
A total of 437 participants were included in this study (Figure 1), comprising 184 men (42.1%) and 253 women (43.5%), with an average age of 67.95 ± 6.55 years. The mean BMI of the study population was 25.02 ± 3.44, the mean BMD was 0.43 ± 0.10, and the mean T-score was −1.35 ± 0.85. The TyG index, TyG-BMI index, and TyG-WC index were 8.68 ± 0.63, 217.65 ± 37.07, and 752.09 ± 103.72, respectively (Table 1).
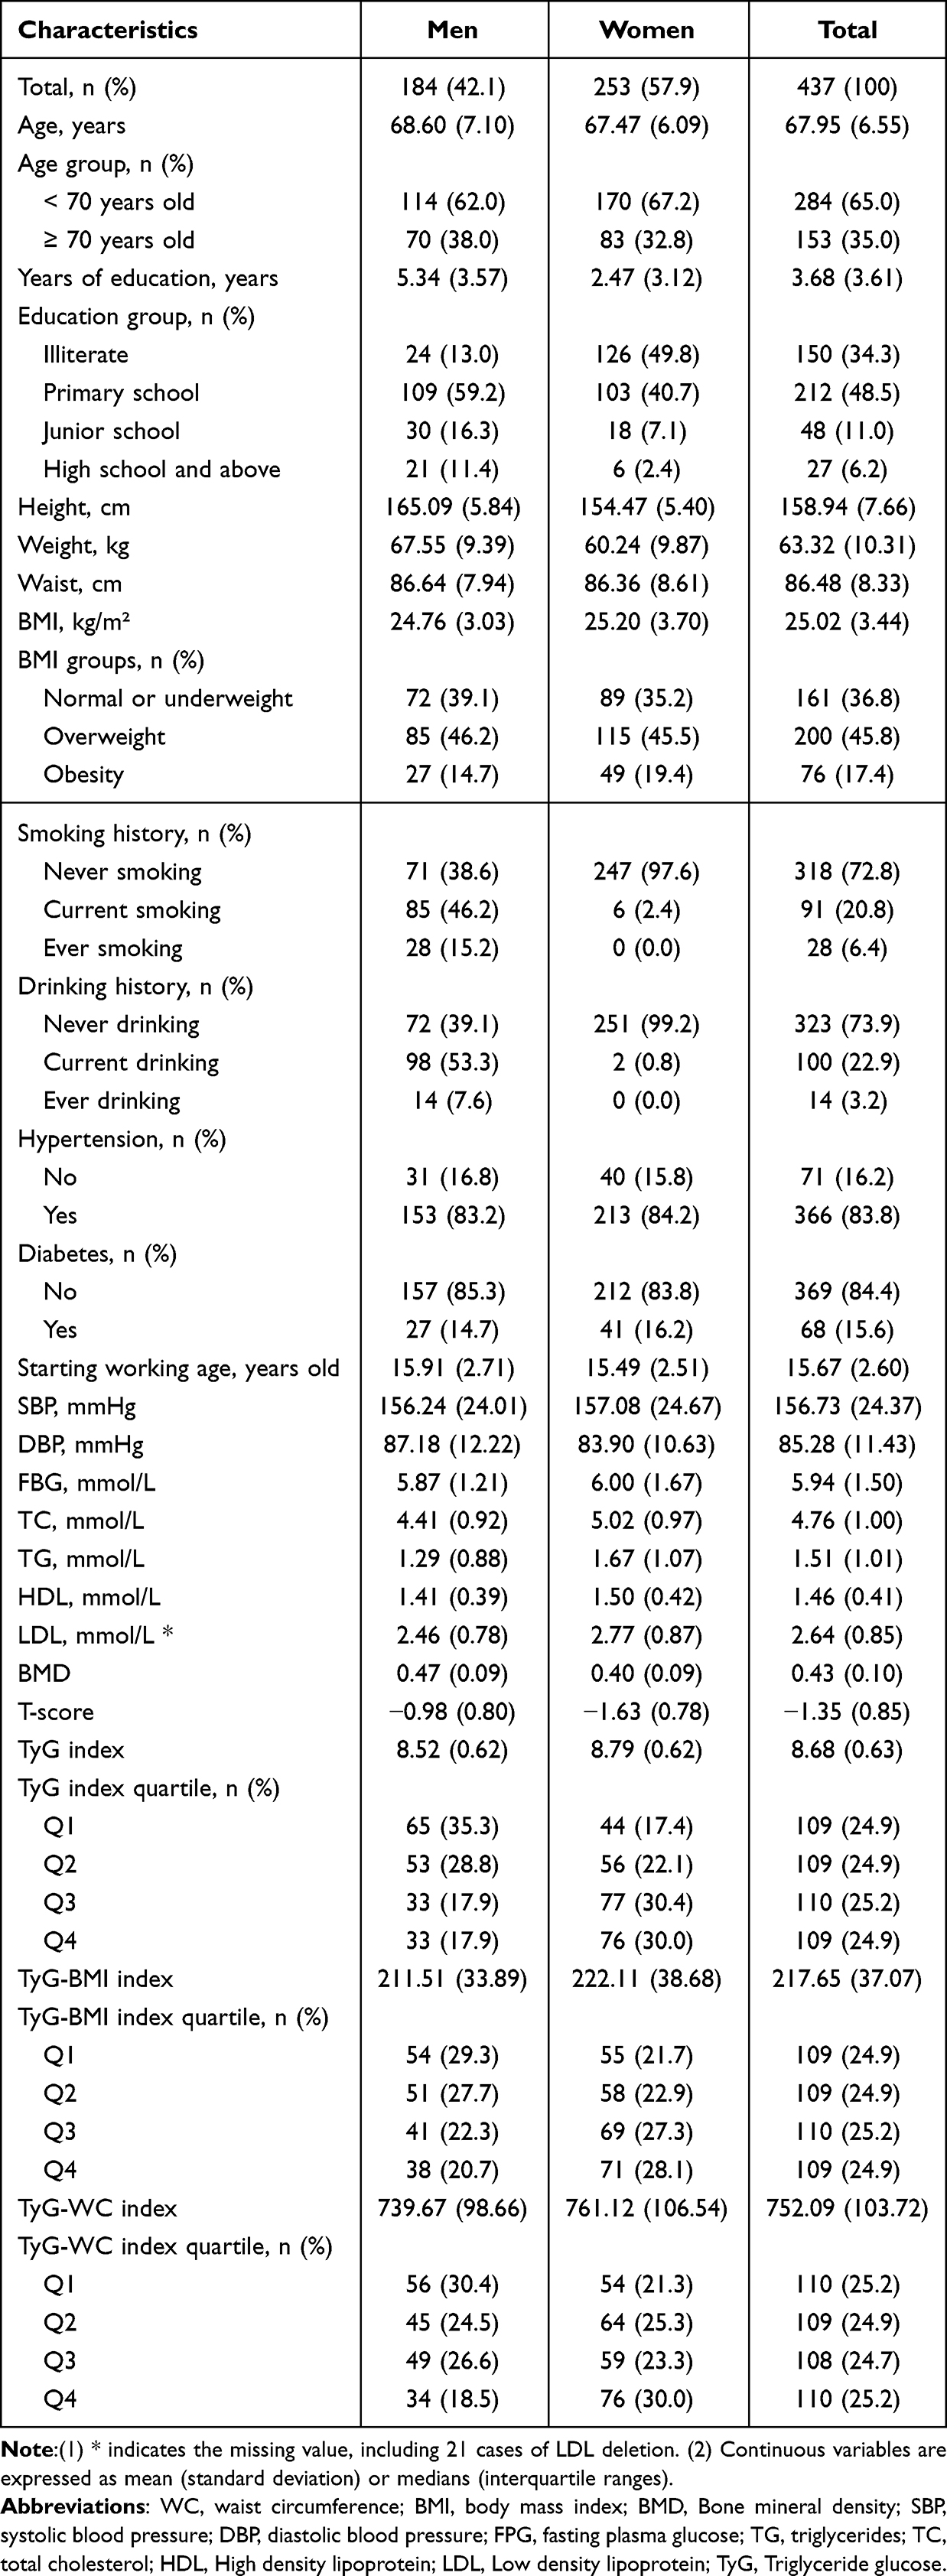 |
Table 1 Demographic Characteristics Among All Participants |
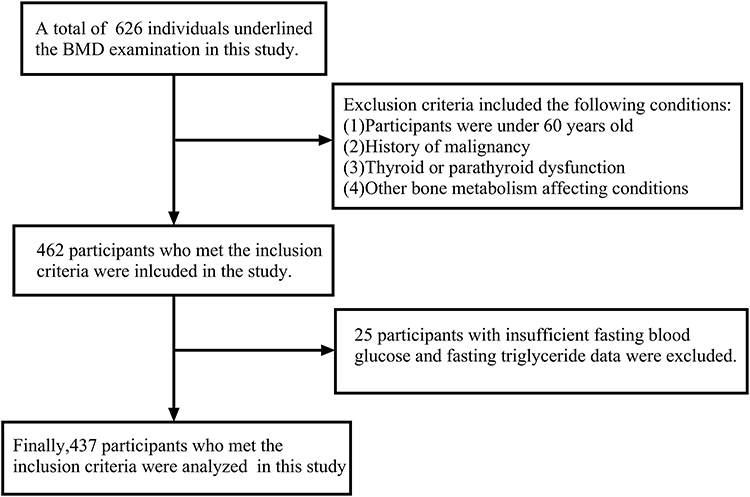 |
Figure 1 Flow chat of participants selection. Notes: a total of 626 individuals underwent BMD examination, with 462 participants meeting the inclusion criteria. Participants who were under 60 years old, had a history of malignancy, thyroid or parathyroid dysfunction, or other conditions affecting bone metabolism were excluded. Of the 462 eligible participants, 25 were excluded due to insufficient fasting blood glucose and fasting triglyceride data. Finally, 437 participants were included in the analysis. |
Univariate Analysis of Factors Influencing OP
Among the 437 participants, 38 were diagnosed with osteoporosis, representing a prevalence of 8.7%. Univariate analysis revealed significant associations between osteoporosis and variables such as gender, age, years of education, height, weight, BMI, and the TyG-BMI index (P < 0.05) (Supplemental Table 1).
Multivariate Analysis of Factors Influencing OP
After multivariate adjustment, the TyG-BMI index remained significantly associated with osteoporosis in models 1, 2, and 3. After adjusting for all variables included in the univariate analysis, the risk of osteoporosis decreased by 2% for every 1-unit increase in BMI (OR: 0.98, 95% CI: 0.96–1.00, P = 0.029). The fourth quartile (Q4) of the TyG-WC index was significantly associated with osteoporosis in models 2 and 3, with a 5.58-fold higher risk of osteoporosis compared to the first quartile (Q1) (OR: 5.58, 95% CI: 1.14–27.41, P = 0.034). No significant association was found between the TyG index, its quartiles, or the TyG-WC quartiles and osteoporosis (Table 2).
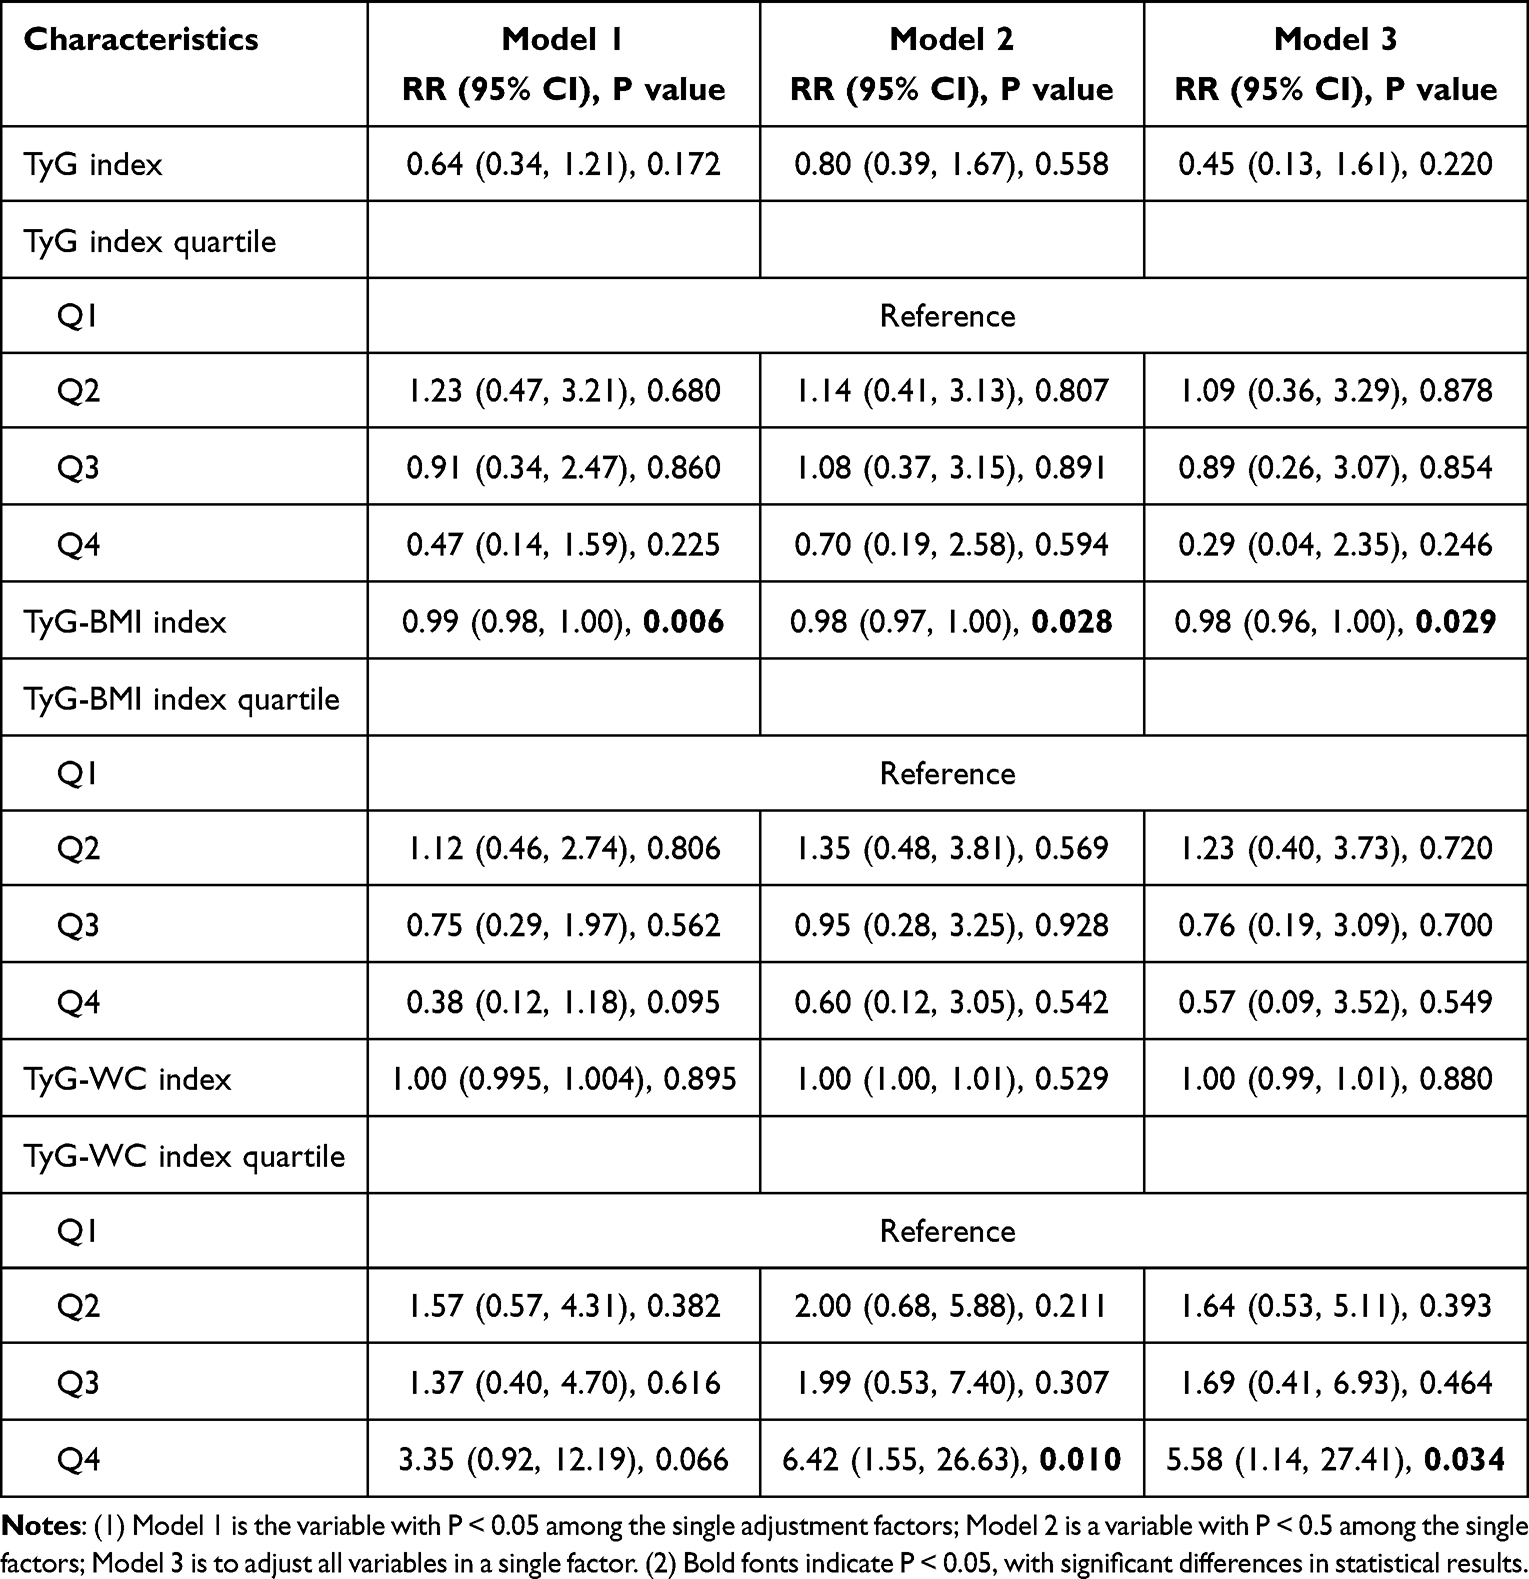 |
Table 2 Multivariate Analysis for the Prevalence of OP |
Subgroup Analysis of Factors Influencing OP
Subgroup analysis showed that after adjusting for factors with P < 0.05 in the univariate analysis, women, individuals with hypertension, and non-diabetic populations had a lower risk of developing osteoporosis. For each 1-unit increase in the TyG-BMI index, the risk of osteoporosis decreased by 2% (P < 0.05) (Figure 2). No significant associations between the TyG index or TyG-WC index and osteoporosis were found across gender, age, hypertension, diabetes, or BMI subgroups (Figures 3 and 4).
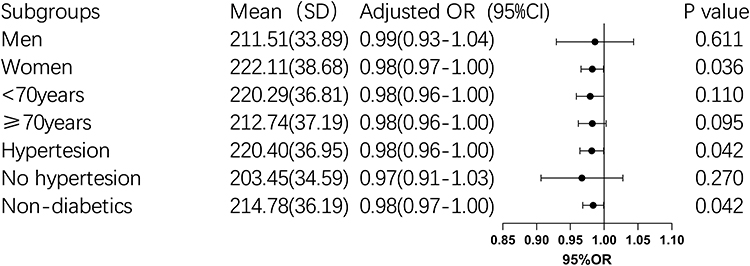 |
Figure 2 Subgroup analysis of TyG-BMI influencing OP. Notes: The adjusted OR with 95% CI for various subgroups, including gender, age, hypertension, and diabetes status. The results showed a significant association between TyG-BMI and OP in women (P = 0.036), individuals with hypertension (P = 0.042), and non-diabetic individuals (P = 0.042). No significant association was observed in men or individuals aged <70 years. |
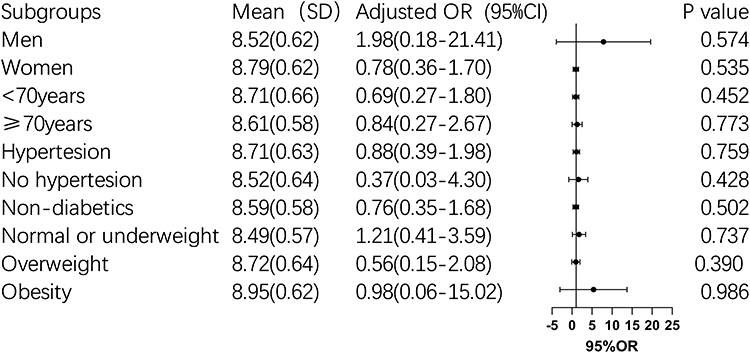 |
Figure 3 Subgroup analysis of TyG influencing OP. Notes: The adjusted OR with 95% CI for various subgroups, including gender, age, hypertension, and diabetes status. No significant associations were found in any of the subgroups. |
 |
Figure 4 Subgroup analysis of TyG-WC influencing OP. Notes: The adjusted OR with 95% CI for various subgroups, including gender, age, hypertension, diabetes status and obesity situation. No significant associations were found in any of the subgroups. |
Univariate Analysis of Factors Influencing BMD
Linear regression analysis showed that gender, age, years of education, height, weight, BMI, smoking history, drinking history, and the TyG-BMI index were significantly associated with BMD (P < 0.05). Age and female gender (compared to male) were negatively correlated with BMD, while the other factors were positively correlated. However, no linear relationship was observed between the TyG index or TyG-WC index (and their quartiles) and BMD (Supplemental Table 2).
Multivariate Analysis of TyG-BMI and BMD
After adjusting for factors with P < 0.05 in the univariate analysis, the associations between gender, age, TyG-BMI index, and the Q4 of TyG-BMI with BMD remained significant, with gender being the strongest factor (Table 3). Compared to men, the TyG-BMI index was negatively correlated with BMD in women (β: −0.347, 95% CI: −0.372, −0.322, P < 0.001). For each 1-year increase in age, BMD decreased by 0.28 (β: −0.208, 95% CI: −0.210, −0.206, P < 0.001). Each 1-unit increase in the TyG-BMI index was associated with a 0.15 increase in BMD (β: 0.150, 95% CI: 0.1498,0.1502, P < 0.001). Subgroup analysis showed that the associations remained significant in women, individuals under 70, and those with or without hypertension or diabetes, with the strongest association observed in the non-hypertensive group (P < 0.05) (Table 4).
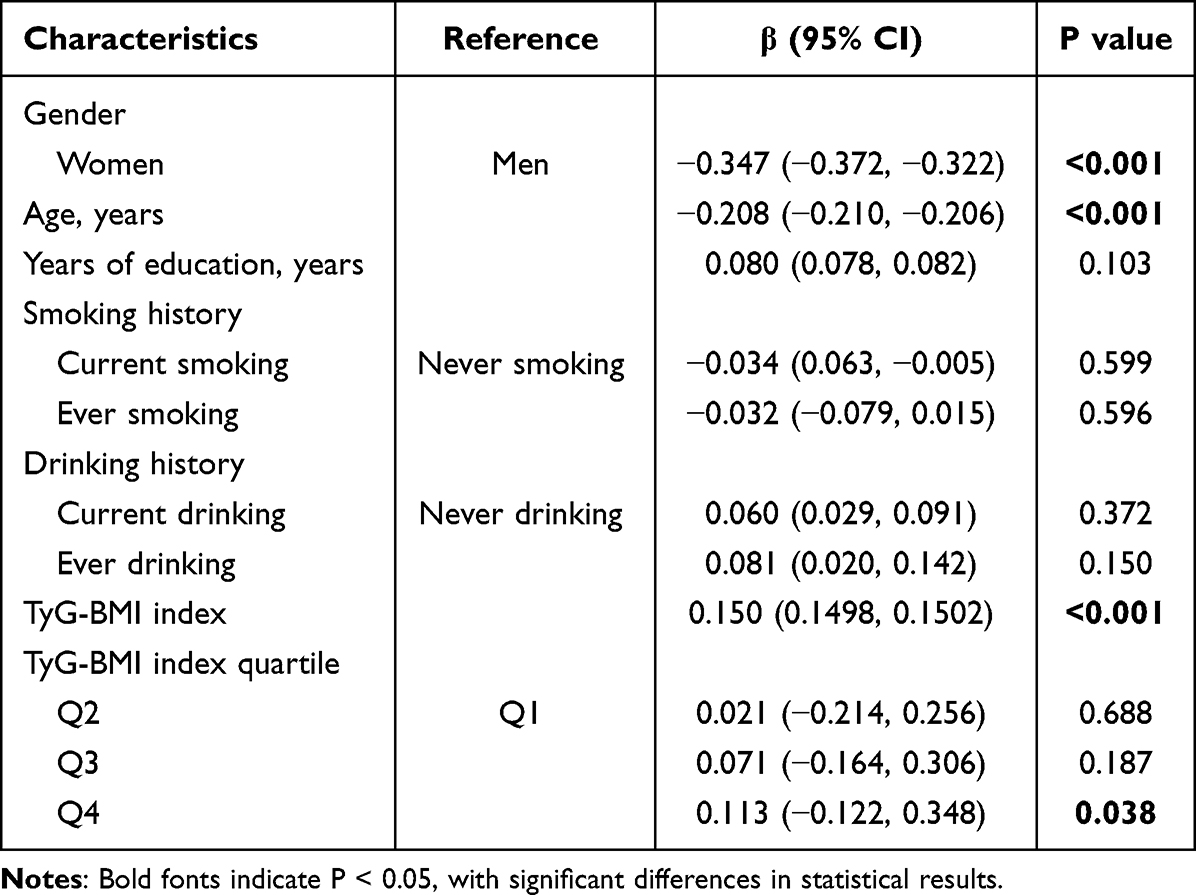 |
Table 3 Multivariate Analysis for the Prevalence of BMD |
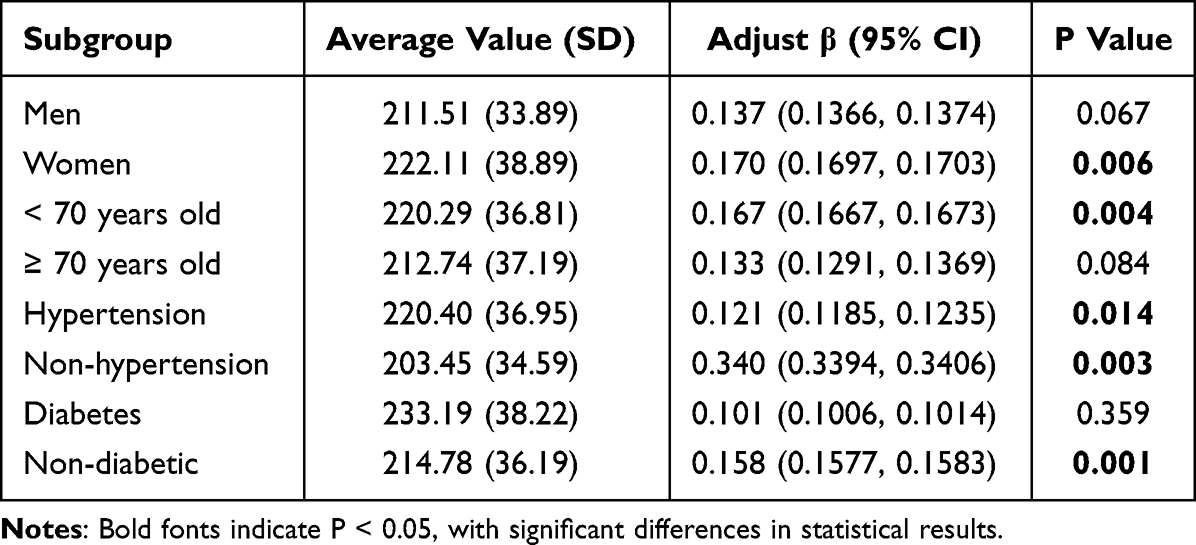 |
Table 4 Subgroup Analysis for the Prevalence of BMD |
Non-Linear Analysis of TyG Index and TyG-WC Index With BMD
No linear relationship was found between the TyG index, TyG-WC index, and BMD in univariate analysis (Figures 5A and 6A). Further exploration using RCS curves showed no significant non-linear associations between the indices and BMD, even after sequential adjustment for age, gender, education level, BMI (Figures 5B and 6B), smoking history, drinking history, hypertension, diabetes (Figures 5C and 6C), and laboratory indicators such as TC, HDL, and LDL (Figures 5D and 6D).
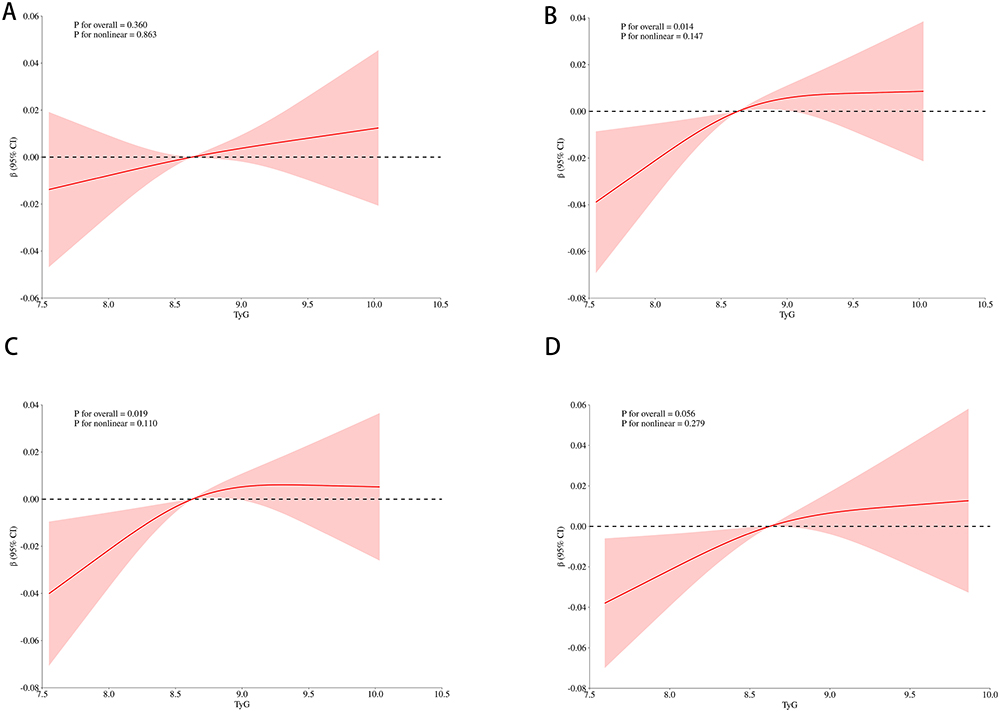 |
Figure 5 Relationship between the TyG index and the risks of BMD. Notes: The nonlinear relationship between the TyG index and BMD.The inflection points are 8.63 for Panel A and 8.62 for Panels B, C, and D. (A) Relationship between the TyG index and the risk of OP in a univariate analysis. The overall P value is 0.360, and the nonlinearity P value is 0.863. (B) Relationship between the TyG index and the risk of BMD, adjusted for age, sex, education level, and body mass index. The overall P value is 0.014, and the nonlinearity P value is 0.147. (C) Relationship between the TyG index and the risk of OP, further adjusted for smoking history, drinking history, hypertension, and diabetes on the basis of Panel B. The overall P value is 0.019, and the nonlinearity P value is 0.110. (D) Relationship between the TyG index and the risk of BMD, further adjusted for TC, HDL, and LDL on the basis of Panel C. The overall P value is 0.056, and the nonlinearity P value is 0.279. |
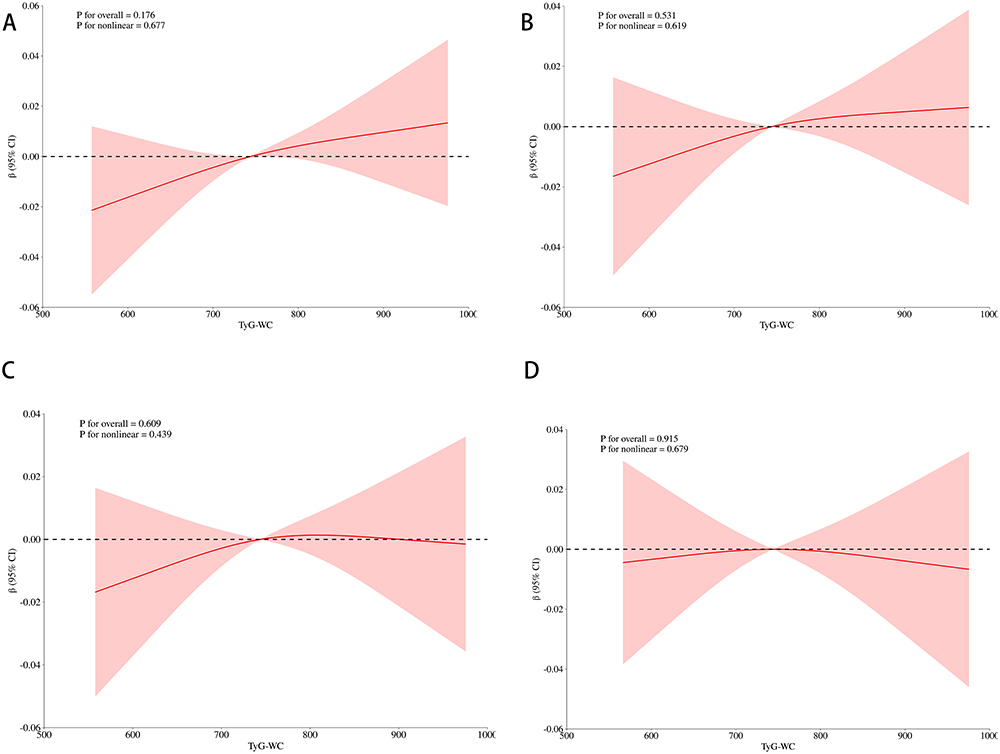 |
Figure 6 Relationship between the TyG-WC index and the risks of BMD. Notes: the nonlinear relationship between the TyG-WC index and the risk of BMD. The inflection points are 743.96 for Panel A and 743.71 for Panels B, C, and D. (A) Relationship between the TyG-WC index and the risk of BMD in a univariate analysis. The overall P value is 0.176, and the nonlinearity P value is 0.677. (B) Relationship between the TyG-WC index and the risk of BMD, adjusted for age, sex, education level, and body mass index. The overall P value is 0.531, and the nonlinearity P value is 0.619. (C) Relationship between the TyG-WC index and the risk of BMD, further adjusted for smoking history, drinking history, hypertension, and diabetes on the basis of Panel B. The overall P value is 0.609, and the nonlinearity P value is 0.439. (D) Relationship between the TyG-WC index and the risk of BMD, further adjusted for TC, HDL, and LDL on the basis of Panel C. The overall P value is 0.915, and the nonlinearity P value is 0.679. |
Discussion
The purpose of this study was to evaluate the relationship between TyG-related indices and bone health in a rural Chinese population, and to determine whether TyG-related indices can serve as independent predictors of OP risk as the primary outcome, with BMD as a supplementary secondary outcome. We found that the TyG-BMI index serves as a protective factor against OP, particularly in women, hypertensive individuals, and non-diabetic populations, where the risk of OP is lower. The TyG-BMI index and its Q4 were positively associated with BMD, especially in women, individuals under 70, those with or without hypertension, and non-diabetic populations, with the strongest correlation observed in non-hypertensive individuals. After multivariate adjustment, the Q4 of the TyG-WC index was associated with a higher risk of OP. No significant correlations were observed between the TyG index and either BMD or OP, even after stratifying by age, gender, BMI, hypertension, or diabetes. These findings suggest that the TyG-BMI index has a protective effect against OP, while the TyG-WC index is a risk factor, with varying degrees of association across different populations.
Osteoporotic fractures are the most severe complications of OP, with common sites including vertebral bodies, hips, distal forearms, and proximal humerus.37 Severe cases can lead to vertebral compression fractures, which in turn cause height loss and kyphosis, leading to spinal deformities. The presence of OP leads to local mechanical risks and poses significant challenges for the prognosis of vertebral fractures and related surgeries.38 Insulin signaling regulates osteoblast bone formation and osteoclast bone resorption, and this connection may affect fracture risk and the development of OP by modulating bone turnover markers (such as osteocalcin and tartrate-resistant acid phosphatase), insulin-like growth factor 1 (IGF-1), and cytokines secreted by adipose tissue in obese patients (such as TNF-α and IL-6).14 The TyG-related indices, which combine obesity markers as a surrogate for insulin resistance, play an important role in bone health, but the underlying mechanisms have yet to be fully elucidated.
The correlation between the TyG index, a surrogate marker of IR, and BMD, as well as its role in predicting the risk of OP, remains controversial. Most cross-sectional studies suggest that the TyG index is negatively correlated with BMD and can act as a risk factor for predicting OP. Specifically, a study conducted in a non-diabetic, middle-aged, and elderly Korean population found that both men and women had a negative correlation between the TyG index and femoral neck BMD, with the strongest association observed in women with a BMI < 23 kg/m².20 Similarly, a large prospective study in China found that the TyG index was significantly associated with lower bone mass and an increased risk of OP in the femur, lumbar spine, and hip.21 A large-scale prospective cohort study in China also indicated that the TyG index is an independent influencing factor for osteoporosis.39 However, contrary to these findings, Tian N. et al26 reported a significant positive correlation between the TyG index and total BMD, with regression coefficients increasing when the TyG index exceeded 9.106. A similar positive correlation was observed in studies of HIV-infected populations.27 Other studies, however, found no association between the TyG index, BMD, and OP. For example, Chen H. et al28 reported no significant correlation between the TyG index and femoral neck BMD or low bone mass. Similarly, a study on postmenopausal women with type 2 diabetes in Guangzhou found no significant correlation between the TyG index and BMD in the lumbar spine, femoral neck, or hip, nor with OP.29 Consistent with these findings, our study also did not observe a significant correlation between the TyG index and femoral neck BMD or OP. This could be due to our small sample size, which may not fully reveal the association, or because we only examined the femoral neck BMD and OP, which may not reflect overall bone metabolism. Moreover, the mechanisms underlying the relationship between IR and bone metabolism are not fully understood,12–14 warranting further investigation into the relationship between the TyG index, BMD, and OP.
Several studies suggest that the TyG-BMI index, which incorporates obesity metrics, is positively correlated with BMD and may act as a protective factor against OP. Research has shown that a high BMI is associated with higher BMD and a lower risk of fractures in postmenopausal women, and an increase in BMI is associated with higher femoral neck BMD in men up to 35 kg/m².40,41 Tian N. et al26 found a significant positive correlation between the TyG-BMI index and total BMD, with regression coefficients decreasing when the TyG-BMI index exceeded 193.9265. In non-diabetic US adults, the TyG-BMI index was positively correlated with femoral neck BMD, with higher TyG-BMI levels associated with a lower risk of OP, particularly in postmenopausal women over 40 and men over 60.23 Similarly, Wen Z. et al24 reported a positive correlation between the TyG-BMI index and femoral neck BMD, and a negative association with fracture risk in middle-aged and elderly non-diabetic men and women. Xuan X. et al25 also found a positive correlation between the TyG-BMI index and femoral neck BMD in non-diabetic elderly individuals, with consistency across subgroup analyses by age, blood pressure, and other factors, although no typical dose-dependent positive correlation was observed across its quartiles. Consistent with previous studies, we also found a positive correlation between the TyG-BMI index and BMD, and further identified its protective role against OP. Our study further demonstrated that this index had a significant correlation with BMD in women, individuals under 70, those with or without hypertension, and non-diabetic populations, with the strongest correlation observed in non-hypertensive individuals. Multiple studies have shown a significant positive correlation between IR and low bone mass as well as OP, particularly in postmenopausal women.21,42 IR affects BMD and contributes to OP by regulating estrogen levels. Hypertension may lead to calcium loss, activate inflammatory pathways, and enhance sympathetic nervous system activity, thereby affecting bone mineral density.43 In this study, the complex effects of women and hypertensive people on bone metabolism amplified the protective role of TyG-BMI in OP. Meanwhile, the relatively smaller sample size of the non-hypertensive group intensified the observed correlation. Additionally, we found that the TyG-BMI index served as a protective factor against OP, especially in women, individuals with hypertension, and non-diabetic populations. This might be related to metabolic changes associated with hyperglycemia. Research has found that IR has a dual effect on BMD. In diabetic populations, IR inhibits osteocalcin production, reducing bone turnover, bone strength, and cortical thickness.14 Additionally, Sun W. W. et al44 suggested that a high TyG-BMI index in individuals with type 2 diabetes might be related to impaired bone turnover, potentially reducing the positive association between the TyG-BMI index and BMD.
Research on the relationship between the TyG-WC index and BMD is limited. Studies have found that WC is more strongly correlated with the absolute amount of visceral fat or abdominal fat,45 and increased visceral fat is significantly associated with the prevalence of OP. Moderate accumulation of visceral fat may benefit bone health, but excessive visceral fat could have adverse effects.46 Tian N. et al26 found a significant positive correlation between the TyG-WC index and total BMD, with regression coefficients decreasing when the TyG-WC index exceeded 667.5304. The TyG index, when combined with WC, provides a more accurate reflection of the impact of abdominal obesity. Abdominal obesity may influence bone metabolism through inflammatory responses and the secretion of cytokines by adipose tissue.47 In our study, we found that the Q4 of the TyG-WC index is a risk factor for OP. However, the nonlinear relationship between TyG-WC and BMD was not significant in the secondary outcomes. This may be due to the relatively small sample size of our study, which may cause statistical noise and not fully capture the complex relationship between TyG-WC and BMD. Nevertheless, these findings provide insights that the impact of TyG-WC on bone metabolism may vary across different population groups.
This study has several limitations. First, as a cross-sectional study, we could not establish causal relationships between the TyG index, its derivative indices, BMD, and OP, nor account for factors influencing disease progression. Further research is needed to confirm the predictive value of these indices for OP and BMD. Second, our sample size was relatively small, which limits the generalizability of our findings regarding the association between TyG-related indices and BMD or OP. This may introduce statistical noise in the nonlinear regression analysis using RCS, necessitating a larger sample size for more reliable conclusions. Third, we only measured femoral neck BMD, which may have reduced the prevalence of OP in our sample. Future studies should consider more comprehensive assessments, including hip and lumbar spine BMD, to enhance the generalizability of the findings. Fourth, there were limitations in our control of confounding factors that may not fully account for all variables affecting the outcomes. It is important to note that our study did not include a detailed assessment of participants’ daily outdoor physical activities, dietary habits, dairy consumption, vitamin D, calcium supplementation, and blood cell counts, 25-OH vitamin D, calcium, ALB, and bone turnover indices. The absence of this information, which could have provided a more comprehensive understanding of the factors influencing bone health, may limit the broad applicability of our conclusions. Future research should further explore these and other potential confounders to enhance the reliability of the findings. Lastly, due to data limitations, we only evaluated BMD without assessing the relationship between TyG-related indices and bone quality (eg, microstructure, bone shape). Further studies should explore these aspects.
Conclusions
This study found that the TyG-BMI index is a protective factor against OP, particularly in women, individuals with hypertension, and non-diabetic populations. The TyG-BMI index is positively associated with BMD, especially in women, individuals under 70, those with or without hypertension, and non-diabetic populations, with the strongest correlation observed in non-hypertensive individuals, which proves the reliability of the result from the side. In contrast, the Q4 of TyG-WC index is a risk factor for OP. Although BMD results do not confirm this point well, it also indicates that the predictive value of OP by TyG-WC index is a complex non-linear relationship, which is related to the selected population. These findings enhance our understanding of the relationship between TyG-related indices and bone health and provide clues for future studies on the relationship between these indices and OP. Monitoring TyG-related indices in hypertensive, non-diabetic women over 70 may help prevent the risk of OP and improve public health outcomes by enabling earlier treatment.
Data Sharing Statement
The datasets generated during and/or analyzed during the current study are available from the corresponding author on reasonable request.
Ethics Approval and Consent to Participate
The study adhered to the principles of the Declaration of Helsinki and was approved by the Ethics Committee of Tianjin Medical University General Hospital (approval number: IRB2018-100-01). All participants provided written informed consent.
Acknowledgments
We thank all participants of the Tianjin Brain Study, and local medical care professionals for their valuable contributions.
Author Contributions
All authors made a significant contribution to the work reported, whether that is in the conception, study design, execution, acquisition of data, analysis and interpretation, or in all these areas; took part in drafting, revising or critically reviewing the article; gave final approval of the version to be published; have agreed on the journal to which the article has been submitted; and agree to be accountable for all aspects of the work.
Funding
There is no funding to report.
Disclosure
The authors declare no competing interests in this work.
References
1. Anam AK, Insogna K. Update on osteoporosis screening and management. Med Clin North Am. 2021;105(6):1117–1134. doi:10.1016/j.mcna.2021.05.016
2. Xiao PL, Cui AY, Hsu CJ, et al. Global, regional prevalence, and risk factors of osteoporosis according to the World Health Organization diagnostic criteria: a systematic review and meta-analysis. Osteoporos Int. 2022;33(10):2137–2153. doi:10.1007/s00198-022-06454-3
3. Clynes MA, Harvey NC, Curtis EM, Fuggle NR, Dennison EM, Cooper C. The epidemiology of osteoporosis. Br Med Bull. 2020;133(1):105–117. doi:10.1093/bmb/ldaa005
4. Zhu H, Gao M, Song Q, et al. A meta-analysis of the prevalence of osteoporosis in elderly Chinese. Chin Gen Pract. 2022;25(3):346–353. doi:10.12114/j.issn.1007-9572.2021.02.0836
5. Wang L, Yu W, Yin X, et al. Prevalence of osteoporosis and fracture in China: the China osteoporosis prevalence study. JAMA Network Open. 2021;4(8):e2121106. doi:10.1001/jamanetworkopen.2021.21106
6. Ning P, Cheng X, Zhang L, Zhang W, Hu G. Injury mortality in China, from 1990 to 2010. Chin J Epidemiol. 2015;36(12):1387–1390. doi:10.3760/cma.j.issn.0254-6450.201519
7. Dempster DW. Osteoporosis and the burden of osteoporosis-related fractures. Am J Manag Care. 2011;17 Suppl 6:S164–169.
8. Mao B, Zhang Z, Weili F, Li J. A systematic review of disease burden of osteoporotic fractures in China. Chin J Evidence-Based Med. 2018;18(2):151–155.
9. Warriner AH, Patkar NM, Curtis JR, et al. Which fractures are most attributable to osteoporosis? J Clin Epidemiol. 2011;64(1):46–53. doi:10.1016/j.jclinepi.2010.07.007
10. Peng P, Xiao F, He X, et al. Global research status and trends of femoral neck fracture over the past 27 years: a historical review and bibliometric analysis. Front Surg. 2022;9:875040. doi:10.3389/fsurg.2022.875040
11. Siris ES, Adler R, Bilezikian J, et al. The clinical diagnosis of osteoporosis: a position statement from the National Bone Health Alliance Working Group. Osteoporos Int. 2014;25(5):1439–1443. doi:10.1007/s00198-014-2655-z
12. Cipriani C, Colangelo L, Santori R, et al. The interplay between bone and glucose metabolism. Front Endocrinol. 2020;11:122. doi:10.3389/fendo.2020.00122
13. Tencerova M, Okla M, Kassem M. Insulin signaling in bone marrow adipocytes. Curr Osteoporosis Rep. 2019;17(6):446–454. doi:10.1007/s11914-019-00552-8
14. Conte C, Epstein S, Napoli N. Insulin resistance and bone: a biological partnership. Acta Diabetologica. 2018;55(4):305–314. doi:10.1007/s00592-018-1101-7
15. Khan SH, Sobia F, Niazi NK, Manzoor SM, Fazal N, Ahmad F. Metabolic clustering of risk factors: evaluation of Triglyceride-glucose index (TyG index) for evaluation of insulin resistance. Diabetol Metab Syndr. 2018;10:74. doi:10.1186/s13098-018-0376-8
16. Ramdas Nayak VK, Satheesh P, Shenoy MT, Kalra S. Triglyceride glucose (TyG) index: a surrogate biomarker of insulin resistance. J Pak Med Assoc. 2022;72(5):986–988. doi:10.47391/JPMA.22-63
17. Gkastaris K, Goulis DG, Potoupnis M, Anastasilakis AD, Kapetanos G. Obesity, osteoporosis and bone metabolism. J Musculoskelet Neuronal Interact. 2020;20(3):372–381.
18. Er LK, Wu S, Chou HH, et al. Triglyceride glucose-body mass index is a simple and clinically useful surrogate marker for insulin resistance in nondiabetic individuals. PLoS One. 2016;11(3):e0149731. doi:10.1371/journal.pone.0149731
19. Kim HS, Cho YK, Kim EH, et al. Triglyceride glucose-waist circumference is superior to the homeostasis model assessment of insulin resistance in identifying nonalcoholic fatty liver disease in healthy subjects. J Clin Med. 2021;11(1):41. doi:10.3390/jcm11010041.
20. Yoon JH, Hong AR, Choi W, Park JY, Kim HK, Kang HC. Association of triglyceride-glucose index with bone mineral density in non-diabetic Koreans: KNHANES 2008-2011. Calcif Tissue Int. 2021;108(2):176–187. doi:10.1007/s00223-020-00761-9
21. Zhuo M, Chen Z, Zhong ML, et al. Association of insulin resistance with bone mineral density in a nationwide health check-up population in China. Bone. 2023;170:116703. doi:10.1016/j.bone.2023.116703
22. Zhan H, Liu X, Piao S, Rong X, Guo J. Association between triglyceride-glucose index and bone mineral density in US adults: a cross sectional study. J Orthop Surg Res. 2023;18(1):810. doi:10.1186/s13018-023-04275-6
23. Tian C, Liu J, Ma M, et al. Association between surrogate marker of insulin resistance and bone mineral density in US adults without diabetes. Arch Osteoporos. 2024;19(1):42. doi:10.1007/s11657-024-01395-2
24. Wen Z, Li Y, Xu L, et al. Triglyceride glucose-body mass index is a reliable indicator of bone mineral density and risk of osteoporotic fracture in middle-aged and elderly nondiabetic chinese individuals. J Clin Med. 2022;11(19):5694. doi:10.3390/jcm11195694.
25. Xuan X, Sun R, Peng C, Liu L, Huang T, Huang C. The nonlinear association between triglyceride glucose-body mass index and femoral neck BMD in nondiabetic elderly men: NHANES 2005-March 2020. PLoS One. 2024;19(1):e0296935. doi:10.1371/journal.pone.0296935
26. Tian N, Chen S, Han H, Jin J, Li Z. Association between triglyceride glucose index and total bone mineral density: a cross-sectional study from NHANES 2011-2018. Sci Rep. 2024;14(1):4208. doi:10.1038/s41598-024-54192-9
27. Caeran G, de Almeida LL, Ilha T, et al. Insulin resistance and its association with osteoporosis in people living with HIV. J Endocr Soc. 2022;6(12):bvac148. doi:10.1210/jendso/bvac148
28. Chen H, Hu J, Li J, Li Q, Lan L. Association between triglyceride-glucose index and femoral bone mineral density in community-dwelling, nondiabetic men and women: a NHANES analysis of 1928 US individuals. Menopause. 2024;31(7):626–633. doi:10.1097/GME.0000000000002374
29. Gu P, Pu B, Xin Q, et al. The metabolic score of insulin resistance is positively correlated with bone mineral density in postmenopausal patients with type 2 diabetes mellitus. Sci Rep. 2023;13(1):8796. doi:10.1038/s41598-023-32931-8
30. Kanis JA. Diagnosis of osteoporosis and assessment of fracture risk. Lancet. 2002;359(9321):1929–1936. doi:10.1016/S0140-6736(02)08761-5
31. Amarnath SS, Kumar V, Das SL. Classification of osteoporosis. Indian J Orthop. 2023;57(Suppl 1):49–54. doi:10.1007/s43465-023-01058-3
32. Kanis JA, Kanis JA. Assessment of fracture risk and its application to screening for postmenopausal osteoporosis: synopsis of a WHO report. WHO study group. Osteoporos Int. 1994;4(6):368–381. doi:10.1007/BF01622200
33. Mancia G, Kreutz R, Brunström M, et al. 2023 ESH guidelines for the management of arterial hypertension the task force for the management of arterial hypertension of the european society of hypertension: endorsed by the International society of hypertension (ISH) and the European renal association (ERA). J Hypertens. 2023;41(12):1874–2071. doi:10.1097/HJH.0000000000003480
34. ElSayed NA, Aleppo G, Bannuru RR, Committee ADAPP. 2. diagnosis and classification of diabetes: standards of care in Diabetes—2024. Diabetes Care. 2024;47(Suppl 1):S20–s42. doi:10.2337/dc24-S002
35. Chen K, Shen Z, Gu W, et al. Prevalence of obesity and associated complications in China: a cross-sectional, real-world study in 15.8 million adults. Diabetes Obes Metab. 2023;25(11):3390–3399. doi:10.1111/dom.15238
36. Bala C, Gheorghe-Fronea O, Pop D, et al. The association between six surrogate insulin resistance indexes and hypertension: a population-based study. Metab Syndr Relat Disord. 2019;17(6):328–333. doi:10.1089/met.2018.0122
37. Prost S, Pesenti S, Fuentes S, Tropiano P, Blondel B. Treatment of osteoporotic vertebral fractures. Orthop Traumatol Surg Res. 2021;107(1s):102779. doi:10.1016/j.otsr.2020.102779
38. Moldovan F. Bone cement implantation syndrome: a rare disaster following cemented hip arthroplasties-clinical considerations supported by case studies. J Pers Med. 2023;13(9):1381. doi:10.3390/jpm13091381
39. Jiacheng YONG, Fei ZHU, Hao CHEN, et al. The correlation between triglyceride glucose index and osteoporosis: a cross-sectional study based on natural populations. J Clin Med Pract. 2023;27(6):29–32.
40. Oldroyd A, Dubey S. The association between bone mineral density and higher body mass index in men. Int J Clin Pract. 2015;69(1):145–147. doi:10.1111/ijcp.12523
41. Tariq S, Tariq S, Lone KP. Relationship of anthropometric measures with bone mineral density in postmenopausal non-osteoporotic, osteopenic and osteoporotic women. J Pak Med Assoc. 2017;67(4):590–594.
42. Shirinezhad A, Azarboo A, Ghaseminejad-Raeini A, et al. A systematic review of the association between insulin resistance surrogate indices and bone mineral density. Front Endocrinol. 2024;15:1499479. doi:10.3389/fendo.2024.1499479
43. Canoy D, Harvey NC, Prieto-Alhambra D, et al. Correction: elevated blood pressure, antihypertensive medications and bone health in the population: revisiting old hypotheses and exploring future research directions. Osteoporos Int. 2022;33(10):2241. doi:10.1007/s00198-022-06537-1
44. Sun WW, Xing YL, Zhou F, Ma YA, Wan XZ, Ma HJ. Association analysis of triglyceride glucose-body mass index and bone turnover markers in patients with 2 diabetes mellitus. Diab Metab Syndrome Obes. 2023;16:1435–1447. doi:10.2147/DMSO.S406849
45. Ross R, Neeland IJ, Yamashita S, et al. Waist circumference as a vital sign in clinical practice: a consensus statement from the IAS and ICCR working group on visceral obesity. Nat Rev Endocrinol. 2020;16(3):177–189. doi:10.1038/s41574-019-0310-7
46. Sun AC, Hu JY, Wang SSZ, Yin F, Liu ZT. Association of the visceral adiposity index with femur bone mineral density and osteoporosis among the US older adults from NHANES 2005-2020: a cross-sectional study. Front Endocrinol. 2023;14:1231527. doi:10.3389/fendo.2023.1231527
47. Wang L XX, Kn XWC, Chen H, Chen H. The causal relationship between abdominal obesity and lower bone mineral density: a two-sample Mendelian randomization study. Front Genet. 2022;13:970223. doi:10.3389/fgene.2022.970223
 © 2025 The Author(s). This work is published and licensed by Dove Medical Press Limited. The
full terms of this license are available at https://www.dovepress.com/terms.php
and incorporate the Creative Commons Attribution
- Non Commercial (unported, 4.0) License.
By accessing the work you hereby accept the Terms. Non-commercial uses of the work are permitted
without any further permission from Dove Medical Press Limited, provided the work is properly
attributed. For permission for commercial use of this work, please see paragraphs 4.2 and 5 of our Terms.
© 2025 The Author(s). This work is published and licensed by Dove Medical Press Limited. The
full terms of this license are available at https://www.dovepress.com/terms.php
and incorporate the Creative Commons Attribution
- Non Commercial (unported, 4.0) License.
By accessing the work you hereby accept the Terms. Non-commercial uses of the work are permitted
without any further permission from Dove Medical Press Limited, provided the work is properly
attributed. For permission for commercial use of this work, please see paragraphs 4.2 and 5 of our Terms.
Recommended articles
Association Between Weight-Adjusted Waist Index and Periodontitis: A Cross-Sectional Study and Mediation Analysis
Yang H, Lu Y, Zhao L, He Y, He Y, Chen D
Diabetes, Metabolic Syndrome and Obesity 2024, 17:4235-4246
Published Date: 11 November 2024
Anti-Osteoporosis Is Imperative in Prevention of Progress of Ankylosing Spondylitis
Zheng B, Yu P, Liu H, Liang Y
International Journal of General Medicine 2025, 18:291-297
Published Date: 21 January 2025