")
Back to Journals » Journal of Inflammation Research » Volume 18
Development and Validation of a Cost-Effective Machine Learning Model for Screening Potential Rheumatoid Arthritis in Primary Healthcare Clinics
Authors Wu W, Hu X, Yan L, Li Z, Li B, Chen X, Lin Z , Zeng H, Li C, Mo Y, Wu Y, Wang Q
Received 19 September 2024
Accepted for publication 9 January 2025
Published 3 February 2025 Volume 2025:18 Pages 1511—1522
DOI https://doi.org/10.2147/JIR.S487595
Checked for plagiarism Yes
Review by Single anonymous peer review
Peer reviewer comments 3
Editor who approved publication: Professor Ning Quan
Wenqi Wu,1,2,* Xiaohao Hu,1,2,* Linyang Yan,3,* Zhiyin Li,4 Bo Li,5 Xinpeng Chen,6 Zexun Lin,7 Huiqiong Zeng,8 Chun Li,9 Yingqian Mo,10 Yalin Wu,3 Qingwen Wang1,2
1Department of Rheumatology and Immunology, Peking University Shenzhen Hospital, Shenzhen, People’s Republic of China; 2Shenzhen Key Laboratory of Inflammatory and Immunology Diseases, Shenzhen, People’s Republic of China; 3Department of Ultrasound, Institute of Ultrasonic Medicine, Peking University Shenzhen Hospital, Shenzhen Peking University-The Hong Kong University of Science and Technology Medical Center, Shenzhen, 518036, People’s Republic of China; 4Department of Information Systems, City University of Hong Kong, Hong Kong, People’s Republic of China; 5Department of Rheumatology and Immunology, People’s Hospital of Longhua District, Shenzhen, People’s Republic of China; 6Department of Rheumatology and Immunology, Shenzhen Futian Hospital for Rheumatic Diseases, Shenzhen, People’s Republic of China; 7Shenzhen Nanshan Medical Group HQ Taohuayuan Community Health Service Center, Shenzhen, People’s Republic of China; 8Traditional Chinese Medicine Department of Rheumatism, Women & Children Health Institute, Shenzhen, People’s Republic of China; 9Department of Rheumatology and Immunology, Peking University People’s Hospital, Beijing, People’s Republic of China; 10Department of Rheumatology and Immunology, Sun Yat-Sen Memorial Hospital, Sun Yat-Sen University, Guangzhou, People’s Republic of China
*These authors contributed equally to this work
Correspondence: Yalin Wu; Qingwen Wang, Email [email protected]; [email protected]
Objective: In primary healthcare, diagnosing rheumatoid arthritis (RA) is challenging due to a general lack of in-depth knowledge of RA by general practitioners (GPs) and the lack of effective tools, leading to high rates of missed diagnosis. This study focuses on a screening model for primary healthcare, aiming to improve early RA screening accuracy and efficiency at a relatively lower cost, reducing delays in GPs’ recognition of RA.
Methods: We randomly selected 2106 participants from the RA group or combined control group (comprising healthy individuals and patients with non-RA rheumatic diseases) at Peking University Shenzhen Hospital as the developing cohort. Guided by experienced rheumatologists, we built a comprehensive database with 26 clinical features. Using 10 classical machine learning algorithms, we developed screening models. Evaluation metrics determined the best model. Employing multivariatelogistic regression results and the best-performing model to identify the least costly features, ensuring applicability in primary healthcare clinics. Subsequently, we retrained and validated our proposed model based on two primary healthcare validation cohorts.
Results: In experiments, the algorithms achieved over 88% accuracy on training and test sets. Random Forest (RF) excelled with 96.20% (95% CI 95.39% to 97.02%) accuracy, 96.22% (95% CI 95.40% to 97.03%) specificity, 96.18% (95% CI 95.37% to 97.00%) sensitivity, and 96.20% (95% CI 95.39% to 97.02%) Areas Under Curves (AUC). A meticulous feature selection identified 11 key features for RA screening. In an external test on two primary healthcare datasets with these features, RF demonstrated an accuracy of 88.435% (95% CI 85.55% to 91.32%), sensitivity of 98.55% (95% CI 97.47% to 99.63%), specificity of 85.56% (95% CI 82.39% to 88.73%), and an AUC of 92.055% (95% CI 89.62% to 94.49%).
Conclusion: The screening model excels in automating prompt identification of RA in primary healthcare, improving the early detection of RA, and reducing delays and associated costs. Our findings contribute positively and are poised to elevate prospective RA management, fostering improvements in healthcare sector responsiveness and resource efficiency.
Keywords: rheumatoid arthritis, machine learning, primary health care
Introduction
Rheumatoid arthritis (RA) is a chronic systemic autoimmune disease characterized by arthralgia, joint swelling, and limited joint movement. According to the newest data from the Global Burden of Disease (GBD) study, the global age-standardized point prevalence of RA is 246.6 per 100000 (95%UI 222.4 to 270.8),1 with a prevalence of 0.42% in mainland Chinese,2 causing a great burden of diseases worldwide. RA patients often experience a protracted history of the disease with increasing disability rates over time. In China, disability rates for RA patients escalate with disease duration: 18.6% for 1–5 years, 43.5% for 5–10 years, 48.1% for 10–15 years, and 61.3% for over 15 years, respectively.3 Early intervention at the “window of opportunity” can effectively impede disease progression, minimize the risk of joint damage, and reduce the likelihood of disability.4 Therefore, it is essential to screen the potential RA patients as soon as possible.
It is noteworthy that mainland China boasts a sizable population with a significant prevalence of RA.5 China’s referral system facilitates two-way referrals, with higher-tier hospitals handling complex cases and suspected cases referred from lower-tier facilities, while clear diagnosis and stable patients being transferred back to primary healthcare for recovery and follow-up, ensuring efficient resource use and care coordination. However, the overall quantity of quality medical resources is inadequate and unevenly distributed. The majority of individuals suspected of having RA initially consult with primary healthcare providers. Unfortunately, general practitioners (GPs) in these clinics, often lacking specialized knowledge in rheumatology, face challenges in obtaining comprehensive diagnostic data and analyzing it for the potential identification of RA patients. This limitation may result in missed diagnosis or misdiagnosis of RA cases, While specific data for China is limited, similar challenges are observed globally, for example, a UK observational study reported a considerable delay in RA patients seeking primary healthcare, averaging four visits to GPs before being referred to specialists.6,7 Although the healthcare systems differ, this example highlights a common issue that may also be relevant in the Chinese context. Consequently, the development of an intelligent potential RA rapid screening system suitable for GPs in primary healthcare clinics has emerged as a crucial challenge and focal point in clinical practice.
While AI algorithms have found applications in the realm of RA, spanning diagnosis, identification, drug efficacy evaluation, prognosis, and risk assessment, they have demonstrated notable advantages.8 Nevertheless, prevailing intelligent decision-making models and systems face limitations in their applicability to the swift screening of potential RA patients in primary healthcare clinics. The primary impediment stems from the absence of access to essential diagnostic tools such as MRI and X-ray images, along with the unavailability of multiple laboratory tests in most primary healthcare facilities.
In this study, we trained 10 classical ML algorithms using a database that included a discovery cohort of RA patients and combined controls gathered from a general hospital. Through an iterative process, we refined the RA screening model to achieve optimal identification performance and identified cost-effective features based on this model. Notably, we established two primary healthcare databases by incorporating the selected features along with clinical data, then fine-tuned and validated our screening model using these databases. The results demonstrate the model’s excellent accuracy in identifying RA cases, underscoring its potential as an effective clinical tool for GPs, expediting timely referrals to specialists, and enhancing the identification rate of RA patients.
Methods
Establishment of the Developing and Validation Cohorts
A retrospective observational developing cohort of 2106 subjects was constructed for the study. All the participants were recruited from Peking University Shenzhen Hospital. The cohort was then divided into two groups according to the diagnosis. One group was 1010 RA patients, who fulfilled the 2010 ACR/EULAR classification criteria and 1987 ACR classification criteria and were followed up by experienced rheumatologists at Peking University Shenzhen Hospital from July 2015 to December 2020. The other was 1096 combined controls comprising 581 patients with non-RA rheumatic diseases and 515 individuals who underwent annual physical examinations from the same hospital and excluded those suffering from RA. The external validation cohorts come from two primary medical centers containing 473 participants (373 non-RA, 197 RA). Both clinical data sets (development and validation) were collected and encoded for ML training and validation. The approach employed in this study is displayed in Figure 1. Our study was conducted in accordance with the principles outlined in the Declaration of Helsinki. The study had obtained approval from the Ethics Committee of Peking University Shenzhen Hospital. This study is a retrospective analysis of anonymized patient data. The data were derived from existing medical records that had been de-identified before analysis. The requirement for obtaining informed consent was waived by the Ethics Committee of Peking University Shenzhen Hospital as the study involved no more than minimal risk to the participants, and the data were not identifiable.
 |
Figure 1 Workflow for model development and validation. The developing cohort was split into training and test sets. Selected features were used to construct and evaluate models based on four metrics. The best-performing model with the highest sensitivity underwent external validation using an independent cohort. |
Dataset and Variables Preparation
The dataset, named “Available RA Screening Dataset for Primary Healthcare (ARASDPH)”, was constructed from the Rheumatoid Arthritis Retrospective Cohort at the Department of Rheumatology and Immunology, Shenzhen Hospital, Peking University, China. The ARASDPH comprises 2106 entries, with 1010 labeled as positive and 1096 as negative, coded as “1” and “0”, respectively. Taking into account the laboratory examination conditions in primary healthcare, 26 features that most effectively describe the disease status were selected from the 2106 participants by three rheumatology experts (WQW, WWQ, HXH), resulting in the creation of a comprehensive database that simultaneously served as the features for analysis, including Age, Gender, White Blood Cell Count (WBC), Lymphocyte Count (LYM), Neutrophil Count (NEU), Hemoglobin Count (HB), Platelet Count (PLT), Glucose (GLU), Uric Acid (UA), Total Cholesterol (TC), Low-Density Lipoprotein (LDL), High-Density Lipoprotein (HDL), Triglycerides (TG), Lactate Dehydrogenase (LDH), Alpha-Fetoprotein (AFP), Carcinoembryonic Antigen (CEA), Erythrocytes Sedimentation Rate (ESR), C-Reactive Protein (CRP), Rheumatic Factor (Rf), Anti-streptococcal Hemolysin O (ASO), Joint Swelling (JS), Joint Tenderness (JT), Limited Joint Movement (LJM), Joint Deformity (JD), Raynaud’s Phenomenon (RP) and Morning Stiffness Greater Than 30 minutes (MS)(Supplementary Table 1).
Predictive factors were collected at the time of the initial presentation. The outcome (RA diagnosis) was determined based on the aforementioned criteria within 3 months of initial assessment. All relevant clinical and laboratory data were extracted from medical records and encoded for ML training and validation. Supplementary Tables 2 and 3 summarizes the characteristics of the developing cohorts and compares these features between the RA and non-RA groups.
In determining which characteristics to include for modeling, we conducted univariate and multivariate logistic regression analyses (Supplementary Table 4) and correlation analyses (Supplementary Figure 1) on 26 features of the developing cohort for an initial evaluation and screening. Subsequently, two rheumatologists (WQW & WWQ), taking into account clinical judgment alongside the outcomes of statistical analyses, decided on the features to be ultimately included in the model, resulting in the selection of all 26 features for inclusion.
The ARASDPH is labeled to indicate whether the diagnosis is RA or not, representing a typical dichotomous classification problem. The ARASDPH is well-structured, exhibiting less than 2% missing values, and all data are numeric, comprising logical, categorical, and floating-point types. The collected data spans from 2015 to 2020.
The Construction of Screening Models
In this study, our goal is to develop an optimal screening model for RA within the ARASDPH dataset. We conducted a systematic evaluation of 10 classical ML algorithms, making this investigation one of the most comprehensive in terms of research and experimentation. The selected algorithms include Decision Tree (DT),9 Logistic Regression, Gaussian Naive Bayes (GNB),10 k-Nearest Neighbors (KNN),8 Random Forest (RF),11 eXtreme Gradient Boosting (XGBoost),10 Gradient Boosting Classifier (GBC),11 and Support Vector Machines (SVM)8 with various kernel functions: Radial Basis Function (SVC kernel= rbf), Linear Kernel Function (SVC kernel= linear), Sigmoid Kernel Function (SVC kernel= sigmoid), and Polynomial Kernel Function (SVC kernel= poly). These methods were chosen for their proven effectiveness in binary classification tasks, which aligns with our objective of distinguishing RA cases from non-RA cases. Furthermore, the diversity of these algorithms—ranging from interpretable models to advanced ensemble and kernel-based methods—ensures a comprehensive exploration of modeling paradigms. This approach balances predictive performance, interpretability, and scalability, making it particularly suitable for developing a screening tool in resource-constrained primary care settings. In studies at the intersection of medicine and AI, key criteria for assessing predictive algorithms encompass accuracy, sensitivity, specificity, and Areas Under Curves (AUC).12 Given that our final model serves as a preliminary screening tool, the optimal model is identified by the highest sensitivity, as high sensitivity ensures early detection and intervention, minimizing the risk of missed diagnoses.
Final Features Selection
This study employed univariate and multivariate logistic regression analysis to assess and rank the significance of 26 features. After confirming the correlation between each feature and the outcome, the features were restructured in the feature space based on their significance. To determine the most effective and economical feature combination, we implemented a systematic feature elimination approach. Initially, features were ranked from highest to lowest significance. We then conducted stepwise elimination, sequentially removing features from most to least significant, retraining the model at each step to evaluate performance. Subsequently, we reversed the process, starting with the least significant features. Features were sequentially removed from least to most significant, with the model retrained at each step to monitor performance changes. This iterative process identified the optimal feature set, balancing predictive accuracy with feature economy, ensuring the final model was both efficient and effective.
Optimization of Parameters and External Validation of the Screening Model
To verify the precision of our screening model, we collected data from two primary healthcare clinics include Taoyuan Primary Healthcare Clinic of the Nanshan district and Fuxin Primary Healthcare Clinic of the Futian district, forming two validation databases that encompass the lowest cost features selected from a pool of 26. We fine-tuned and finalized the parameters of the screening model before validating it and determining the best threshold, utilizing insights gained from these primary healthcare databases. This approach ensures the proposed screening model’s ability to automatically and accurately screen patients with RA in a timely manner within primary healthcare conditions.
Statistics Analysis
Means of normally distributed continuous variables were compared using the T-test, while medians of non-normally distributed continuous variables were compared using the Mann–Whitney test. Categorical variables were compared using the Chi-square test for proportions. Statistical significance was determined by a p-value of less than 0.05. Feature importance and collinearity were assessed using logistic regression and correlation analysis. Statistical analyses were performed using the R software (V.3.5.1). The construction of models was facilitated using Python 3.7, with support from libraries such as NumPy, Pandas, Matplotlib, and Scikit-learn, within the Jupyter Notebook environment.
Results
Performance of Potential RA Screening Models
This section presents the performance outcomes of 10 classical ML algorithms, aiming to identify the optimal algorithm for a screening model based on four key metrics: accuracy, sensitivity, specificity, and AUC. The development and operation of an AI system typically consists of the following four main components: data collection, data preprocessing, feature engineering, and model training and evaluation.
During the preprocessing stage, the study employed the median to handle missing values of non-normalized distributed continuous variables, while outliers were intentionally left untreated, thereby reinforcing the robustness of the screening model. In the phase of selecting the screening model, all features within the database were included. The characteristics of the developing and validation cohorts are presented in Supplementary Tables 2 and 3. The training and evaluation phase of the model encompasses the following steps: initially, the data is normalized for each feature using Equation 1.10

where  is a vector as a result of normalizing the ith feature, the vector
  also represents a set of scalars, signifying the values of the ith feature before normalization.
  and
and  denote the mean and variance of each respective feature. Secondly, the normalized dataset was evenly partitioned into five segments, with four segments employed as a training set for the training phase, and the remaining one utilized as a test set to evaluate the performance of 10 classical ML algorithms. Finally, the accuracy, sensitivity, specificity, and AUC of 10 classical ML algorithms are calculated, and the algorithm with the highest sensitivity is selected as the screening model. Finally, Table 1 shows the results of accuracy, sensitivity, specificity, and AUC computed for 10 classical ML algorithms on the test set. Figure 2 presents the confusion matrices of the 10 machine learning methods.
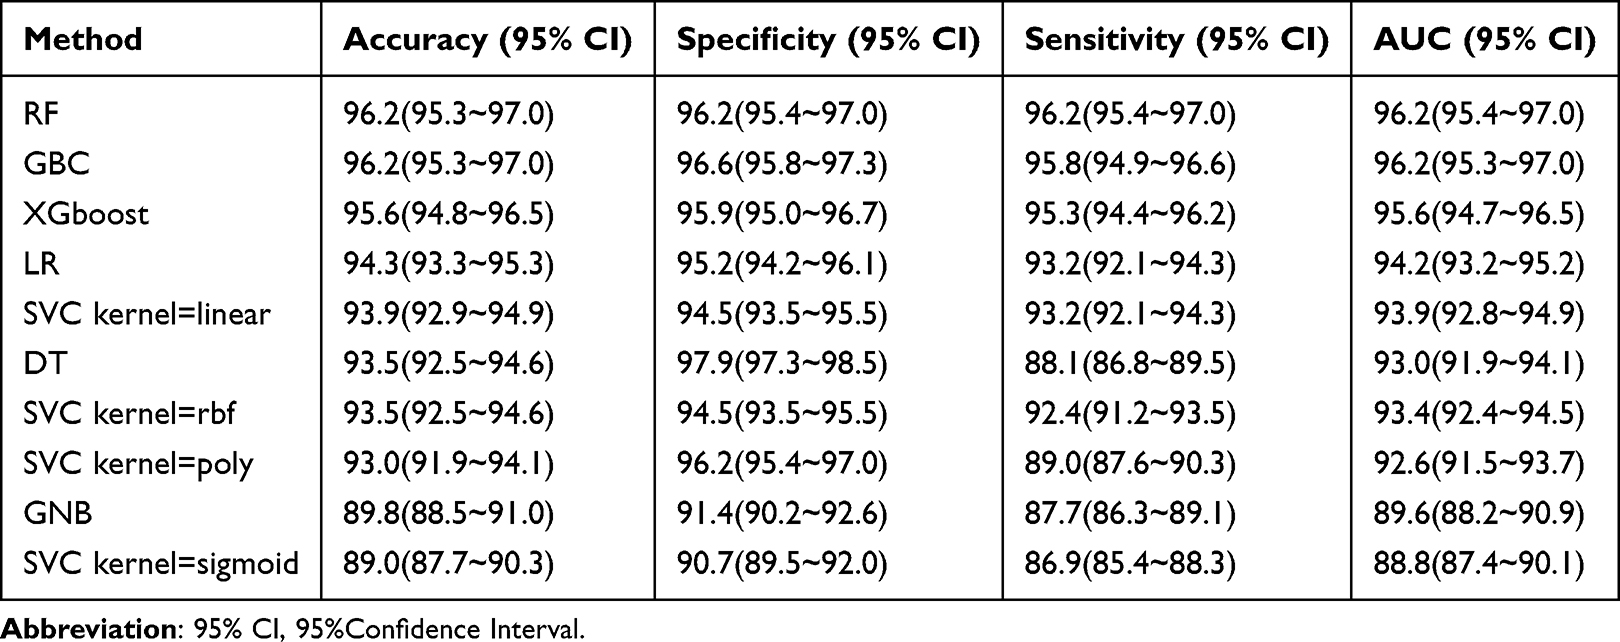 |
Table 1 Performance of 10 ML Algorithms (Values in Percentages) |
 |
Figure 2 The subfigures (a–j) correspond to the confusion matrices of the following algorithms: (a) RF, (b) GBC, (c) XGBoost, (d) LR, (e) SVC linear, (f) DT, (g) SVC rbf, (h) SVC poly, (i) GNB, and (j) SVC sigmoid. |
Based on the results presented in Table 1, RF and GBC undeniably emerge as the top performers. Specifically, the RF algorithm demonstrates the highest accuracy and sensitivity, although its specificity is relatively lower. The sensitivity of a technology or product refers to the ability to correctly recognize that a patient has a disease. The higher the sensitivity, the fewer false-negative results there will be, which will help in the early detection and treatment of diseases. Consequently, in a comprehensive evaluation, RF proves to be the superior performer. Therefore, RF is selected as the best screening model for RA.
Optimal Features Selection Method Based on the Screening Model for RA
In the initial phase, this study assesses the significance of 26 features through the univariate and multivariate logistic regression analysis, ranking them both in descending and ascending order and based on their correlation. The outcomes are presented in Supplementary Table 4. Subsequently, 52 sub-databases of ARASDPH were systematically constructed in accordance with the order (both reverse and forward) of feature importance. Each of the 52 sub-databases is labeled as  .
.  to
to  represent the sub-databases constructed by sequentially removing features from most to least important.
  to
to  represent the sub-databases constructed by sequentially removing features from least to most important. Each of these 52 subspaces was individually tested with the screening model (RF), and their respective accuracy, sensitivity, specificity, and AUC values were obtained and presented in Figures 3 and 4. Among the 26 features, the Rf is identified as the most important, while ASO is the least significant. The results indicate that the sub-database comprising the top 11 important features (Rf, CRP, ESR, UA, HB, PLT, MS, age, JS, JT, JD) yields comparable results to using all features. However, a notable decline in performance is observed when the 11th feature is excluded.
 |
Figure 3 This heatmap shows the performance of models with feature sets decreasing from 26 to 1. The feature combinations are reduced as follows: The initial feature set includes Rf, CRP, ESR, UA, HB, PLT, MS, age, JS, JT, JD, gender, AFP, LDL, NDL, NEU, TG, TC, RP, LYM, WBC, HDL, CEA, JM, GLU, ASO (26 features). Each subsequent feature set removes the last feature from the previous set. The final feature set includes only Rf. For example: The 25-feature set excludes ASO (25 features). The 24-feature set further excludes GLU (24 features). This pattern continues, removing one feature at a time from the end until only Rf remains (1 feature). In summary, features are removed sequentially from the end, reducing one feature at a time until only the first feature, Rf, is left. |
 |
Figure 4 This heatmap shows the performance of models with feature sets decreasing from 26 to 1. The feature combinations are reduced as follows: The initial feature set includes Rf, CRP, ESR, UA, HB, PLT, MS, age, JS, JT, JD, gender, AFP, LDL, NDL, NEU, TG, TC, RP, LYM, WBC, HDL, CEA, JM, GLU, ASO (26 features). Each subsequent feature set removes the first feature from the previous set. The final feature set includes only ASO. For example, The 25-feature set excludes Rf (25 features). The 24-feature set further excludes CRP (24 features). This pattern continues, removing one feature at a time from the front until only ASO remains (1 feature). In summary, features are removed sequentially from the front, reducing one feature at a time until only the last feature, ASO, is left. |
Development of Validation Databases
In this phase, we establish the validation databases using the selected 11 optimal features. These features include ESR, CRP, UA, HB, PLT, JS, MS, JD, Age, Rf, and JT. The validation database consists of two sub-databases sourced from two primary healthcare clinics, which is referred to as the Primary Healthcare Clinics Database (PCDA). The  is built based on the optimal 11 features for test.
Optimization of Parameters and External Validation of the Screening Model
In this stage, the screening model was identified as RF based on ARASDPH, and the optimal set of 11 features was also selected using the RF algorithm. In this part, the parameters of the RF and the best threshold are finalized according to the PCDA. After optimizing parameters and determining the best threshold at 27, the RF achieved an accuracy of 88.435% (95% CI: 85.55%, 91.32%), sensitivity of 98.55% (95% CI: 97.47%, 99.63%), specificity of 85.56% (95% CI: 82.39%, 88.73%), and an AUC of 92.055% (95% CI: 89.62%, 94.49%), in  (Supplementary Tables 5 and 6).
Discussion
In this context, we implemented 10 distinct ML algorithms to differentiate between RA patients and combined controls. Among these, the RF model emerged as the best performance model. In order to simplify the model further, enhance its usability, and reduce its operational costs, we employed the RF model to filter the 26 features included at the beginning, progressively reducing the number of features in the model and assessing its efficacy respectively. We observed that the model maintained its original performance when the number of features was reduced from 26 to 11. However, a significant decrease from 96.58% to 96.2% in model accuracy was noted when the number of features was further reduced to 10 (Figure 3). We subsequently validated our final RF model using external validation cohorts, which included data from two centers. This process yielded a model accuracy of 88.44% (95% CI 85.55% to 91.32%), sensitivity of 98.55% (95% CI 97.47% to 99.63%), specificity of 85.56% (95% CI 82.39% to 88.73%), and an AUC of 92.06% (95% CI 89.62% to 94.49%).
The 26 features initially included in this study were derived from three dimensions. Considering our model is designed for preliminary screening, imaging examinations were excluded to maintain convenience and efficiency. Demographic information, clinical symptoms, and laboratory data were prioritized to balance diagnostic accuracy with ease of use in primary care settings. Demographic factors were incorporated as RA is more prevalent among women and its incidence peaks in women over 50 years old, according to epidemiological studies.13,14 Secondly, clinical symptoms and signs were considered in the model since the collection of these relied primarily on patients’ narratives, physicians’ observations, and physical examinations without the need for specialized equipment or extensive professional knowledge. However, two considerations were imperative: The most common symptoms of RA are joint swelling and pain. Additionally, GPs often lack experience in joint examination. Research on the use of symptoms, signs, and additional tests by GPs in diagnosing newly onset inflammatory arthritis indicated a reliance on typical inflammatory symptoms and signs.15 Therefore, we selected typical and common features in RA patients for the model: joint swelling, limited joint mobility, joint deformity, morning stiffness lasting over 30 minutes, and joint tenderness. Lastly, laboratory examinations were also incorporated into the model due to the fact that RA is not merely a form of arthritis affecting the joints but also involves systemic manifestations beyond the joints. It is not only an autoimmune disorder but also an inflammatory disease. Contemporary research indicates that alterations in immunological and metabolic profiles, as well as inflammatory markers in RA patients, may precede symptomatic onset, which is a phase referred to as preclinical RA.16,17 Therefore, the laboratory tests selected for this study were designed across five different aspects: routine blood cell classification, metabolic indicators, inflammatory factors, immunological markers, and oncological markers.
Routine blood cell counts, including white blood cells, neutrophils, lymphocytes, hemoglobin, and platelets, were chosen due to their relevance in conditions like Felty’s syndrome,18 and thrombocytosis, an RA activity marker.19 Additionally, metabolic indicators such as glucose, uric acid, LDH, TC, LDL, HDL, and TG were included based on their links to inflammation and altered metabolic pathways observed in RA patients.20–25 Inflammatory markers, specifically ESR and CRP, were selected for their established roles in RA classification and disease activity monitoring.26 Although anti-CCP antibodies are highly specific to RA, their limited sensitivity and reduced availability in primary care limit their utility for early screening.27 Instead, Rf, a more widely used immune marker with comparable diagnostic value, was selected. Additionally, ASO was included as an adjunct marker, reflecting its association with inflammatory conditions such as RA.28–30 Lastly, given the elevated oncogenesis risks linked to RA-related immune dysregulation,31 AFP and CEA were incorporated to enhance the model’s predictive accuracy.
We initially trained and determined the final model using the selected features, with the subsequent aim of streamlining the model by minimizing the feature set. This simplification reduces the data input required by GPs when applying the model in clinical settings. The study conducted a significance scoring and ranking of the initial 26 features and retrained using the best-performing and most stable RF. Features were reduced one by one in order of importance score, and it was found the model’s performance remained robust and consistent when pared down to the 11 most critical features.
In these top 11 features, Rf and the acute phase reactant ESR and CRP are identified as the top three most important features, consistent with the laboratory indicators included in the 2010 EULAR/ACR RA classification criteria. However, our study omits the anti-CCP antibody, which is challenging to detect in primary healthcare clinics. Instead, we optimized the classification criteria features for primary healthcare use after further validation. Through iterative model training, we included UA, HB, and PLT as supplementary laboratory indicators outside the classification criteria. These markers are cost-effective, widely available, and typically included in routine examinations conducted at most healthcare facilities. They serve as adjuncts to Rf and inflammatory markers in the screening of RA. Among them, uric acid, a product of purine metabolism, ranked fourth in importance. While it can neutralize reactive oxygen species (ROS) extracellularly, elevated intracellular levels may induce oxidative stress by disrupting mitochondrial function and generating ROS.32 Oxidative stress plays a pivotal role in the pathogenesis of RA, contributing to synovial inflammation, cartilage degradation, and bone erosion.33 Hyperuricemia has been linked to increased systemic inflammation and oxidative damage, both of which are hallmarks of RA. Our study confirms the importance of UA in recognizing RA. Regarding blood cell counts, hemoglobin and platelet counts ranked fifth and sixth, respectively. Previous research has already found a relationship between these levels and RA disease activity.34 Our study reaffirms such a relationship in terms of blood cell changes distinct from healthy individuals. In symptoms and signs, joint swelling, joint tenderness, morning stiffness>30 minutes, and existing joint deformities were identified as the four most important symptoms and signs in this RA screening model. In demographic information, age was more significant than gender.
This study for the first time employed 10 mainstream ML algorithms to convert the complex disease characteristics of RA into easily collectible and monitorable clinical information. A database was constructed specifically for the early screening of RA. Based on this database, the decision model was determined and optimized. The model achieved high accuracy in both training and testing sets, ensuring its clinical applicability and overcoming the technical challenge of lacking precise automated decision models in RA screening. Our research involved building a database with clinical data and modeling it with various ML algorithms, subsequently identifying the optimal parameters to develop an early screening model for RA and validating it with an external validation set to ensure the model’s credibility. Based on this model, an intelligent decision support system was developed, providing significant guidance for clinical practice. Additionally, beyond achieving a precise RA screening model, the study also platformed the algorithms, specifically developing an intelligent system based on the RF algorithm. This transitioned the screening model from laboratory theory to a practical tool usable in primary healthcare settings, enabling AI to serve clinical needs, as well as facilitating early screening and timely referral of RA patients to medical institutions capable of conducting further definite diagnostics.
In recent years, numerous studies have utilized ML for omics analyses, including genomics, transcriptomics, proteomics, and metabolomics, to assess the associations between various biomolecules and RA.35,36 For instance, Liu et al constructed an accurate diagnostic model for RA using ML methods based on nine key genes.37 Additionally, diagnostic models developed from the expression of inflammatory cytokines in serum have also been reported.38 The advantage of incorporating omics data into medical decision-making lies in its ease of acquisition from bodily fluids and its potential to provide a wealth of information. However, this approach is simultaneously more complex and costly, impacting its practical application in clinical settings. In contrast, this study focuses on the construction of an efficient ML model based on readily available and common clinical information. It has identified the significance of common indicators such as UA, HB, PLT, etc, in classifying RA. This facilitates the model’s deployment in primary healthcare settings, contributing to the early screening of RA patients at primary care facilities. This, in turn, enables timely referrals to more specialized institutions for further comprehensive diagnostics, enhancing the overall healthcare management for individuals with RA.
However, our study has limitations. Firstly, as a multi-center retrospective study, the heterogeneity across centers in terms of diagnostic processes, patient demographics, and data collection methods, might have influenced our results. Although the developing cohort was from a single center, future studies should include training with data from multiple centers and validate findings in more primary healthcare clinics. Secondly, the representativeness of our data set is limited, which could constrain the generalizability of our model. Despite the comprehensive consideration of feature selection from multiple dimensions, many other RA-related metabolic, immune, and inflammatory markers like liver enzymes, ferritin, and serum amyloid A could be included. Additionally, the study did not incorporate data on past medical history, family history, environmental factors, or imaging studies, possibly introducing selection bias. Secondly, the dataset was collected from already diagnosed RA patients, which may limit the model’s application in early RA identification. Therefore, the predictive model is more suitable for screening undiagnosed RA patients in primary healthcare. Future research should involve multicenter prospective studies in larger populations and build extensive datasets encompassing more comprehensive patient characteristics. Moreover, it is important to note that the clinical applicability of an AI model cannot be solely represented by its accuracy, a common limitation of AI.
In conclusion, our screening model holds promise for aiding GPs in primary healthcare to screen potential RA patients and refer them to rheumatologists timely, filling the gap in effective RA screening tools at this level, and potentially improving the diagnosis rate, prognosis, and quality of life for RA patients.
Acknowledgments
This work was supported by the Shenzhen Medical Research Fund (C2404002, C2301008), National Natural Science Foundation of China (81974253), Treatment and Prevention Integration Project of Shenzhen Municipal Health Commission (0102018-2019-YBXM-1499-01-0414), Shenzhen Key Laboratory of Immune and Inflammatory Diseases (ZDSYS20200811143756018), Key Project of Basic Research of Shenzhen Science and Technology Innovation Commission (JCYJ20200109140203849). Scientific Research Projects of Medical and Health Institutions of Longhua District, Shenzhen (2020023, 2021039, 2022046).
Disclosure
The authors report no conflicts of interest in this work.
References
1. Safiri S, Kolahi AA, Hoy D, et al. Global, regional and national burden of rheumatoid arthritis 1990–2017: a systematic analysis of the global burden of disease study 2017. Ann Rheum Dis. 2019;78:1463–1471. doi:10.1136/annrheumdis-2019-215920
2. Zeng XF, Zhu SL, Tan AC, et al. Disease burden and quality of life of rheumatoid arthritis in China: a systematic review. Chin J Evidence-Based Med. 2013;13:300–307.
3. Geng Y, Xie X, Wang Y, et al. The standardized diagnosis and treatment of rheumatoid arthritis. Zhonghua Nei Ke Za Zhi. 2022;61:51–59. doi:10.3760/cma.j.cn112138-20210616-00426
4. van Nies JAB, Krabben A, Schoones JW, et al. What is the evidence for the presence of a therapeutic window of opportunity in rheumatoid arthritis? A systematic literature review. Ann Rheum Dis. 2014;73:861–870. doi:10.1136/annrheumdis-2012-203130
5. Zeng QY, Chen R, Darmawan J, et al. Rheumatic diseases in China. Arthritis Res Ther. 2008;10:R17. doi:10.1186/ar2368
6. Stack RJ, Nightingale P, Jinks C, et al. Delays between the onset of symptoms and first rheumatology consultation in patients with rheumatoid arthritis in the UK: an observational study. BMJ Open. 2019;9:e24361. doi:10.1136/bmjopen-2018-024361
7. van Nies JAB, Brouwer E, van Gaalen FA, et al. Improved early identification of arthritis: evaluating the efficacy of Early Arthritis Recognition Clinics. Ann Rheum Dis. 2013;72:1295–1301. doi:10.1136/annrheumdis-2012-202289
8. Momtazmanesh S, Nowroozi A, Rezaei N. Artificial intelligence in rheumatoid arthritis: current status and future perspectives: a state-of-the-art review. Rheumatol Ther. 2022;9:1249–1304. doi:10.1007/s40744-022-00475-4
9. Song W, Wang A, Chen Y, et al. Design of a flexible wearable smart sEMG recorder integrated gradient boosting decision tree based hand gesture recognition. IEEE T Biomed Circ S. 2019;13:1563–1574. doi:10.1109/TBCAS.2019.2953998
10. Wu Y, Zhang Q, Hu Y, et al. Novel binary logistic regression model based on feature transformation of XGBoost for type 2 Diabetes Mellitus prediction in healthcare systems. Future Gener Comput Syst. 2022;129:1–12. doi:10.1016/j.future.2021.11.003
11. Sotnikov D, Lyly M, Salmi T. Prediction of 2G HTS tape quench behavior by random forest model trained on 2-D FEM simulations. IEEE T Appl Supercon. 2023;33:1–5. doi:10.1109/TASC.2023.3262212
12. Fayaz Aashiq S, Joy Kinol AM, Ramani P. Detection of diabetics using support vector machine algorithm in comparison with K nearest neighbour algorithm to measure accuracy,
13. Finckh A, Gilbert B, Hodkinson B, et al. Global epidemiology of rheumatoid arthritis. Nat Rev Rheumatol. 2022;18:591–602. doi:10.1038/s41584-022-00827-y
14. van der Woude D, van der Helm-van Mil AHM. Update on the epidemiology, risk factors, and disease outcomes of rheumatoid arthritis. Best Pract Res Clin Rheumatol. 2018;32:174–187. doi:10.1016/j.berh.2018.10.005
15. Newsum EC, de Waal MWM, van Steenbergen HW, et al. How do general practitioners identify inflammatory arthritis? A cohort analysis of Dutch general practitioner electronic medical records. Rheumatology. 2016;55:848–853. doi:10.1093/rheumatology/kev432
16. Nielen MMJ, van Schaardenburg D, Reesink HW, et al. Specific autoantibodies precede the symptoms of rheumatoid arthritis: a study of serial measurements in blood donors. Arthritis Rheum. 2004;50:380–386. doi:10.1002/art.20018
17. Jorgensen KT, Wiik A, Pedersen M, et al. Cytokines, autoantibodies and viral antibodies in premorbid and postdiagnostic sera from patients with rheumatoid arthritis: case-control study nested in a cohort of Norwegian blood donors. Ann Rheum Dis. 2008;67:860–866. doi:10.1136/ard.2007.073825
18. Owlia MB, Newman K, Akhtari M. Felty’s syndrome, insights and updates. Open Rheumatol J. 2014;8:129–136. doi:10.2174/1874312901408010129
19. Harifi G, Sibilia J. Pathogenic role of platelets in rheumatoid arthritis and systemic autoimmune diseases: perspectives and therapeutic aspects. Saudi Med J. 2016;37:354–360. doi:10.15537/smj.2016.4.14768
20. Yeudall S, Upchurch CM, Seegren PV, et al. Macrophage acetyl-CoA carboxylase regulates acute inflammation through control of glucose and lipid metabolism. Sci Adv. 2022;8:q1984. doi:10.1126/sciadv.abq1984
21. Grohmann U, Mondanelli G, Belladonna ML, et al. Amino-acid sensing and degrading pathways in immune regulation. Cytokine Growth F R. 2017;35:37–45. doi:10.1016/j.cytogfr.2017.05.004
22. Weyand CM, Goronzy JJ. Immunometabolism in early and late stages of rheumatoid arthritis. Nat Rev Rheumatol. 2017;13:291–301. doi:10.1038/nrrheum.2017.49
23. Yang Z, Fujii H, Mohan SV, et al. Phosphofructokinase deficiency impairs ATP generation, autophagy, and redox balance in rheumatoid arthritis T cells. J Exp Med. 2013;210:2119–2134. doi:10.1084/jem.20130252
24. Giera M, Ioan-Facsinay A, Toes R, et al. Lipid and lipid mediator profiling of human synovial fluid in rheumatoid arthritis patients by means of LC–MS/MS. Biochimica et Biophysica Acta. 2012;1821:1415–1424. doi:10.1016/j.bbalip.2012.07.011
25. Charles-Schoeman C, Lee YY, Grijalva V, et al. Cholesterol efflux by high density lipoproteins is impaired in patients with active rheumatoid arthritis. Ann Rheum Dis. 2012;71:1157–1162. doi:10.1136/annrheumdis-2011-200493
26. Aletaha D, Neogi T, Silman AJ, et al. Rheumatoid arthritis classification criteria: an American College of Rheumatology/European League Against Rheumatism collaborative initiative. Ann Rheum Dis. 2010;69:1580–1588. doi:10.1136/ard.2010.138461
27. Rantapää Dahlqvist S, de Jong BAW, Berglin E, et al. Antibodies against cyclic citrullinated peptide and IgA rheumatoid factor predict the development of rheumatoid arthritis. Arthritis Rheum. 2003;48:2741–2749. doi:10.1002/art.11223
28. Zhu JN, Nie LY, Lu XY, et al. Meta-analysis: compared with anti-CCP and rheumatoid factor, could anti-MCV be the next biomarker in the rheumatoid arthritis classification criteria? Clin Chem Lab Med. 2019;57:1668–1679. doi:10.1515/cclm-2019-0167
29. Nordberg LB, Lillegraven S, Lie E, et al. Patients with seronegative RA have more inflammatory activity compared with patients with seropositive RA in an inception cohort of DMARD-naive patients classified according to the 2010 ACR/EULAR criteria. Ann Rheum Dis. 2017;76:341–345. doi:10.1136/annrheumdis-2015-208873
30. Ben-Chetrit E, Moses AE, Agmon-Levin N, et al. Serum levels of anti-streptolysin O antibodies: their role in evaluating rheumatic diseases. Int J Rheum Dis. 2012;15:78–85. doi:10.1111/j.1756-185X.2011.01668.x
31. Yuan S, Chen J, Ruan X, et al. Rheumatoid arthritis and risk of site-specific cancers: Mendelian randomization study in European and East Asian populations. Arthritis Res Ther. 2022;24:270. doi:10.1186/s13075-022-02970-z
32. Panoulas VF, Douglas KMJ, Milionis HJ, et al. Serum uric acid is independently associated with hypertension in patients with rheumatoid arthritis. J Hum Hypertens. 2008;22:177–182. doi:10.1038/sj.jhh.1002298
33. Wang Z, Wang W, Xiang T, et al. Serum uric acid as a diagnostic biomarker for rheumatoid arthritis–associated interstitial lung disease. Inflammation. 2022;45:1800–1814. doi:10.1007/s10753-022-01661-w
34. Padjen I, Öhler L, Studenic P, et al. Clinical meaning and implications of serum hemoglobin levels in patients with rheumatoid arthritis. Semin Arthritis Rheu. 2017;47:193–198. doi:10.1016/j.semarthrit.2017.03.001
35. Song X, Lin Q. Genomics, transcriptomics and proteomics to elucidate the pathogenesis of rheumatoid arthritis. Rheumatol Int. 2017;37:1257–1265. doi:10.1007/s00296-017-3732-3
36. Lin E, Lane H. Machine learning and systems genomics approaches for multi-omics data. Biomark Res. 2017;5:2. doi:10.1186/s40364-017-0082-y
37. Liu J, Chen N. A 9 mRNAs-based diagnostic signature for rheumatoid arthritis by integrating bioinformatic analysis and machine-learning. J Orthop Surg Res. 2021;16:44. doi:10.1186/s13018-020-02180-w
38. Heard BJ, Rosvold JM, Fritzler MJ, et al. A computational method to differentiate normal individuals, osteoarthritis and rheumatoid arthritis patients using serum biomarkers. J R Soc Interface. 2014;11:20140428. doi:10.1098/rsif.2014.0428
 © 2025 The Author(s). This work is published and licensed by Dove Medical Press Limited. The
full terms of this license are available at https://www.dovepress.com/terms.php
and incorporate the Creative Commons Attribution
- Non Commercial (unported, 3.0) License.
By accessing the work you hereby accept the Terms. Non-commercial uses of the work are permitted
without any further permission from Dove Medical Press Limited, provided the work is properly
attributed. For permission for commercial use of this work, please see paragraphs 4.2 and 5 of our Terms.
© 2025 The Author(s). This work is published and licensed by Dove Medical Press Limited. The
full terms of this license are available at https://www.dovepress.com/terms.php
and incorporate the Creative Commons Attribution
- Non Commercial (unported, 3.0) License.
By accessing the work you hereby accept the Terms. Non-commercial uses of the work are permitted
without any further permission from Dove Medical Press Limited, provided the work is properly
attributed. For permission for commercial use of this work, please see paragraphs 4.2 and 5 of our Terms.
Recommended articles
Association Between Autoimmune Diseases and Sarcopenia: A Two-Sample Mendelian Randomization Study
Su Q, Jin C, Yang Y, Wang J, Wang J, Zeng H, Chen Y, Zhou J, Wang Y
Clinical Epidemiology 2023, 15:901-910
Published Date: 25 August 2023
Identification of Disulfidptosis-Related Genes and Molecular Subgroups in Rheumatoid Arthritis for Diagnostic Model and Patient Stratification
Liu X, Wang S, Du X, Wang Y, Mo L, Li H, Qu Z, Wang X, Sun J, Li Y, Wang J
Journal of Inflammation Research 2025, 18:4157-4175
Published Date: 19 March 2025
Role of Gut Microbiota in the Development of Some Autoimmune Diseases
Cui X, Cong Y
Journal of Inflammation Research 2025, 18:4409-4419
Published Date: 25 March 2025