")
Back to Journals » Advances in Medical Education and Practice » Volume 15
Evaluation of the Educational Environment of Orthopedic Residency Training Programs in Saudi Arabia: A PHEEM-Based Study
Authors Aljuhani W, Mohamed TA , Alanazi A
Received 19 June 2024
Accepted for publication 22 October 2024
Published 25 November 2024 Volume 2024:15 Pages 1163—1172
DOI https://doi.org/10.2147/AMEP.S474027
Checked for plagiarism Yes
Review by Single anonymous peer review
Peer reviewer comments 2
Editor who approved publication: Dr Md Anwarul Azim Majumder
Wazzan Aljuhani,1– 3 Tarig Awadelkarim Mohamed,4 Abdullah Alanazi1,2
1Department of Orthopedic Surgery, Ministry of the National Guard – Health Affairs, Riyadh, Saudi Arabia; 2King Abdullah International Medical Research Center, Riyadh, Saudi Arabia; 3King Saud Bin Abdulaziz University for Health Sciences, Riyadh, Saudi Arabia; 4College of Medicine, Department of Medical Education, King Saud Bin Abdulaziz University for Health Sciences, Riyadh, Saudi Arabia
Correspondence: Abdullah Alanazi, Email [email protected]
Objective: This study aimed to assess the quality of the educational environments within which an orthopedic residency training program is being conducted throughout Saudi Arabia and to identify the areas of weaknesses so that the necessary improvements can be made to build a healthy and supportive environment.
Methods: This cross-sectional study included all orthopedic residents in Saudi Arabia and was surveyed using the validated Postgraduate Health Educational Environment Measure (PHEEM). We used Google Forms to Email the online survey to Saudi trainees in the orthopedic residency program from January 1 through September 30, 2022.
Results: The majority of participants were between 26 and 30 years; 15.6% were women. Among the subscales of PHEEM, perception of role autonomy scores were statistically significantly associated with participants’ regions and their level of training (p = 0.026 and p = 0.019, respectively). The association of perception of teaching and participants’ regions was also statistically significant (p = 0.004). The mean score for the perception of social support subscale was 25.99, which indicates that residents are generally satisfied with the level of support they receive in the training program. However, there is still room for improvement in this area.
Conclusion: The overall PHEEM score was positive but highlighted areas for improvement. Role autonomy and instructional subscales were perceived positively, yet still have room for growth. Social support showed more advantages than disadvantages. Despite the generally favorable environment, enhancements are needed in workloads, working hours, clarity of clinical protocols, and teaching supervision quality.
Keywords: residency program, orthopedic board, education, evaluation, training
Introduction
There is increasing interest in research examining the learning environments of residency programs worldwide and locally. The learning environment and facility of each program play an essential role, as healthy and supportive environments are thought to lead to better outcomes in medical education. By contrast, an unsupportive environment may affect the level of medical education the trainees receive and lead to mental problems.1 Therefore, assessment of the learning environment is crucial in delivering high-impact educational and training attainment. Their accomplishments and successes primarily influence trainees’ perceptions of their educational environments. It has been discovered that trainee and trainer development is influenced by how positive their educational environments are.2,3 Knowing students’ and trainees’ views of their learning environments, as well as the factors that influence them, is believed to aid in the modification of these factors to ensure that residents are satisfied with the level of teaching such that both educators and trainees can achieve their goals.4
A popular method for evaluating the learning environment and training program in hospitals is the use of the Postgraduate Hospital Educational Environment Measure (PHEEM). It includes a total score and some subscale scores that shed light on several facets of the learning environment, including autonomy, instruction, and social support. Several studies applying various methods have been conducted to assess the learning environment and measure trainees’ perceptions of those environments. Previously employed learning environment assessments include the PHEEM and the Dundee Ready Education Environment Measure (DREEM).5–7 One PHEEM assessment across departments in a single hospital in Pakistan reported that the teaching subscale had the highest overall score, neurology had the highest score across branches, and the lowest overall score was reported for anesthesia.8 Similarly, a University of Nigeria Teaching Hospital assessment found that the overall environment was more positive than negative, but significant differences in the total score and subscales were found across different specialties.9
Regarding the residency programs in Saudi Arabia, a study evaluating the educational environment of the primary care training programs in Saudi Arabia using a PHEEM survey7 identified certain elements, such as the curriculum and training methods, for which changes were necessary to meet family physicians’ needs. In addition, they found that training institutions and the level of training were positive predictors of the educational environment. Another study regarding the Family Medicine environment in Riyadh reported a better result than the previous articles emphasizing the continuous Evaluation of the environment, which could be applied to different specialties.10 PHEEM has also been used for learning environment assessment in Urology, and residents in Saudi Arabia reported low satisfaction; no differences were found across training levels or geographic zones. However, there were differences between hospitals in terms of teaching quality,11 which highlights the need to assess the educational environment of a training program to identify areas of concern that require further development.
Orthopedic residency is a 5-year training program under the Saudi Commission for Health Specialties (SCFHS). After completing five years of training and passing the final board exam, residents graduate as specialists in orthopedic surgery. The current study aimed to assess the quality of the educational environment of the orthopedic residency training program to identify areas of weaknesses and suggest improvements necessary to build a healthy and supportive environment.
Materials and Methods
Study Design and Participants
This cross-sectional study included total 141 orthopedic residents in Saudi Arabia using the validated PHEEM.12 An online survey was sent to Saudi trainees in the orthopedic residency training program from January 1 through September 30, 2022, using Email created via Google Forms. To reduce the risk of bias and to improve the response rate, the survey was distributed to participants by an independent third party who had been given clear instructions about the survey. The Email with the same survey was resent to the participants after four weeks with an instruction that anyone who already completed the first survey must not participate again, in order to improve the response rate. The second Email was sent as a result of low response rate in first Survey.
Participants
Participants were recruited from the orthopedic residency training program at a large academic medical center in Saudi Arabia. Inclusion criteria were as follows: Currently enrolled in the orthopedic residency training program, Age 18 years or older, Able to read and speak English.
Exclusion criteria were as follows: Cognitive impairment, Severe psychiatric illness, Active substance abuse.
Data Collection
The questionnaire consisted of socio-demographic characteristics (age, gender, region, marital status), professional characteristics (level of training, health sector), and PHEEM survey items.12 PHEEM comprises 40 questions rated on a 5-point Likert13 scale ranging from 4 (strongly agree) to 0 (strongly disagree). Questions are divided into three categories and scored between 0 and 160 points.
- Perception of role autonomy consists of 14 items with a maximum score of 56.
- Perception of teaching subscale contains 15 questions with a maximum score of 60.
- Perception of social support contains 11 questions with a maximum score of 44.
The scale items are reversed for questions 7, 8, 11, and 13 for correct score analysis because they include negative statements.12
The overall survey scores were interpreted as follows: scores from 0 – 40 indicate a very poor educational environment; 41 – 80 indicates an abundance of problems; 81 – 120 indicates that the environment is more positive than negative, but there are some areas of concern where improvements are needed; 121 – 160 indicates an excellent educational environment.12
The interpretation of the scores for the perception of role autonomy, teaching subscales, and social support subscales was as follows:
Perception of role autonomy:
* 0 – 14: Very poor.
* 15 – 28: A negative view of one’s role
* 29 – 42: A more positive perception of one’s job
* 43 – 56: Excellent perception of one’s job
Teaching subscales:
* 0 – 15: Very poor quality.
* 16 – 30: In need of some retraining.
* 31 – 45: Moving in the right direction.
* 46 – 60: Model teachers
Social support:
* 0 – 11: Non-existent.
* 12 – 22: Not a pleasant place.
* 23 - 33: More pros than cons.
* 34 – 44: A good supportive environment.
Cronbach’s alpha in the current study is 0.95 for the 40 statements and 0.92 for the teaching subscale, which is considered excellent. The role autonomy and social support subscales showed good reliability.
Statistical Analysis
Descriptive statistics were analyzed using SPSS. v. 23.0 (IBM Corp., Armonk, NY, USA), and the data analysis process we used comprised two stages. The first stage included a descriptive analysis where numerical variables were reported in terms of means and standard deviations, while categorical variables were described using frequencies and percentages. The second stage included Likert13 scale analysis and hypothesis testing using the chi-square test. The reliability of the survey was tested using Cronbach’s alpha.
Results
Of the 491 registered residents, only 141 (28.7%) completed the survey. Of the 5640 possible responses, there were no missing values, suggesting that the questionnaire was practical and understandable. The demographic characteristics of participants are summarized in Table 1. Most participants were aged between 26 and 30 years, and only 15.6% were women. R3 was the most reported level of training (26.2%), followed by R4 (24.8%) and R2 (20.6%). The highest proportion of the sample worked at the National Guard (38.3%), followed by the Ministry of Health (30.5%).
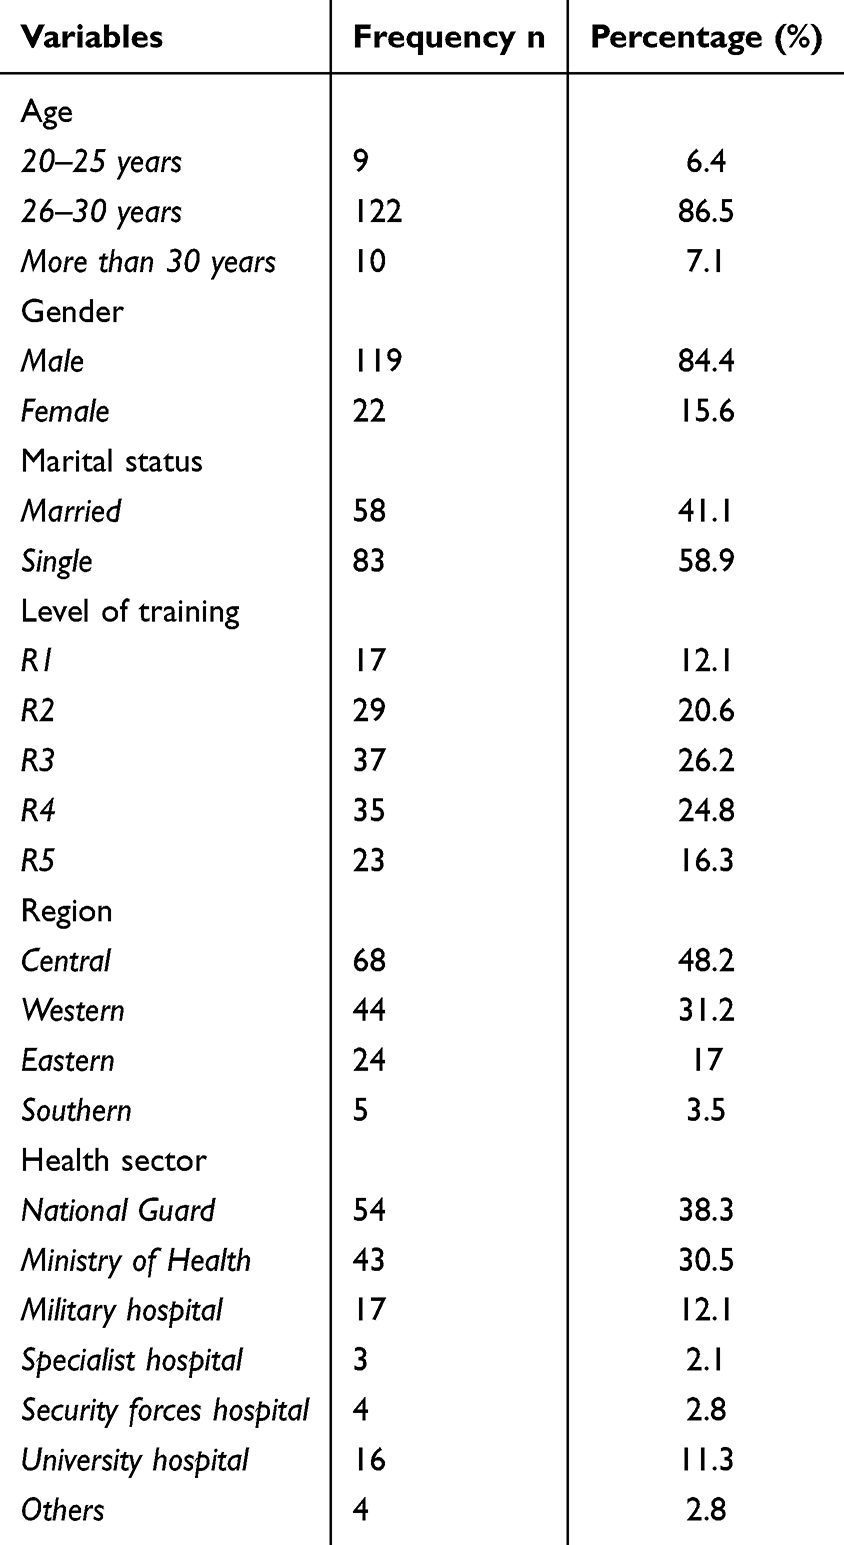 |
Table 1 Socio-Demographic Characteristics |
Table 2 summarizes the mean scores for each question in the survey. The overall PHEEM score was 92.67, representing more positive than negative ratings while still indicating room for improvement. The overall score for perception of role autonomy was 30.79 out of 56. The teaching and social support subscales scored a mean of 35.88 and 25.99, respectively. The majority of the items were ranked between 2 and 3. Only one highly rated item scored above a 3: “I have good collaboration with other doctors in my grade.” Seven items were poorly rated, with a mean score of less than 2.
 |
Table 2 Postgraduate Health Educational Environment Measures (Mean Score) |
Table 3 reports the associations between PHEEM scores and socio-demographic factors (level of training, region, health sector). There was a statistically significant association between the perception of role autonomy score (PHEEM) and participants’ level of training and region (p = 0.019, p = 0.026). Statistically significant associations were found between the perception of teaching and participants’ regions (p = 0.004), perception of social support and region (p = 0.008), and between the overall PHEEM score and both participants’ level of training and region (p =0.037 and p =0.007, respectively). No significant difference was found between the health sector and overall PHEEM scores or the perception of role autonomy, teaching, and social support subscales.
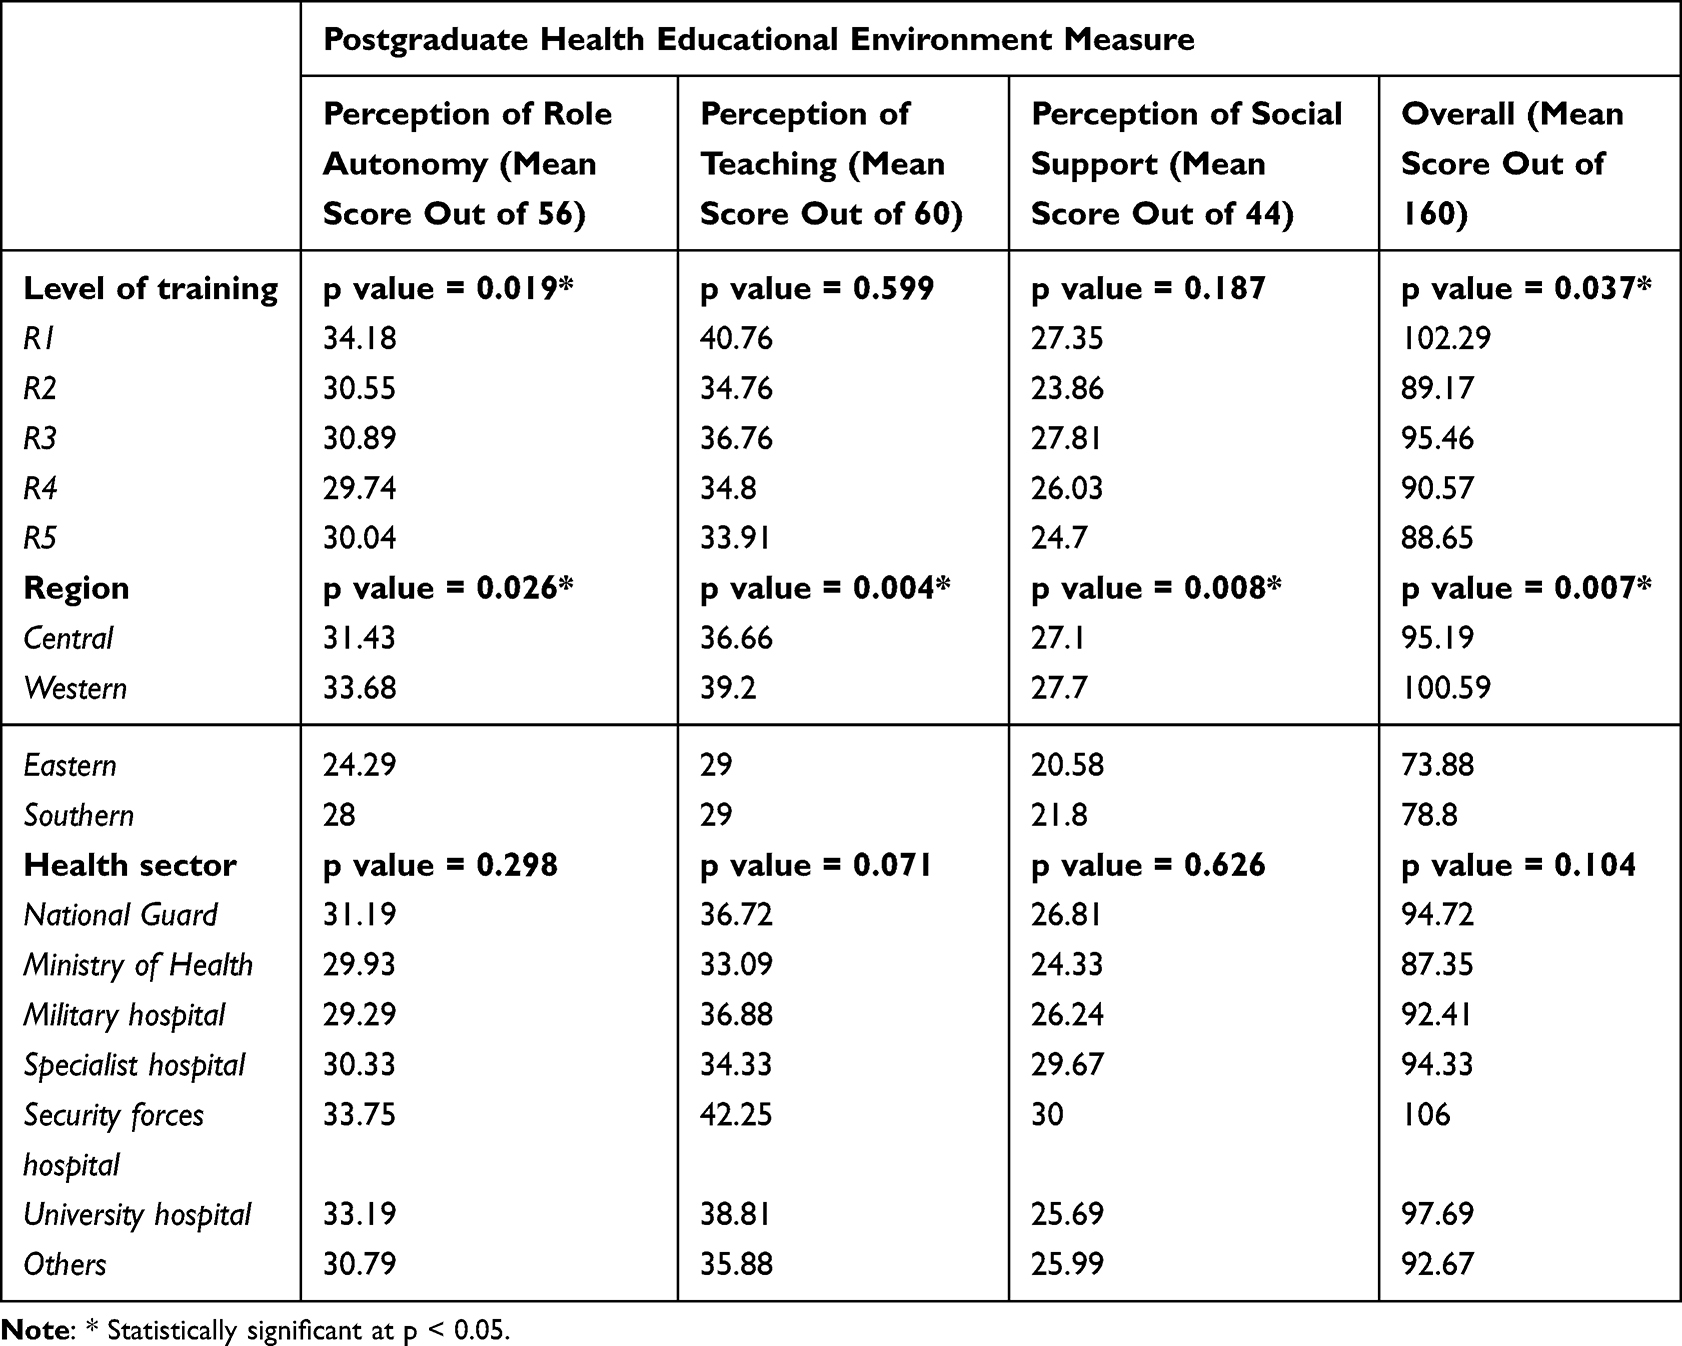 |
Table 3 Comparison of PHEEM Scores of Participants with Socio-Demographics |
The results show the reliability of the subscales. The perception of role autonomy subscale consisted of 14 items; α = 0.86, indicating good reliability. The perception of the teaching subscale consists of 15 items; α = 0.93, indicating excellent reliability. The perception of social support subscale consists of 11 items; with good reliability (α = 0.80), and the overall scale comprises 40 items (α = 0.95).
Discussion
The learning process of trainees in residency programs must be assessed regularly to gauge the effectiveness of changes and new approaches and to provide relevant evaluations as the learning environment evolves owing to changes in technology as well as knowledge and medical procedures. Certain validated learning environment assessment tools, such as PHEEM, are available to identify the weaknesses and strengths of educational programs. Our study was, to our knowledge, the first to utilize PHEEM to evaluate the learning environment of the orthopedic residency training program in Saudi Arabia. This study was conducted to provide a basis for program directors and stakeholders to make decisions to identify the problems in the system and to advocate for the development of the quality and implementation of the residency program.
The articles that adopted and reported data using the PHEEM between 2005 and October 2015 were subjected to a systematic review. There were 30 studies in total, with information from 14 different nations. There were noticeable variations in the PHEEM ratings across disciplines, training levels, and clinical training sites. There were notable relationships between PHEEM scores and ITE performance (positive correlation) and level of burnout (negative correlation) as well as common strengths and weaknesses in learning environments.14
The residents participated in this study, with R3 and R4 representing almost half of the participants. Residents in the final stages of the program were expected to judge the program more accurately than junior residents; however, only approximately 40% of participants were seniors. The level of training had an effect on the overall total PHEEM score and the teaching subscale (p < 0.05), which contradicted the results of the urology program in Saudi Arabia.11 We noticed that higher scores were reported by junior residents, and lower scores were given by seniors. This difference may be attributed to a lack of adequate hands-on experience and insufficient teaching of surgical skills.
A similar study with a population of 131 students had a median age of 28 years (interquartile range: 4), and 43.8% of them were men. A total of 87.9% of residents responded to the poll. Of these, 34.1% were pursuing surgical residencies and 65.9% were pursuing medical residencies. With a mean total mental wellness of 52.96 8.44, the mean PHEEM score was 107.96 18.88, the mean happy emotions subscale was 29.32 5.18, and the mean positive functioning was 23.61 3.57. The total PHEEM score and each of the two subscales measuring mental health were shown to be positively and moderately correlated (p 0.001).15
Similarly, the majority of the participants were from the central region, representing approximately half of the sample. This was also reported in a urology study, although in the study, the region appeared to have no effect on the educational environment.11 However, in our study, the region displayed a significant difference in terms of teaching, autonomy, social support, and the total score of PHEEM. This can be attributed to the fact that the central and western provinces have provided training in orthopedic residency earlier than others. Furthermore, a diverse group of centers and programs is present in the central and western provinces. The majority of consultants completed their training in North America and Europe, and they might have implemented what was being developed abroad in the central province.
Residents from different health sectors did not show any differences in the total score and other subscales, including teaching, autonomy, and social support. This might indicate that minor differences among local sectors did not differ significantly, as the orthopedic curriculum is similarly applied all over Saudi Arabia. In contrast to the urology residency program, urology residents from the National Guard displayed higher satisfaction with their teaching environment and the available time for education.
Similarly, urology residents from the Security Forces Hospital perceived more involvement in teamwork and decision-making.11 The present study showed that only one item was rated positively (mean score of three or more), while seven items were rated poorly (mean score of two or less). The only positively rated item was (I have good collaboration with other doctors in my grade) from the social support subscale. This can be encouraged by stakeholders to improve collaboration among colleagues to create a cooperative environment. The lowest recorded score was 1.35 for item 26 (there are adequate catering facilities when I am on call). This result is similar to that of a urology study,11 where the authors stated that this could be improved by enhancing the center management, including adding more catering facilities to ameliorate call time for residents. Poorly rated items from the role autonomy subscales, including those that evaluate workload and describe working hours, are named inappropriately. Only one item was poorly rated in the teaching subscale (I have enough clinical learning opportunities for my needs, mean score 1.96).
No other item in the teaching subscale was rated poorly or positively. Regarding social support, only one item was positively rated, and one item was poorly rated. The total inventory score was 92.67, which reflects more positive than negative score; however, there is room for improvement. The perception of role autonomy reflects a more positive perception of one’s job. The teaching subscale was perceived as moving in the right direction, pointing towards that the teaching subscale is positive, but there is still room for improvement. Whereas social support indicated more advantages than disadvantages. In comparison to the urology and family medicine programs in Saudi Arabia,7,11 the orthopedic residency program scored better on the total inventory score and the three subscales. However, the results of their studies11 were published in 2015, which may have improved over the last few years.
Cronbach’s alpha in the current study is 0.95 for the 40 statements and 0.92 for the teaching subscale, which is considered excellent. The role autonomy and social support subscales showed good reliability. PHEEM’s high reliability was also demonstrated by previous studies as it was shown to be a feasible and reliable questionnaire for the assessment of weaknesses and strengths of an educational program.5–12 In a similar study, 193 interns and residents participated in a study and answered the PHEEM. There were no missing responses. The 40-item survey had an internal consistency of 0.936 (Cronbach’s alpha), and a maximum score of 160. The mean score for PHEEM was 89.21 ± 21.6.16
One other study conducted by Ezomike et al from Nigeria in 2020 concluded that in order to provide students with a better learning environment with more facilities and supportive systems, faculty members and course managers must put more effort into observing principles of instructional designs, creating an appropriate educational environment, and reducing deficits.9
We noticed that PHEEM score was found to be similar in Saudi Arabia (a high income country) and some Low and middle income countries like Nigeria. Possibility is that the PHEEM score is not sensitive to differences in income level. The PHEEM score is a measure of the learning environment in a residency program, and it is possible that the factors that contribute to a positive learning environment are similar in both high-income countries and LMICs. For example, residents in both high-income countries and LMICs may benefit from having access to experienced mentors, adequate resources, and a supportive learning community.
The findings of this study suggest that the challenges identified in the present study are common to orthopedic residency programs around the world. Curriculum planners, stakeholders, and program directors should consider implementing the findings of this study to improve the orthopedic residency training program in Saudi Arabia.
Study Limitations
Our study was limited by its design, which was a cross-sectional quantitative study. Another limitation is the small sample size and the low proportion of female residents, which hindered the comparison between sexes. Also the questionnaire was not pilot-tested, as pilot-testing may have helped us to identify and address any problems with the questionnaire before it was used in a larger study.
Recommendations
This study is the first to evaluate the orthopedic residency training program and could serve as a base for improvement of the program and for future qualitative, quantitative, and combined studies to observe improvements to the program in the upcoming years. Curriculum planners, stakeholders, and program directors should consider implementing the findings of this study as they might help in the improvement of the orthopedic residency training program. Supervision level, teaching activities, flexibility in the work, participation in decision-making and hands-on training are important areas for investigation and enhancement. Residents’ perceptions of their programs should be taken into account regularly for the quality enhancement of the program. Clear clinical standards, workload, working hours, and quality of teaching supervision are all areas that need to be developed and improved. Many worldwide guidelines have been implemented to assure this objective is embraced, including Saudi Orthopedic Residency Program. However, the present recommendations are still vague and need to be revised, and mandatory changes should be made promptly.
Future research should use a longitudinal design studies to track changes in residents’ perceptions of the program over the time and also include a larger sample size and a more diverse population of residents to allow for more meaningful comparisons between groups along with the use of qualitative methods to explore residents’ experiences in the program in more depth.
In addition to the above points, future research could also investigate the specific reasons why residents in the western and central regions have higher PHEEM scores than residents in other regions and development of effective strategies for improving role autonomy, teaching, and social support in orthopedic residency programs.
Conclusion
The overall PHEEM score was positive but indicates that improvements are needed in some areas, which indicates that there is still an opportunity for development while also reflecting more positive than negative feedback. The sense of role autonomy reflects a more positive perception of one’s job. The instructional subscale was perceived as more positive than negative, but there is still room for improvement, while social support indicated more advantages than disadvantages.
Although the overall PHEEM score indicates that the environment is more positive than negative, some improvements and developments are still needed regarding workloads, working hours, the clarity of clinical protocols, and the quality of teaching supervision.
Data Sharing Statement
The datasets used and/or analysed during the current study are available from the corresponding author on reasonable request.
Ethical Approval and Consent to Participate
Participants were assured anonymity, and they were free to complete the survey without any restraints. Ethical approval was obtained from the King Abdullah International Medical Research Center (KAIMRC) (protocol number SP22R\020\03). Written informed consent was obtained from all participants prior to the study. The informed consent form was attached to the survey Email and participants were asked to sign the form before completing the survey. Completion of survey was considered as informed consent and this method of obtaining informed consent was approved by our Institutional Review Board/Ethics Committee.
Acknowledgments
We would like to thank all participants of the study and SCFHS for helping us distribute the survey.
Author Contributions
All authors made a significant contribution to the conception, study design, execution, acquisition, analysis and interpretations of data. All authors took part in drafting, revising or critically reviewing the article; gave final approval of the version to be published; have agreed on the journal to which the article has been submitted; and agree to be accountable for all aspects of the work.
Funding
This research received no specific grant from any funding agency in the public, commercial, or not-for-profit sectors.
Disclosure
The authors declare no conflict of interest.
References
1. Harden RM. The learning environment and the curriculum. Med Teach. 2001;23(4):335–336. doi:10.1080/01421590120063321
2. Genn JM. AMEE medical education guide No. 23 (Part 1): curriculum, environment, climate, quality and change in medical education-a unifying perspective. Med Teach. 2001;23(4):337–344. doi:10.1080/01421590120063330
3. Rotem A, Godwin P, Du J. Learning in hospital settings. Teach Learn Med. 1995;7(4):211–217. doi:10.1080/10401339509539746
4. Roff S, McAleer S. What is educational climate? Med Teach. 2001;23(4):333–334. doi:10.1080/01421590120063312
5. Al-Mohaimeed A. Perceptions of the educational environment of a new medical school, Saudi Arabia. Int J Health Sci. 2013;7(2):150–159. doi:10.12816/0006039
6. Al-Kabbaa AF, Ahmad HH, Saeed AA, Abdalla AM, Mustafa AA. Perception of the learning environment by students in a new medical school in Saudi Arabia: areas of concern. J Taibah Univ Med Sci. 2012;7(2):69–75. doi:10.1016/j.jtumed.2012.11.001
7. Khoja AT. Evaluation of the educational environment of the Saudi family medicine residency training program. J Family Community Med. 2015;22(1):49–56. doi:10.4103/2230-8229.149591
8. Sandhu A, Liaqat N, Waheed K, et al. Evaluation of educational environment for postgraduate residents using Post Graduate Hospital Educational Environment Measure. J Pak Med Assoc. 2018;68(5):790–792.
9. Ezomike UO, Udeh EI, Ugwu EO, et al. Evaluation of postgraduate educational environment in a Nigerian teaching hospital. Niger J Clin Pract. 2020;23(11):1583–1589. doi:10.4103/njcp.njcp_128_20
10. Al Helal AH, Al Turki Y. Family medicine residents’ educational environment and satisfaction of training program in Riyadh. J Fam Med Prim Care. 2019;8(4):1330–1336. doi:10.4103/jfmpc.jfmpc_63_19
11. Binsaleh S, Babaeer A, Alkhayal A, Madbouly K. Evaluation of the learning environment of urology residency training using the postgraduate hospital educational environment measure inventory. Adv Med Educ Pract. 2015;6:271–277. doi:10.2147/AMEP.S81133
12. Roff S, McAleer S, Skinner A. Development and validation of an instrument to measure the postgraduate clinical learning and teaching educational environment for hospital-based junior doctors in the UK. Med Teach. 2005;27(4):326–331. doi:10.1080/01421590500150874
13. Likert R. A technique for the measurement of attitudes. Arch Psychol. 1932;22(140):55.
14. Chan CYW, Sum MY, Lim WS, Chew NWM, Samarasekera DD, Sim K. Adoption and correlates of Postgraduate Hospital Educational Environment Measure (PHEEM) in the evaluation of learning environments—a systematic review. Med Teach. 2016;38(12):1248–1255. doi:10.1080/0142159X.2016.1210108
15. Posada Uribe MA, Vargas González V, Orrego Morales C, Cataño C, Vásquez EM, Restrepo D. Educational environment and mental wellbeing of medical and surgical postgraduate residents in Medellin, Colombia. Rev Colomb Psiquiatr. 2023;52(1):20–28. doi:10.1016/j.rcpeng.2021.02.006
16. Al-Shiekh MH, Ismail MH, Al-Khater SA. Validation of the postgraduate hospital educational environment measure at a Saudi university medical school. Saudi Med J. 2014;35(7):734–738.
 © 2024 The Author(s). This work is published and licensed by Dove Medical Press Limited. The
full terms of this license are available at https://www.dovepress.com/terms.php
and incorporate the Creative Commons Attribution
- Non Commercial (unported, 3.0) License.
By accessing the work you hereby accept the Terms. Non-commercial uses of the work are permitted
without any further permission from Dove Medical Press Limited, provided the work is properly
attributed. For permission for commercial use of this work, please see paragraphs 4.2 and 5 of our Terms.
© 2024 The Author(s). This work is published and licensed by Dove Medical Press Limited. The
full terms of this license are available at https://www.dovepress.com/terms.php
and incorporate the Creative Commons Attribution
- Non Commercial (unported, 3.0) License.
By accessing the work you hereby accept the Terms. Non-commercial uses of the work are permitted
without any further permission from Dove Medical Press Limited, provided the work is properly
attributed. For permission for commercial use of this work, please see paragraphs 4.2 and 5 of our Terms.