")
Back to Journals » Nature and Science of Sleep » Volume 17
Machine Learning Classification Based on Individual Whole-Brain Functional Connectivity in Male OSA Patients
Authors Li H , Hong J , Zhang Y, Li L, Long T, Huang L, Liu Y, Wan Z, Peng D
Received 6 November 2024
Accepted for publication 11 April 2025
Published 15 May 2025 Volume 2025:17 Pages 959—973
DOI https://doi.org/10.2147/NSS.S504512
Checked for plagiarism Yes
Review by Single anonymous peer review
Peer reviewer comments 2
Editor who approved publication: Prof. Dr. Ahmed BaHammam
Haijun Li,1 Jin Hong,2 Yudong Zhang,3 Lifeng Li,1 Ting Long,1 Ling Huang,1 Yumen Liu,1 Zhijiang Wan,2,4 Dechang Peng1
1Department of Radiology, PET Center, The First Affiliated Hospital, Jiangxi Medical College, Nanchang University, Nanchang, People’s Republic of China; 2School of Information Engineering, Nanchang University, Nanchang, Jiangxi, People’s Republic of China; 3School of Computing and Mathematic Sciences, University of Leicester, Leicester, LE1 7RH, UK; 4Industrial Institute of Artificial Intelligence, Nanchang University, Nanchang, Jiangxi, People’s Republic of China
Correspondence: Dechang Peng, The First Affiliated Hospital of Nanchang University, Donghu District, Nanchang, 330006, People’s Republic of China, Email [email protected] Zhijiang Wan, Nanchang University, No. 999 Xuefu Avenue, Honggutan New District, Nanchang, People’s Republic of China, Email [email protected]
Purpose: Previous studies have shown altered paired brain functional connectivity (FC) in obstructive sleep apnea (OSA) patients, linked to cognitive impairment. This study utilized individual FC analysis to investigate the distinctive FC characteristics in OSA and evaluate their classification efficiency.
Methods: We included 82 moderate to severe OSA patients [41 OSA with normal cognition (OSA-NC), 41 OSA with mild cognitive impairments (OSA-MCI)] and 84 healthy control (HC). Resting-state fMRI data and clinical scale data were collected. Individual FC was derived using multi-task learning-based sparse convex alternating structure optimization, with feature selection via the least absolute shrinkage and selection operator. Support vector machine classifiers were used for OSA vs HC and OSA-NC vs OSA-MCI classification. The top 10 FC features contributing to classification were analyzed for group differences. A significance level of p < 0.05 was considered statistically significant.
Results: The study results showed that individual FC achieved higher classification accuracy than traditional Pearson-based FC (OSA vs HC: 91.8% vs 79.5%; OSA-NC vs OSA-MCI: 81.3% vs 63.8%). The top 10 individual-specific FC networks contributing to classification were mainly located in the default mode network, attention network, showing significant inter-group differences in connectivity strength between the two groups.
Conclusion: This study identified static individualized FC characteristics in OSA patients with varying cognitive impairments. Based on individual FC, the classification accuracy of OSA-NC and OSA-MCI was significantly improved, the individual FC may serve as a potential neuroimaging marker for predicting OSA-MCI, providing an individual clinical diagnosis and treatment evaluation.
Keywords: obstructive sleep apnea, brain network, individual level, mild cognitive impairments, machine learning
Introduction
Sleep disorders is a major global public health issue, with obstructive sleep apnea (OSA) being one of the most common sleep disorders. The characteristics of OSA include chronic intermittent hypoxia, fragmented sleep, which may result in oxidative stress, neuroinflammation, and brain edema, leading to changes in neuroimaging markers such as brain gray matter volume, white matter integrity, brain functional activity, and network connectivity.1–3 Epidemiological studies have shown that untreated OSA can lead to cognitive impairments in learning, memory, executive function, attention, and visuospatial abilities.4 OSA is considered a potential independent risk factor for dementia, leading to severe decline in social function and quality of life.5 Therefore, early diagnosis and timely intervention are essential for improving prognosis of OSA patients. However, the significant heterogeneity in cognitive impairments among OSA patients poses challenging for early detection and timely intervention. As a result, the early personalized identification of cognitive impairments in OSA patients is critically importance for effective diagnosis and treatment.
Neuroimaging techniques can reflect neurophysiological information, with resting-state fMRI being a commonly used neuroimaging technique. In recent years, many neuroimaging studies have found changes in brain functional activity and functional network connectivity in OSA patients. Previous studies have used amplitude of low-frequency fluctuation (ALFF) and regional homogeneity (ReHo) methods, and found abnormal spontaneous activity in multiple brain regions in OSA patients, primarily located in the frontal lobe, parietal lobe, cingulate gyrus, insula, thalamus, precuneus, and cerebellum, these abnormally brain active may be potential causes of cognitive impairments.6,7 Functional connectivity (FC) is a promising resting-state fMRI metric used to assess synchronization of neural activity between anatomically distinct brain regions. Seed-based FC analysis, which requires defining regions of interest (ROI) based on previous research or other experiments, was considered sensitive and reliable.8 Despite the need for a priori assumptions, seed-based FC was widely used to measure synchronous brain activity abnormalities in OSA patients. In previous OSA studies, seed regions were mainly concentrated in the posterior cingulate gyrus, hippocampus, insular cortex, and amygdala.9–11 These studies confirmed multiple FC changes in OSA patients, aiding in the understanding of cognitive impairments. In resting-state FC studies, previous research have found FC abnormalities between subregions of the insula and several other related brain regions, primarily involving cognition, emotion, and the sensorimotor network.12 Additionally, abnormal FC between subregions of the hippocampus and the sensorimotor network and default mode network has been discovered, providing a new neuroimaging perspective on OSA-related cognitive and emotional impairments.13 However, using previously selected ROI as seed points may lead to biased results. In large-scale brain network analysis, studies have found abnormal connectivity in the default mode network, salience network, and central executive network in OSA patients.14 Independent component analysis (ICA) is a data-driven resting-state fMRI processing method that separates BOLD signals into multiple spatiotemporal components without requiring prior assumptions.15 Zhang et al employed ICA to identify seven brain networks and discovered that OSA selectively impacts resting-state FC within cognitive and sensorimotor-related brain networks, indicating its promising role as a valuable tool for monitoring neural impairments and tracking disease progression.16 Our previous studies combining ICA and dynamic FC analysis revealed altered temporal characteristics of dynamic FC in OSA with mild cognitive impairment patients, and the number of transitions was linked to cognitive status. Furthermore, OSA patients showed abnormal connectivity in high-level cognitive network, particularly in stronger connection states I involving the salience network, default mode network, and executive control network, which may provides new insights into cognitive dysfunction in OSA patients from the perspective of dynamic FC.17 However, this study ignored the impact of individual differences on brain networks. Based on the same sample size data of OSA patients, this study further explored the characteristics of individual FC networks, and conducted machine learning classification research based on individual functional networks. Graph theory analysis have shown that OSA patients have decreased clustering coefficients, local and global efficiency, and increased characteristic path length, aiding in understanding the disease from the perspective of the whole-brain functional network.18 Some researchers have used machine learning to classify OSA based on whole-brain network connectivity, finding that deep learning methods can assess brain network features related to OSA severity and daytime sleepiness, highlighting the importance of neuroimaging combined with machine learning in distinguishing OSA patients from healthy controls (HC).19 Researchers have classified based on whole-brain AAL 90 template FC in resting-state fMRI, achieving an accuracy rate of 83.33%, involving multiple internal and external resting-state functional networks.20 Previous studies used voxel-based degree centrality features combined with machine learning methods to distinguish OSA patients with and without mild cognitive impairment. They found that the support vector machine (SVM) method achieved the highest classification efficiency (AUC = 0.78), followed by random forest (AUC = 0.71) and logistic regression (AUC = 0.77). These findings demonstrate an effective machine learning approach for differentiating OSA patients with and without MCI.21 Machine learning has been applied to identify OSA patients, but these studies were conducted at the single-group level. These study results at the group level demonstrate changes in spontaneous brain activity, FC, and small-world properties, establishing brain-behavior relationships. These changes may reflect unique patterns of brain function in patients with OSA and could potentially serve as neuroimaging biomarkers for OSA. However, neurocognitive impairment in OSA patients represents a complex and multi-dimensional clinical problem. Currently, the assessment of different cognitive impairments primarily relies on subjective scales, which lack of individualized objective neuroimage markers.
It is important to note that existing neuroimaging studies on OSA have produced inconsistent results due to the high variability of brain functional networks among individuals. Current fMRI studies on brain functional imaging in OSA patients predominantly rely on group-level analysis. While these analyses reveal significant relationships between brain connectivity and clinical characteristics, they fail to account for individual differences and cannot be used as imaging biomarkers for screening and diagnosis at the individual level. Studies have shown that when utilizing individual-specific functional region screening to characterize brain features, it is more reliable in capturing brain-behavior associations.22 This individualized approach can more effectively capture the unique brain structure and function of each person, improving the understanding of brain-behavior relationships. However, if feature detection is based on traditional group-average brain templates, it may fail to accurately reflect differences between individuals. Some scholars have proposed that the Multi-Task Learning-based sparse Convex Alternating Structure Optimization (MTL-sCASO) method can resolve individual-specific FC in resting-state FC caused by individual differences.23 This approach can more accurately classify and predict individualized whole-brain FC patterns, and it has been reliably applied in Alzheimer’s disease classification. Therefore, we speculated that individual-level whole-brain FC may be a more effective biomarker for individual classification and diagnosis of OSA with different cognitive impairments.
Based on these, this study hypothesizes that individual-level whole-brain FC patterns can better distinguish between OSA and HC, as well as between OSA patients with normal cognition (OSA-NC) and MCI (OSA-MCI). To address this scientific question, we first utilized the MTL-sCASO technique to dissect individualed FC in OSA patients. We then employed machine learning methods to classify and identify HC, OSA-NC, and OSA-MCI. Next, we extracted the top 10 FC features that contributed significantly to classification and compared inter-group differences in FC strength. This study offers unprecedented individual-level neuroimaging insights into FC alterations, addressing a critical gap in prior research. The findings may potential to serve as a novel neuroimaging biomarker for OSA, thereby the way for innovative approaches in personalized diagnosis and therapeutic interventions.
Materials and Methods
Subjects
All participants were recruited from the Sleep Monitoring Room of the Respiratory or Otorhinolaryngology Department at the First Affiliated Hospital of Nanchang University between May 2015 and June 2023. The diagnostic criteria for OSA followed the guidelines established by the American Academy of Sleep Medicine.
The inclusion criteria for OSA patients were as follows: 1) male, aged 20–60 years, right-handed; 2) Diagnosed with moderate to severe OSA as determined by polysomnography (PSG), with an apnea-hypopnea index (AHI) greater than 15 events per hour; 3) First diagnosis of OSA, with no prior history of continuous positive airway pressure (CPAP) therapy or surgical intervention. For the healthy controls (HC), inclusion criteria were: 1) male, aged 20–60 years, right-handed; 2) PSG examination indicating an AHI of fewer than 5 events per hour.
Exclusion criteria for both OSA patients and HC included: 1) Presence of other sleep disorders; 2) History of diabetes, hypertension, hyperthyroidism, hypothyroidism, or other significant underlying conditions; 3) History of alcohol abuse, illicit drug use, or consumption of psychoactive medications; 4) Presence of central nervous system disorders such as epilepsy, dementia, schizophrenia, etc.; 5) Abuse of illegal substances or consumption of psychoactive agents; 6) Presence of organic lesions, including brain tumors or strokes, as identified through routine MRI scans; 7) MRI contraindications, such as the presence of a pacemaker or claustrophobia.
Polysomnography (PSG)
Prior to undergoing polysomnography (PSG) monitoring, all participants were advised against consuming alcohol or coffee. Each subject participated in overnight PSG, which took place from 10:00 PM to 6:00 AM the following morning, utilizing the Respironics LE series physiological monitoring system (Alice 5 LE, Respironics, Orlando, FL, USA). The PSG monitoring encompassed standard electroencephalography, electrocardiography, electromyography, snoring patterns, body posture, nasal and oral airflow measurements, chest and abdominal respiratory movements, and oxygen saturation (SaO2). Additionally, it recorded total sleep time, sleep latency, sleep efficiency, different sleep stages, arousal index, and respiratory events. For comprehensive details, please refer to our prior study.24
In accordance with the guidelines established by the American Academy of Sleep Medicine, hypopnea is characterized as a reduction in airflow by at least 30% lasting a minimum of 10 seconds, accompanied by a decrease in oxygen saturation of 4% or more. Sleep apnea is defined as a significant reduction in airflow of at least 90% lasting for at least 10 seconds. The apnea-hypopnea index (AHI) represents the total number of apnea and hypopnea events occurring per hour during sleep.
Neurocognitive Assessment
All participants underwent assessments using the Montreal Cognitive Assessment (MoCA) and the Epworth Sleepiness Scale (ESS). The MoCA evaluates a wide range of cognitive domains, including naming, visuospatial abilities, executive function, attention, language, delayed recall, abstraction, and orientation, serving as a measure of cognitive function. The maximum score for the MoCA is 30 points. For individuals with fewer than 12 years of education, one additional point is awarded to account for educational level. A MoCA score exceeding 26 indicates normal cognitive function, while scores between 18 and 25 suggest MCI.25 The ESS is a straightforward self-assessment questionnaire designed to evaluate daytime sleepiness. It consists of eight distinct scenarios, each rated on a scale from 0 to 3, yielding a total possible score between 0 and 24. A score greater than 6 on the ESS signifies the presence of excessive daytime sleepiness.26
MRI Data Scanning
All participants underwent imaging with a 3.0T MRI system equipped with an 8-channel phased array head coil (Siemens, Skyra, Germany). Prior to the MRI scan, subjects were instructed to close their eyes, refrain from engaging in any thoughts, and avoid falling asleep. Foam pads and earplugs were utilized to minimize head movement and reduce scanner noise during the imaging process. Throughout the scanning procedure, snoring was monitored, and participants were interviewed about any occurrences of sleep afterward.
Initially, conventional axial T2-weighted images were acquired with the following parameters: TR = 4000 ms, TE = 113 ms, slice thickness = 5 mm, inter-slice gap = 1.5 mm, field of view (FOV) = 220×220 mm, matrix = 64, and number of slices = 19. Subsequently, three-dimensional high-resolution T1-weighted images were obtained using a different set of parameters: TR = 250 ms, TE = 2.46 ms, slice thickness = 5 mm, inter-slice gap = 1.5 mm, FOV = 220×220 mm, matrix = 64, and number of slices = 19. Finally, blood oxygen level-dependent (BOLD) fMRI data were collected using echo planar imaging sequences, with parameters set to TR = 2000 ms, TE = 30 ms, slice thickness = 4 mm, inter-slice gap = 1.2 mm, FOV = 230×230 mm, matrix = 64, and a total of 240 volumes. The acquired images were reviewed by two senior radiologists to exclude the presence of any macroscopic lesions or motion artifacts.
fMRI Data Preprocessing
The preprocessing of fMRI data was performed utilizing Statistical Parametric Mapping (SPM 12, https://www.fil.ion.ucl.ac.uk/spm/software/spm12/) and Data Processing & Analysis for Brain Imaging (DPABI, http://rfmri.org/DPABI) software, both of which were running on MATLAB 2018b (Mathworks, Natick, MA, USA). The preprocessing workflow comprised several key steps: 1) Conversion of imaging data from DICOM format to NII format; 2) Exclusion of the first 10 time points to facilitate participant adaptation to the scanning environment; 3) Application of slice timing correction and head motion correction, with the exclusion of subjects exhibiting maximum head motion displacement (x, y, z) exceeding 2.0 mm and maximum angular rotation (x, y, z) greater than 2.0 degrees; 4) Anatomical registration of the three-dimensional T1-weighted images was conducted using the Diffeomorphic Anatomical Registration Through Exponentiated Lie Algebra (DARTEL) method, which involved segmentation into gray matter, white matter, and cerebrospinal fluid; 5) Normalization of fMRI images to Montreal Neurological Institute (MNI) space was achieved using DARTEL, with resampling to voxel dimensions of 3 mm × 3 mm × 3 mm; 6) Spatial smoothing of the images was performed using a 6 mm full width at half maximum (FWHM) Gaussian kernel, accompanied by removal of noise from the blood oxygen level-dependent (BOLD) signal through band-pass filtering in the frequency range of 0.01 to 0.08 hz. Ultimately, eight OSA patients were excluded based on head motion criteria, leading to the final analysis of 82 male OSA patients and 84 male HC.
Functional Connectivity Construction
Based on the Dosenbach 160 atlas, the brain was divided into 160 ROIs. This atlas has been shown to ensure the functional significance of brain region nodes and reduce interference from signals of other functional brain regions. The coordinates of the center of each ROI were extracted as the center of a sphere with a radius of 5 mm, and the average time series of all voxels within this sphere were considered as the time series of that brain region. Using resting-state fMRI data, the Pearson correlation was calculated between the time series of every pair of brain regions to construct a whole-brain connectivity matrix, resulting in a whole-brain FC mapping.
In this study, the MTL-sCASO model was employed to estimate FC between brain regions within a regularized learning framework. Furthermore, these FC are decomposed into components that are shared among individuals and components that are specific to individuals. The model comprises three aspects: partial correlation estimation, convex alternating structure optimization, and sparse regularization. The formula for this model is as follows:
here,  represents the representative time-series with t time points of the p th ROI for the n th subject;
  is the set of all representative time series except for the p-th ROI, and
  is the weight vector representing the partial correlation between the p-th ROI and the other ROIs of the n-th subject.
  denotes the individual-specific connection for the p-th ROI of the n-th subject. The regularization parameter ρ1 controls the brain network correlation; ρ2 represents the L2-norm regularization of the model, controlling the complexity of the model to prevent overfitting; ρ3 is a regularization parameter used to control the sparsity of functional brain networks. Detailed computational methods can be found in previous literature, which also validated the stability of individual-specific connections and shared connections.23
After obtaining the whole-brain FC map calculated by traditional Pearson correlation method and the individual-specific FC by MCL-SCASO, this study converted the Pearson-related FC and individual-specific FC of each subject by Fisher z value to obtain a whole-brain FC map satisfying the normal distribution.
Feature Extraction and Machine Learning Classification
After preprocessing, the data from the 160 ROIs used in this study resulted in 25,600 FC features, which may not be ideal for training classifiers. In order to identify features that contribute significantly to the classification structure, LASSO was used for feature dimensionality reduction and selection. This method automatically selects features that impact the target variable, shrinks the coefficients of irrelevant or redundant features to zero, achieving feature selection. The L1 regularization term encourages sparsity in model parameters, reducing the number of features and achieving feature dimensionality reduction. It can also improve model efficiency and generalization ability, reduce over-fitting, and is a commonly used feature selection method.
Following LASSO feature dimensionality reduction and selection, this study employs linear SVM as the classification algorithm. The SVM is a supervised learning method that allows for extracting feature weights and demonstrating resilience to over-fitting. The SVM classifier was used for binary classification tasks such as HC vs OSA, and OSA-MCI vs OSA-NC. The classifier’s accuracy was measured using metrics such as accuracy, sensitivity, specificity, F1 score, and the Area Under the ROC Curve (AUC). Ten-fold cross-validation was adopted in this study, where the 166 subjects were divided into ten equal parts. Nine of these parts were randomly selected as the training set for model training, while the remaining part serves as the validation set. This process was repeated ten times to complete one full ten-fold cross-validation.
Functional Connectivity Feature Display
In SVM classifiers, each FC strength was assigned a weight that reflects its contribution to the classification, with higher weights indicating greater importance. The top 10 FCs contributing most significantly to the classification of each group were identified and visualized using BrainNet Viewer software. To compare the strength of these top 10 FCs between groups, a two-sample t-test was performed, with age, BMI, and education level included as covariates. Statistical significance was set at p < 0.05, and the false discovery rate correction was applied to adjust for multiple comparisons.
Statistical Analysis
To assess whether the machine learning classification models derived from two distinct computational methods exhibit statistically significant differences, the Wilcoxon rank-sum test was employed to evaluate their statistical power. Performance metrics-including accuracy, sensitivity, specificity, F1 score, and area under the ROC curve (AUC)-are obtained for each model. Subsequently, the differences in performance metrics between the two models are calculated, and the rank sums of these differences are computed, randomized over 1000 iterations. Based on the calculated rank sum statistic and the predetermined significance level, we determine whether there is a statistically significant difference in the performance of the two classification models.
Validation Analysis
There are certain functional differences in different brain regions segmented by different brain templates. In order to avoid differences in classification effectiveness due to brain template selection, this study also utilized the Power 264 brain region template to recompute individual-specific FC networks. Similar feature selection and classification methods were employed for the repeated experiments. The overall workflow was shown in Figure 1.
 |
Figure 1 Individual functional connectivity analysis overall workflow. (1) Study participant; (2) fMRI data collection; (3) fMRI data preprocessing; (4) According to the brain atlas template, MTL-sCASO method was used to estimate the time series of different brain regions of individuals; (5) Construct individual functional connectivity matrix; (6) Machine learning LASSO feature screening for dimensionality reduction; (7) SVM for classification; (8) Extraction and display of the top 10 brain connection features that contributed to the classification. |
Results
Demographic and Clinical Data Analysis results
The results of inter-group clinical data analysis were shown in Table 1. The one-way analysis of variance showed that age, years of education and FD were not significantly different among the three groups, while BMI, AHI, minimum SaO2, average SaO2, AI, ESS and MoCA were significantly different among the three groups. Detailed results of the post-hoc t-test were shown in Table 1.
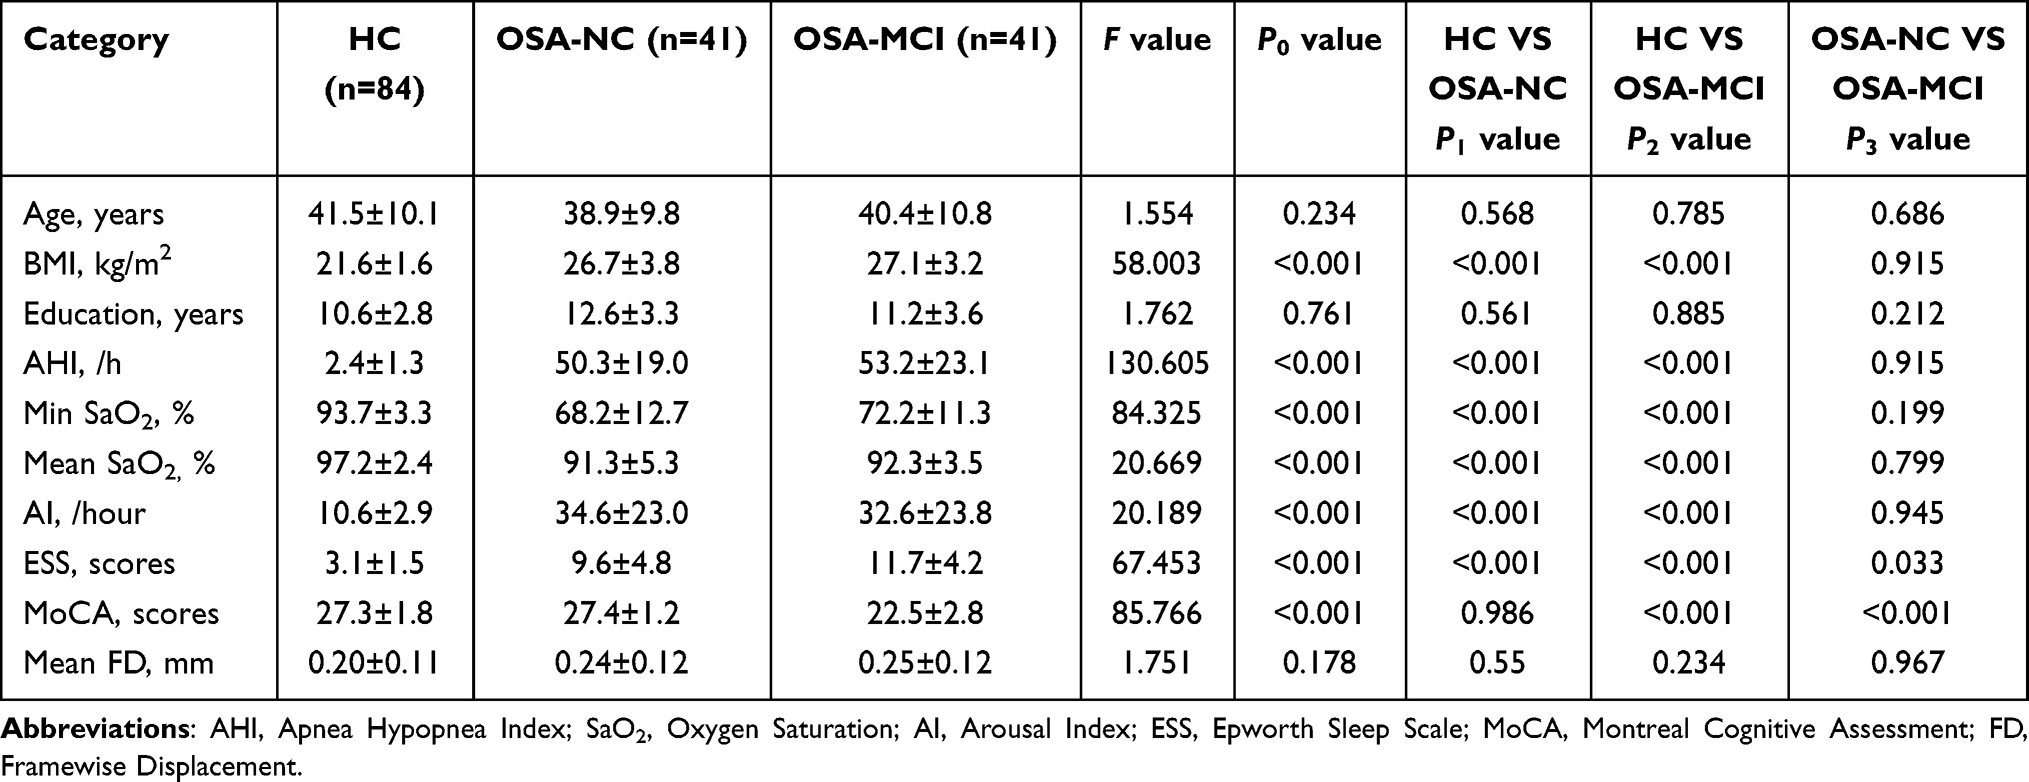 |
Table 1 Demographic and Clinical Data of OSA and HC Group |
Functional Connection Network Display at Individual Level
According to the calculation of Pearson-related FC and MTL-sCASO individualized FC, we performed individual level display of the correlation connection graph, and found that there were similar connections and different FC patterns between individual FC and Pearson-related FC, which was shown in Figure 2.
 |
Figure 2 Pearson-related functional connectivity matrix (A) and individual-specific functional connectivity matrix (B) constructed from the 160 ROI brain region template of one subject, with similar and different functional connectivity patterns. |
Classification Performance Comparison
Under the Dosenbach 160 ROIs brain region, the classification performance of OSA and HC was shown in Table 2. The accuracy of individual specific FC was higher than that of traditional Pearson-related FC, and there was a statistical difference between the two groups. The ROC curve was shown in Figure 3.
 |
Table 2 Distinguish the Performance of OSA and HC Classification based on 160 ROIs |
 |
Figure 3 Classification ROC curves for OSA and HC based on Pearson-related functional connectivity (A) and individual specific functional connectivity (B). |
Under the Dosenbach 160 brain region template, the classification performance of OSA-MCI and OSA-NC was compared, and it was found that the classification efficiency of individual specific FC was higher than that of Pearson-related FC (Table 3), and the ROC curve was shown in Figure 4.
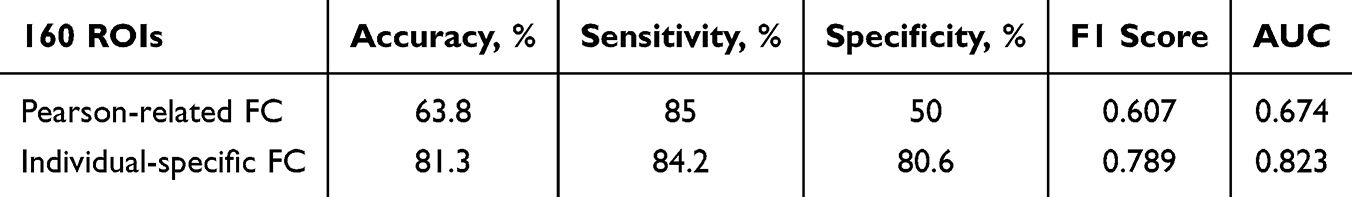 |
Table 3 Distinguish the Performance of OSA-NC and OSA-MCI Classification based on 160 ROIs |
 |
Figure 4 Classification ROC curves for OSA-NC and OSA-MCI based on Pearson-related functional connectivity (A) and individual specific functional connectivity (B). |
Individual Functional Connection Classification Marker Display
When individual-specific FC were used as features, the top 10 brain connections that contributed the most to OSA-HC classification were extracted in the OSA-HC binary classification task and displayed using BrainNet Viewer software. The results were shown in Figure 5. The FC include left posterior cingulate gyrus and right anterior supplementary motor cortex, right anterior cingulate gyrus and right ventral medial prefrontal cortex, left inferior parietal cortex and right anterior prefrontal lobe, left inferior parietal lobule and right temporal lobe, left middle insula and sensorimotor area, left inferior cerebellum and left temporoparietal lobe, left inferior parietal lobule and right parietal lobe, right occipital lobe and left occipital lobe, and right superior temporal gyrus and left temporoparietal lobe. These 10 FC were compared between two groups, and statistical differences were found among two groups, except that there was no difference in the strength of the connections between left posterior cingulate gyrus and right anterior supplementary motor cortex, left inferior cerebellum and left temporoparietal association, right superior temporal gyrus and left temporoparietal, and right occipital lobe and left occipital lobe association (p < 0.05) (Figure 6).
 |
Figure 5 Individual specific connections for the classification of the top 10 functional connectivity of OSA and HC groups. Abbreviations: vmPFC, ventromedial prefrontal cortex; aPFC, anterior prefrontal cortex; vPFC, ventral prefrontal cortex; ACC, anterior cingulate cortex; preSMA, pre-supplementary motor cortex; SMA, sensorimotor area; midIN, middle insula; IPL, inferior parietal lobule; TPJ, temporo-parietal junction; OCC, occipital; PCC, post cingulate; supT, sup temporal; infCe, inferior cerebellum. |
 |
Figure 6 The top 10 individual-specific functional connectivity bar chart of differences between HC and OSA groups. |
When individual-specific FC were used as features, the top 10 brain connectivity that contributed the most to OSA-MCI and OSA-NC classification tasks were extracted and displayed using BrainNet Viewer software. The results were shown in Figure 7. It mainly showed FC between right superior temporal gyrus and left temporal lobe, right inferior cerebellum and right ventral frontal cortex, right occipital lobe and left inferior parietal lobule, right superior temporal gyrus and left basal ganglia, left occipital lobe and left temporal lobe, left posterior cerebellum and left temporal lobe, left temporal lobe and sensorimotor cortex, right middle cerebellum and medial frontal lobe, left angular gyrus and left temporal lobe, left temporoparietal union and left temporal lobe. At the same time, the differences between the 10 FC were compared, and those were statistical differences between the OSA-NC and OSA-MCI patients groups (Figure 8).
 |
Figure 7 Individual specific functional connectivity for the classification of the top 10 functional connectivity of OSA-HC and OSA-MCI. Abbreviations: mFC, medial frontal cortex; BG, basal ganglia; SMA, sensorimotor area; vFC, ventral frontal cortex; IPL, inferior parietal lobule; supT, sup temporal; AG, angular gyrus; OCC, occipital; medCe, med cerebellum; latCe, lat cerebellum; TPJ, temporo-parietal junction. |
 |
Figure 8 The top 10 individual specific functional connectivity bar chart of differences between OSA-NC and OSA-MCI groups. |
Validation Analysis Results
Under the Power 264 brain region template, this study compared the classification performance of OSA and HC, OSA-NC and OSA-MCI, found that the classification efficiency of individual-specific FC was higher than that of Pearson-related FC, with statistical differences. Specific indicators were shown in Tables 4 and 5.
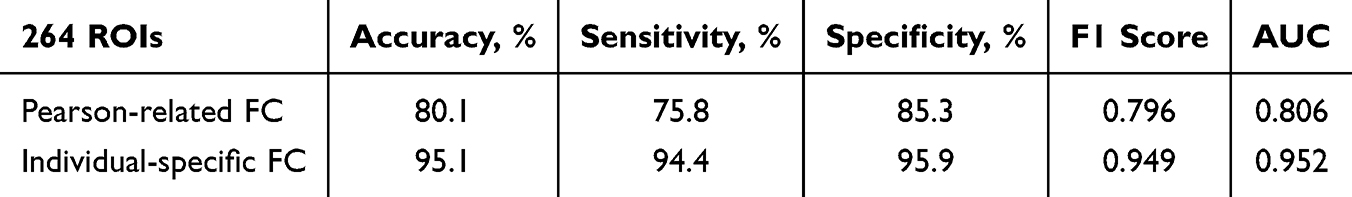 |
Table 4 Distinguish the Performance of OSA and HC Classification based on 264 ROIs |
 |
Table 5 Distinguish the Performance of OSA-NC and OSA-MCI Classification based on 264 ROIs |
Discussion
This study, for the first time, utilized the MTL-sCASO method to analyze individual-specific functional brain network connectivity patterns in patients with OSA. Based on individual-specific FC, OSA can be distinguished from the HC population effectively. Furthermore, OSA-MCI can be distinguished from OSA-NC, with classification performance superior to traditional Pearson-related FC features. Although this study lacks external validation, it has been validated across different brain templates, indicating that individual-specific FC containing individual differences provide better classification performance for OSA patients. Additionally, this study extracted and visualized the top 10 brain region connections that contribute significantly to the classification of individual-specific connections. When distinguishing OSA from HC, the individual-specific FC strengths were predominantly observed in the DMN. In contrast, when distinguishing OSA-MCI from OSA-NC, they were mainly located in the attention network. This observation suggests that individual-specific FC may be more sensitive to the cognitive status of OSA patients, and these differing brain regions could potentially serve as neuroimaging biomarkers for OSA and OSA-MCI. Individual-specific FC might also hold potential as neuroimaging biomarkers for identifying OSA patients with MCI.
Differences in Individual-Specific FC Between OSA Patients and HC Group
Individual differences have been a hot topic in recent years in brain neuroscience research. The interactions between different brain regions in the human brain form the basis of cognitive behavior, and significant differences exist among individuals, which may be the reason for behavioral and cognitive differences in people. This study found that when distinguishing between OSA and HC groups, the classification performance of individual-specific FC was significantly superior to traditional Pearson-related FC, showing better accuracy, sensitivity, F1 score, and AUC of the ROC curve. Previous studies have shown that the accuracy of identification based on brain activation patterns is determined by intra-individual variability and inter-individual variability, with higher identification accuracy linked to reduced intra-individual variability and increased inter-individual variability.27 Other research has found that inter-individual differences in brain structure are related to inter-individual differences in behavioral phenotypes to some extent, similar to the differences in brain FC.28 In previous studies, classification of OSA and HC based on resting-state FC using the group-level ALL 90 brain region template only achieved an accuracy of 83.3%.20 Recently, researchers utilized DTI data combined with SVM and random forest models to classify OSA patients. The random forest model achieved a classification accuracy of 0.73 and an AUC value of 0.85, demonstrating comparable precision to the SVM model (accuracy of 0.77, AUC of 0.84), which findings suggest that both models, leveraging brain DTI data, can function as efficient screening tools for OSA.29 In this study, the classification accuracy based on Pearson-related FC was 79.5%, consistent with findings from other studies. However, the accuracy achieved using individual-specific FC reached 91.0%, significantly surpassing that of traditional Pearson-related FC. This highlights that individual-specific FC offers a novel neuroimaging approach for the diagnosis and treatment of OSA patients at the individual level.
This study found that among the top 10 connected features in classification based on individual-specific FC were mainly located in the DMN, which includes core brain regions such as the posterior cingulate gyrus, medial prefrontal cortex, inferior parietal lobule, and precuneus, primarily involved in internal mental activities and introspection. Previous studies have documented abnormalities in spontaneous brain activity and network connectivity within the DMN of OSA patients.30 Research has demonstrated that OSA patients exhibit abnormalities in the connectivity of the cerebellum-cerebral network, primarily involving disruptions in abnormalities connections between the prefrontal cortex networks of the DMN and control networks, additionally, changes in FC within DMN regions are associated with decreased verbal fluency in OSA patients.31 Previous studies have also reported significant reductions in FC within and between the anterior and posterior DMN in OSA patients, alongside increased FC within the anterior DMN.32 Additionally, OSA patients exhibited decreased local efficiency and clustering coefficient, with altered nodal degrees in key DMN regions, these findings highlight the DMN as a vulnerable network in OSA patients.32 This study identified the DMN as the primary differential connectivity network distinguishing OSA from HC during the classification process. Furthermore, individual-level analysis confirmed that abnormal connectivity within the DMN may represent a vulnerable network in OSA patients, suggesting its potential as a neuroimaging biomarker for OSA. These findings are consistent with previous studies, reinforcing the critical role of the DMN in OSA-related neural alterations.
Differences in Individual-Specific FC Between OSA-MCI and OSA-NC Groups
Mild cognitive impairment (MCI) is a common complication in OSA patients, but it is often overlooked in the early stages of the disease, leading to delays in timely intervention measures. This study found that using individual-specific FC increased the classification accuracy of OSA-MCI from OSA with normal cognitive individuals from 68.3% to 81.3%, which can more effectively identify the MCI population and provide early screening for cognitive impairments in OSA patients.
Compared to OSA-NC, the individual FC abnormalities in OSA-MCI are mainly located in the temporo-parietal junction and ventral frontal cortex, inferior parietal lobule, cerebellum, basal ganglia, and left temporal lobe. The temporo-parietal junction and ventral frontal cortex are core brain regions of the ventral attention network, which acts as a “breaker” interrupting ongoing cognitive activities and responding to salient or distracting events.33 During cognitive tasks requiring attention, the activity of certain brain regions continues to increase. These brain regions are known as task-positive networks, and the ventral or dorsal attention systems that are active during directed attention are part of this system.34 Previous studies have demonstrated that the FC of specific networks, including the ventral attention network, is significantly reduced in OSA patients.35 Recent studies have revealed that patients with moderate to severe OSA exhibit reduced network switching rates, particularly within the DMN and ventral attention network. These disruptions in dynamic functional networks may represent a key underlying mechanism contributing to cognitive impairment in moderate to severe OSA patients.36 The left temporal lobe is mainly associated with functions such as hearing, language, and memory, and the temporal pole was associated with facial knowledge, facial perception, and memory. Previous studies have shown cortical atrophy in the temporal lobe of OSA patients, which may be a neurobiological marker of brain damage in OSA patients.37 The inferior parietal lobule was primarily associated with visual spatial perception, attention, planning and executing movements, as well as various sensory and cognitive functions.38 Previous studies have reported that OSA patients exhibit reduced cortical thickness in the bilateral inferior parietal lobule, temporal lobe, and basal ganglia regions. Additionally, a significant correlation was observed between declining sleep quality and cortical thinning in the basal and lateral temporal lobe, as well as the inferior parietal lobe.39 The cerebellum was previously thought to be primarily involved in motor coordination functions, but recent studies have shown that the cerebellum is involved in multiple cognitive domains including sensory-motor processing, emotion regulation, learning, and attention through extensive brain-cerebellar fiber connections.40 Previous fMRI studies have demonstrated heightened cerebellar activity during slow-wave sleep, synchronized with slow oscillations. In contrast, sleep deprivation leads to reduced resting-state functional connectivity (FC) between the cerebellum and various cortical regions, suggesting the cerebellum’s role in regulating the sleep-wake cycle and facilitating rapid eye movement sleep.41 This study observed abnormal FC between the cerebellum and the frontal and temporal lobes in OSA-MCI patients. These connectivity patterns may represent potential neuroimaging markers for OSA with MCI, offering insights that could support early clinical identification.
Limitations
This study still has some limitations. First, this study is a cross-sectional observational study. In future studies, longitudinal follow-up observations of changes in individualized functional connectivity in patients with OSA before and after CPAP treatment can be conducted. This would provide reliable imaging evidence for personalized treatment monitoring. Second, although this study effectively differentiated OSA-MCI patients from the OSA population at the individual-specific FC level, there are still challenges in using regression-based machine learning methods to reveal individual differences in disease severity or cognitive function, ie, predicting individual cognitive behaviors, the future should predict the outcome at the individual level is a good direction. Third, this study only included male OSA patients with aged 20–60 years, which may affect the generalizability of our findings, particularly considering the differences in OSA incidence and complications between males and females. Therefore, future research should expand the sample size to include female and elderly OSA patients, further enhancing the applicability of the results. Finally, due to technical reasons, this study used estimated individual brain region time series for individual-specific FC and constructed individual brain graph FC matrices, which are still challenging for brain region segmentation at the individual level. Individual differences in genetic background may also affect the characterization of individual differences in patients.42 Future research can implement individual-level whole-genome analysis and joint analysis of functional MRI data to reveal the potential genetic basis of the disease.
Conclusion
This study employed individual-specific FC methods to investigate whole-brain functional connectivity patterns in OSA patients. By integrating machine learning models, it significantly enhanced the classification accuracy between OSA and HC, as well as between OSA-MCI and OSA-NC. The findings revealed that individual-specific FC holds substantial potential as neuroimaging biomarkers for the classification and diagnosis of OSA. This approach not only aids in the early screening of OSA patients with MCI symptoms but also supports personalized clinical diagnosis and treatment evaluation, offering valuable neuroimaging markers for tailored diagnostic and therapeutic strategies.
Data Sharing Statement
The original contributions presented in the study are included in the article. Further inquiries can be directed to the corresponding author.
Ethics Statement
We obey the principles of the Declaration of Helsinki. The study was approved by the Medical Ethics Committee of the First Affiliated Hospital of Nanchang University. The participants signed written informed consent forms, in accordance with the Declaration of Helsinki.
Author Contributions
All authors made significant contributions to this work, from study conception and design to data acquisition, analysis, and interpretation. Each participated in drafting and revising the manuscript, approved the final version for publication, and agreed on the submission to this journal. All authors take full responsibility for the content of this article. The individual contributions of the authors, based on the CRediT taxonomy, are as follows: Haijun Li: Conceptualization, Methodology, Funding Acquisition, Writing, Original Draft Preparation, Review. Jin Hong: Methodology, Investigation, Writing, Review & Editing, Supervision. Yudong Zhang: Data Collection, Formal Analysis, Visualization, Writing, Review & Editing. Lifeng Li: Software, Validation, Writing, Review & Editing. Ting Long: Data Curation, Resources, Investigation, Writing, Review & Editing. Ling Huang: Data Curation, Investigation, Writing, Review & Editing. Yumen Liu: Data Collection, Supervision, Writing, Review & Editing. Zhijiang Wan: Formal Analysis, Visualization, Project Administration, Writing, Review & Editing, Supervision. Dechang Peng: Conceptualization, Supervision, Resources, Funding Acquisition, Writing, Review & Editing.
Funding
This study was supported by the National Natural Science Foundation of China (Grant No. 81860307), the Key Research and Development Projects of Jiangxi Province, China (Grant No. 20243BBI91031), the Natural Science Foundation of Jiangxi, People’s Republic of China (Grant Nos. 20232BAB212029, 20202BABL216038), Science and technology project of Jiangxi Provincial Administration of Traditional Chinese Medicine (Grant No. 2023A0278), and the Clinical Research Center For Medical Imaging in Jiangxi Province (Grant No. 20223BCG74001).
Disclosure
The authors declare no potential conflicts of interest in this work. The authors declare that the study was conducted in the absence of any commercial or financial relationships that could be construed as a potential conflict of interest.
References
1. Andre C, Rehel S, Kuhn E, et al. Association of sleep-disordered breathing with Alzheimer disease biomarkers in community-dwelling older adults: a secondary analysis of a randomized clinical trial. JAMA Neurol. 2020;77(6):716–724. doi:10.1001/jamaneurol.2020.0311
2. Baril AA, Gagnon K, Brayet P, et al. Gray matter hypertrophy and thickening with obstructive sleep apnea in middle-aged and older adults. Am J Respir Crit Care Med. 2017;195(11):1509–1518. doi:10.1164/rccm.201606-1271OC
3. Bubu OM, Pirraglia E, Andrade AG, et al. Obstructive sleep apnea and longitudinal Alzheimer’s disease biomarker changes. Sleep. 2019;42(6):z48. doi:10.1093/sleep/zsz048
4. Bubu OM, Andrade AG, Umasabor-Bubu OQ, et al. Obstructive sleep apnea, cognition and Alzheimer’s disease: a systematic review integrating three decades of multidisciplinary research. Sleep Med Rev. 2020;50:101250. doi:10.1016/j.smrv.2019.101250
5. Aini N, Chu H, Banda KJ, et al. Prevalence of sleep-related breathing disorders and associated risk factors among people with dementia: a meta-analysis. Sleep Med. 2023;103:51–61. doi:10.1016/j.sleep.2023.01.020
6. Li HJ, Dai XJ, Gong HH, et al. Aberrant spontaneous low-frequency brain activity in male patients with severe obstructive sleep apnea revealed by resting-state functional MRI. Neuropsychiatr Dis Treat. 2015;11:207–214. doi:10.2147/NDT.S73730
7. Peng DC, Dai XJ, Gong HH, et al. Altered intrinsic regional brain activity in male patients with severe obstructive sleep apnea: a resting-state functional magnetic resonance imaging study. Neuropsychiatr Dis Treat. 2014;10:1819–1826. doi:10.2147/NDT.S67805
8. Hampson M, Peterson BS, Skudlarski P, et al. Detection of functional connectivity using temporal correlations in MR images. Hum Brain Mapp. 2002;15(4):247–262. doi:10.1002/hbm.10022
9. Zhang Q, Qin W, He X, et al. Functional disconnection of the right anterior insula in obstructive sleep apnea. Sleep Med. 2015;16(9):1062–1070. doi:10.1016/j.sleep.2015.04.018
10. Song X, Roy B, Kang DW, et al. Altered resting-state hippocampal and caudate functional networks in patients with obstructive sleep apnea. Brain Behav. 2018;8(6):e994. doi:10.1002/brb3.994
11. Park B, Palomares JA, Woo MA, et al. Aberrant insular functional network integrity in patients with obstructive sleep apnea. Sleep. 2016;39(5):989–1000. doi:10.5665/sleep.5738
12. Kong L, Li H, Shu Y, et al. Aberrant Resting-State Functional Brain Connectivity of Insular Subregions in Obstructive Sleep Apnea. Front Neurosci. 2021;15:765775. doi:10.3389/fnins.2021.765775
13. Liu X, Chen L, Duan W, et al. Abnormal functional connectivity of hippocampal subdivisions in obstructive sleep apnea: a resting-state functional magnetic resonance imaging study. Front Neurosci. 2022;16:850940. doi:10.3389/fnins.2022.850940
14. Khazaie H, Veronese M, Noori K, et al. Functional reorganization in obstructive sleep apnoea and insomnia: a systematic review of the resting-state fMRI. Neurosci Biobehav Rev. 2017;77:219–231. doi:10.1016/j.neubiorev.2017.03.013
15. Hu G, Zhang Q, Waters AB, et al. Tensor clustering on outer-product of coefficient and component matrices of independent component analysis for reliable functional magnetic resonance imaging data decomposition. J Neurosci Methods. 2019;325:108359. doi:10.1016/j.jneumeth.2019.108359
16. Zhang Q, Wang D, Qin W, et al. Altered resting-state brain activity in obstructive sleep apnea. Sleep. 2013;36(5):651–659. doi:10.5665/sleep.2620
17. Li H, Li L, Li K, et al. Abnormal dynamic functional network connectivity in male obstructive sleep apnea with mild cognitive impairment: a data-driven functional magnetic resonance imaging study. Front Aging Neurosci. 2022;14:977917. doi:10.3389/fnagi.2022.977917
18. Huang Y, Liu Y, Zhao D, et al. Small-world properties of the whole-brain functional networks in patients with obstructive sleep apnea-hypopnea syndrome. Sleep Med. 2019;62:53–58. doi:10.1016/j.sleep.2018.08.037
19. Lee MH, Lee SK, Thomas RJ, et al. Deep learning-based assessment of brain connectivity related to obstructive sleep apnea and daytime sleepiness. Nat Sci Sleep. 2021;13:1561–1572. doi:10.2147/NSS.S327110
20. Hou A, Pang X, Zhang X, et al. Widespread aberrant functional connectivity throughout the whole brain in obstructive sleep apnea. Front Neurosci. 2022;16:920765. doi:10.3389/fnins.2022.920765
21. Liu X, Shu Y, Yu P, et al. Classification of severe obstructive sleep apnea with cognitive impairment using degree centrality: a machine learning analysis. Front Neurol. 2022;13:1005650. doi:10.3389/fneur.2022.1005650
22. Li M, Wang D, Ren J, et al. Performing group-level functional image analyses based on homologous functional regions mapped in individuals. PLoS Biol. 2019;17(3):e2007032. doi:10.1371/journal.pbio.2007032
23. Wang X, Li Q, Zhao Y, et al. Decomposition of individual-specific and individual-shared components from resting-state functional connectivity using a multi-task machine learning method. Neuroimage. 2021;238:118252. doi:10.1016/j.neuroimage.2021.118252
24. Li H, Li L, Kong L, et al. Frequency-specific regional homogeneity alterations and cognitive function in obstructive sleep apnea before and after short-term continuous positive airway pressure treatment. Nat Sci Sleep. 2021;13:2221–2238. doi:10.2147/NSS.S344842
25. Carson N, Leach L, Murphy KJ. A re-examination of Montreal Cognitive Assessment (MoCA) cutoff scores. Int J Geriatr Psychiatry. 2018;33(2):379–388. doi:10.1002/gps.4756
26. Johns MW. A new method for measuring daytime sleepiness: the Epworth sleepiness scale. Sleep. 1991;14(6):540–545. doi:10.1093/sleep/14.6.540
27. Li L, Wei Y, Zhang J, et al. Gene expression associated with individual variability in intrinsic functional connectivity. Neuroimage. 2021;245:118743. doi:10.1016/j.neuroimage.2021.118743
28. Genon S, Eickhoff SB, Kharabian S. Linking interindividual variability in brain structure to behaviour. Nat Rev Neurosci. 2022;23(5):307–318. doi:10.1038/s41583-022-00584-7
29. Pang B, Doshi S, Roy B, et al. Machine learning approach for obstructive sleep apnea screening using brain diffusion tensor imaging. J Sleep Res. 2023;32(1):e13729. doi:10.1111/jsr.13729
30. Chang YT, Chen YC, Chen YL, et al. Functional connectivity in default mode network correlates with severity of hypoxemia in obstructive sleep apnea. Brain Behav. 2020;10(12):e1889. doi:10.1002/brb3.1889
31. Park HR, Cha J, Joo EY, et al. Altered cerebrocerebellar functional connectivity in patients with obstructive sleep apnea and its association with cognitive function. Sleep. 2022;45(1). doi:10.1093/sleep/zsab209
32. Chen L, Fan X, Li H, et al. Topological reorganization of the default mode network in severe male obstructive sleep apnea. Front Neurol. 2018;9:363. doi:10.3389/fneur.2018.00363
33. Suo X, Ding H, Li X, et al. Anatomical and functional coupling between the dorsal and ventral attention networks. Neuroimage. 2021;232:117868. doi:10.1016/j.neuroimage.2021.117868
34. Zhao P, Yu RS, Liu Y, et al. The functional hierarchy of the task-positive networks indicates a core control system of top-down regulation in visual attention. J Integr Neurosci. 2021;20(1):43–53. doi:10.31083/j.jin.2021.01.297
35. He Y, Shen J, Wang X, Wu Q, Liu J, Ji Y. Preliminary study on brain resting-state networks and cognitive impairments of patients with obstructive sleep apnea-hypopnea syndrome. BMC Neurol. 2022;22(1):456. doi:10.1186/s12883-022-02991-w
36. Huang Y, Shen C, Zhao W, et al. Multilayer network analysis of dynamic network reconfiguration in patients with moderate-to-severe obstructive sleep apnea and its association with neurocognitive function. Sleep Med. 2023;112:333–341. doi:10.1016/j.sleep.2023.10.035
37. Gao J, Cao J, Chen J, et al. Brain morphology and functional connectivity alterations in patients with severe obstructive sleep apnea. Sleep Med. 2023;111:62–69. doi:10.1016/j.sleep.2023.08.032
38. Numssen O, Bzdok D, Hartwigsen G. Functional specialization within the inferior parietal lobes across cognitive domains. Elife. 2021;10. doi:10.7554/eLife.63591
39. Joo EY, Jeon S, Kim ST, et al. Localized cortical thinning in patients with obstructive sleep apnea syndrome. Sleep. 2013;36(8):1153–1162. doi:10.5665/sleep.2876
40. Jacobi H, Faber J, Timmann D, et al. Update cerebellum and cognition. J Neurol. 2021;268(10):3921–3925. doi:10.1007/s00415-021-10486-w
41. Zhang Y, Yang Y, Yang Y, et al. Alterations in cerebellar functional connectivity are correlated with decreased psychomotor vigilance following total sleep deprivation. Front Neurosci. 2019;13:134. doi:10.3389/fnins.2019.00134
42. Gu Z, Jamison KW, Sabuncu MR, et al. Heritability and interindividual variability of regional structure-function coupling. Nat Commun. 2021;12(1):4894. doi:10.1038/s41467-021-25184-4
 © 2025 The Author(s). This work is published and licensed by Dove Medical Press Limited. The
full terms of this license are available at https://www.dovepress.com/terms.php
and incorporate the Creative Commons Attribution
- Non Commercial (unported, 4.0) License.
By accessing the work you hereby accept the Terms. Non-commercial uses of the work are permitted
without any further permission from Dove Medical Press Limited, provided the work is properly
attributed. For permission for commercial use of this work, please see paragraphs 4.2 and 5 of our Terms.
© 2025 The Author(s). This work is published and licensed by Dove Medical Press Limited. The
full terms of this license are available at https://www.dovepress.com/terms.php
and incorporate the Creative Commons Attribution
- Non Commercial (unported, 4.0) License.
By accessing the work you hereby accept the Terms. Non-commercial uses of the work are permitted
without any further permission from Dove Medical Press Limited, provided the work is properly
attributed. For permission for commercial use of this work, please see paragraphs 4.2 and 5 of our Terms.