")
Back to Journals » Drug Design, Development and Therapy » Volume 19
Prediction of High-Dose Methotrexate Blood Concentration in Osteosarcoma Patients Using Machine Learning
Authors Zhao J , Dai S, He J, Liu N, Zhang B, Li S
Received 3 January 2025
Accepted for publication 14 April 2025
Published 3 May 2025 Volume 2025:19 Pages 3631—3643
DOI https://doi.org/10.2147/DDDT.S515535
Checked for plagiarism Yes
Review by Single anonymous peer review
Peer reviewer comments 2
Editor who approved publication: Professor Tamer Ibrahim
Jin Zhao,1 Shuqi Dai,2 Jiali He,1 Na Liu,1 Baowanze Zhang,1 Su Li1
1Department of Pharmacy, Cancer Hospital of China Medical University, Liaoning Cancer Hospital & Institute, Shenyang, Liaoning, 110042, People’s Republic of China; 2Department of Pharmacy, Qujing Medical College, Qujing, Yunnan, 655000, People’s Republic of China
Correspondence: Su Li, Department of Pharmacy, Cancer Hospital of China Medical University, Liaoning Cancer Hospital & Institute, No. 44, Xiaoheyan Road, Dadong District, Shenyang, Liaoning, 110042, People’s Republic of China, Tel +86-024-81916806, Email [email protected]
Introduction: High-dose methotrexate is a typical chemotherapy that is widely used in the treatment of osteosarcoma. However, the unique dose-response relationship of methotrexate makes its treatment window relatively narrow, and its clinical use is in a dilemma: either the drug concentration in the patient’s body cannot reach the effective concentration level, or adverse reactions may occur due to drug overdose. For this circumstance, monitoring and predicting the drug concentration in the patient’s body is well founded and necessary. While pharmacokinetic models exist, they often oversimplify patient-specific covariates. This study addresses the unmet need for early-exposure prediction through interpretable machine learning, enabling data-driven decisions before toxicity manifestation.
Methods: In this article, 68 osteosarcoma patients’ information including demography, administration and assay was gathered. We analyzed medical data and selected 10 important features using a random forest, including hydration status, red blood cell distribution width coefficient of variation, platelet distribution width, creatinine, γ-glutamyl transferase, large platelet ratio, serum potassium, lactate dehydrogenase, weight, and prealbumin. Then, cross-validation and SHAP has been conducted to confirm the robust and interpretation of the model.
Results: On this basis, 7 machine learning regression models was built to predict the blood concentration of methotrexate. R2, MSE, RMSE, MAE are the evaluation metrics. Finally, LightGBM was selected as the best prediction model with a performance of R2=0.87, MSE=0.020, RMSE=0.141, MAE=0.065.
Discussion: This machine learning framework addresses a critical gap in high-dose methotrexate therapeutic monitoring by achieving early and personalized blood drug concentration prediction, allowing for personalized dosing of patients based on predicted concentrations. The interpretability of SHAP-derived feature importance enhances clinical utility, offering a paradigm shift from reactive toxicity management to proactive precision dosing in osteosarcoma therapy.
Keywords: high-dose methotrexate, osteosarcoma, machine learning, blood concentration prediction
Introduction
Osteosarcoma is the most prevalent primary malignant bone tumor in children and adolescents, accounting for approximately 5% of all childhood cancers.1 It typically manifests in the adolescent decade of life, with a peak incidence between the ages of 15 and 19.1 The tumor primarily arises in the metaphysis of long bones, most ordinarily affecting the distal femur, proximal tibia, and humerus.2 The aggressive nature of osteosarcoma is attributed to its high proliferation rate and ability to metastasize early, often to the lungs.3,4 Existing studies have found that age and race have an impact on the incidence rate and survival period of osteosarcoma.5,6 The pathophysiology of osteosarcoma involves complex interactions between genetic, epigenetic, and environmental factors. Genetic predispositions, such as mutations in the TP53 gene or the RB1 gene associated with hereditary retinoblastoma, significantly increase the risk of developing this malignancy.7,8 Moreover, the tumor microenvironment plays a crucial role in tumor progression, influencing cell signaling pathways that regulate tumor growth, invasion, and metastasis.9,10 Despite advancements in surgical techniques and multimodal chemotherapy regimens, which typically include agents such as doxorubicin, cisplatin, and high-dose methotrexate, the prognosis for patients with metastatic osteosarcoma remains poor.11,12 The five-year survival rate for localized osteosarcoma is approximately 70%, but this drops to less than 30% for those with metastatic disease.5,6 The heterogeneity of the disease further complicates treatment, as variations in tumor biology can lead to different responses to therapy, necessitating individualized treatment strategies.13
High-dose methotrexate (HD-MTX) is a cornerstone of osteosarcoma treatment, leveraging its mechanism as a potent inhibitor of dihydrofolate reductase to disrupt nucleotide synthesis and inhibit rapidly proliferating tumor cells.14–17 The standard dosing regimen for HD-MTX typically ranges from 8 to 12 g/m², administered alongside other chemotherapeutic agents to maximize therapeutic efficacy.18–20 This multi-agent approach enhances the likelihood of achieving complete remission and reducing the risk of recurrence.21,22 While HD-MTX is effective, it is associated with significant toxicities, including nephrotoxicity, mucositis, and myelosuppression.23 The risk of adverse effects necessitates rigorous monitoring of drug concentrations, particularly due to the steep dose-response relationship associated with methotrexate. Therapeutic drug monitoring (TDM) is critical to optimizing dosing, as individualized adjustments can help maintain drug concentrations within the therapeutic window while minimizing toxicity.24 Recent studies suggest that TDM for HD-MTX can improve patient outcomes by enabling dose modifications based on real-time pharmacokinetic data. However, traditional pharmacokinetic (PK) approaches often rely on population averages, which may not accurately reflect individual patient variability.25 In addition, the success of the application of PK model largely depends on the accuracy and comprehensiveness of the model parameters, but the acquisition of model parameters is limited by biochemical analysis methods and is usually difficult.26 This limitation underscores the need for innovative strategies to enhance the precision of dosing.
The integration of machine learning (ML) in oncology and pharmaceuticals represents a transformative approach to personalizing treatment strategies.27,28 Machine learning algorithms can analyze complex datasets to identify patterns and predict patient responses to therapies, significantly impacting clinical decision-making.29 In the context of osteosarcoma, ML has demonstrated utility in predicting treatment responses, identifying biomarkers for disease progression, and improving patient stratification based on the likelihood of therapeutic success.30–33 For instance, advanced ML techniques such as support vector machines, random forests, and deep learning algorithms have been utilized to predict overall survival and treatment responses to drugs by analyzing diverse clinical, genomic, and proteomic data.34,35 In terms of TDM, the concentration of drugs and their metabolites in plasma/serum can better predict the clinical severity and potential outcomes of cases compared to assumed intake and time.36 There have been machine learning studies on predicting blood drug concentrations of several types of drugs, including anticoagulants, antipsychotics, antiepileptics, antibiotics, and immunosuppressants.37–41 These models can process vast amounts of information, identifying subtle interactions and correlations that traditional statistical methods might overlook. As a result, ML algorithms can provide clinicians with actionable insights that enhance patient management, tailoring treatments to individual needs. Moreover, ML’s application extends to pharmacokinetics, where it can improve predictions of drug concentrations and patient responses.42 This capability is particularly critical in oncology, where the therapeutic index of chemotherapeutic agents is often narrow, making accurate dosing essential for maximizing efficacy while minimizing toxicity. To our knowledge, there is currently limited research on high-dose methotrexate related machine learning.
This study aims to identify the factors that significantly influence methotrexate (MTX) blood concentration through medical data and machine learning methods, and to develop a predictive regression model for MTX blood concentration in osteosarcoma patients receiving high-dose chemotherapy to assist clinical decision-making.
Method
Patients
This retrospective study included data from osteosarcoma patients who received the high-dose methotrexate regimen at the Liaoning Provincial Cancer Hospital between July 2020 and August 2022. The study protocol and plan were in compliance with the ethical review standards of Liaoning Provincial Cancer Hospital (Approval Number: KT20240320).
Inclusion criteria were: (1) a definitive diagnosis of osteosarcoma based on clinical presentation, imaging, and pathological examination; (2) receiving HD-MTX as a monotherapy in cycles; (3) no gender restrictions and at least one completed chemotherapy cycle; (4) monitoring of methotrexate blood concentrations during chemotherapy; (5) pre- and post-chemotherapy blood tests, including complete blood count and liver/kidney function tests; (6) general good health, with normal liver and kidney function indicators. Exclusion criteria were: (1) patients who did not complete the planned HD-MTX chemotherapy; (2) patients with pleural or peritoneal effusion; (3) patients with poor postoperative wound healing; (4) patients with incomplete data on blood drug concentrations or clinical records. Based on clinical guidelines and previous literature, this study defined delayed methotrexate elimination as C24h ≥ 10 μmol·L⁻¹, C48h ≥ 1 μmol·L⁻¹, and C72h ≥ 0.1 μmol·L⁻¹.
Before chemotherapy, patients underwent hydration and alkalization (fluid intake ≥ 3000 mL) 24 hours prior to the chemotherapy. On the day of chemotherapy, methotrexate was administered based on the patient’ s body surface area (BSA) using 5% glucose injection and the corresponding dose of methotrexate, infused over a period of at least 6 hours. Electrocardiogram and pulse oximetry monitoring were conducted for 8 hours, during which methotrexate blood concentrations, urine output, and urine pH levels were monitored to enable the implementation of calcium folinate (CF) rescue therapy.
Baseline Information
This retrospective study included data from 68 cases of osteosarcoma patients. The mean age of the enrolled patients was 17.88 ± 7.03 years (range: 7–47 years). Among the patients, 53 were male (77.94%), and 51 patients received preoperative chemotherapy. The hydration volume ranged from 4072.50 to 4722.00 mL. According to the diagnostic records, 70.59% of the tumors were located in the femur, which is consistent with the distribution of osteosarcoma in the Chinese population. A total of 82 variables were collected, and the data distribution did not follow a normal distribution. Twelve variables with more than 50% missing data were excluded, and the remaining missing values were imputed using the median. The demographic and clinical data of the patients are shown in the Table 1.
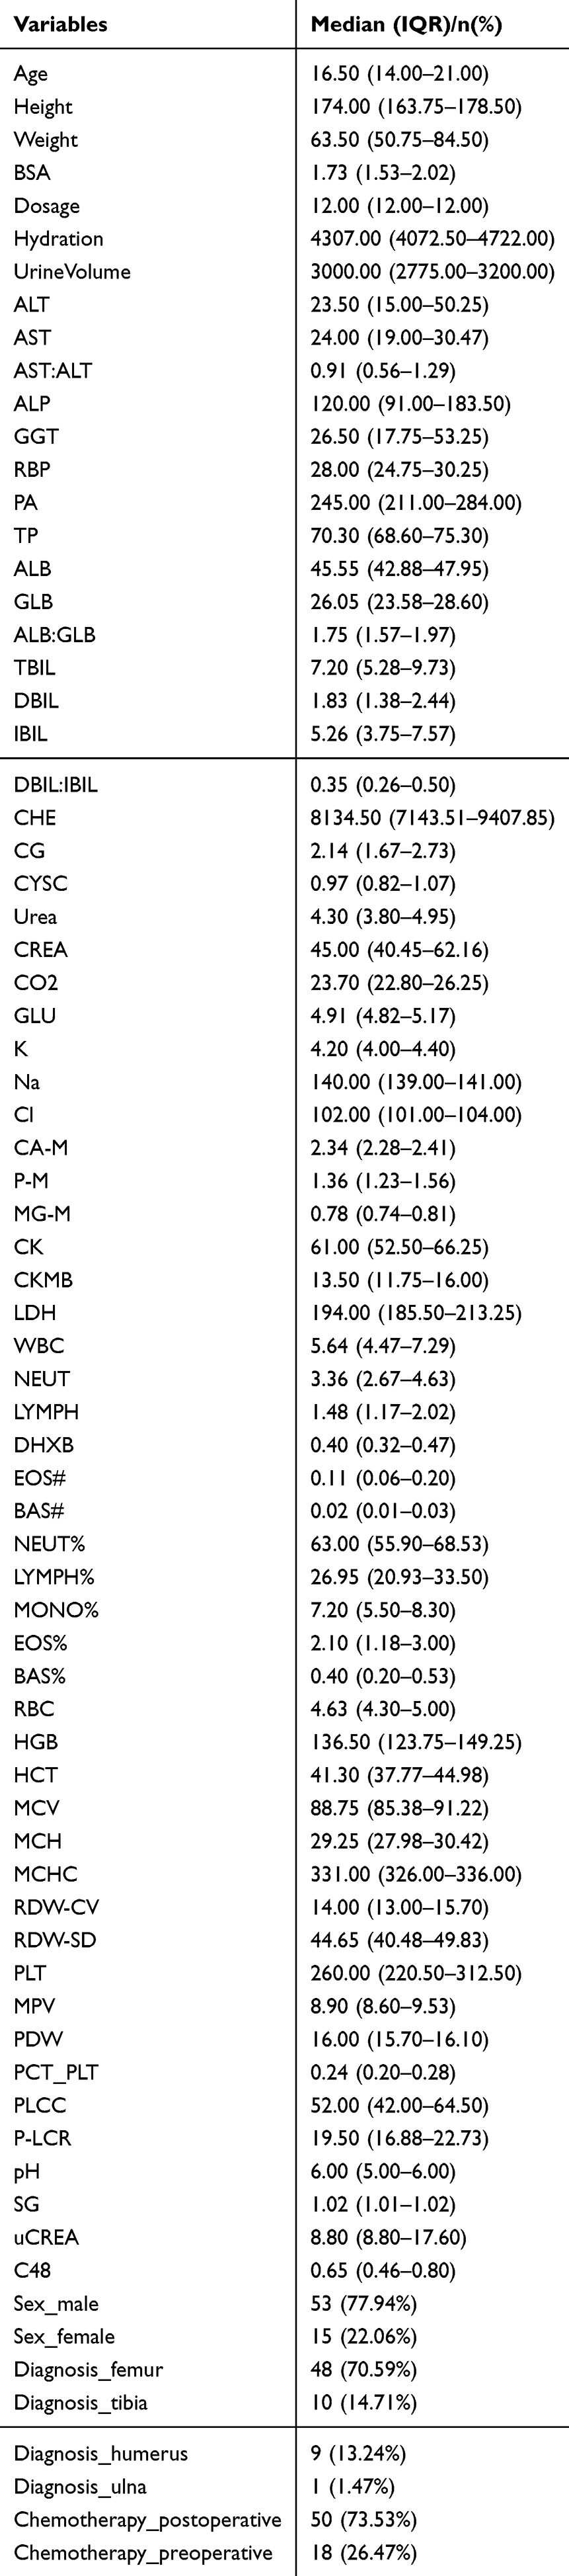 |
Table 1 The Basic Characteristics of Patients |
Data Processing
Data on methotrexate (MTX) patients were extracted from the hospital information system. A total of 80 variables were collected, including basic patient information such as gender, age, weight, height, and body surface area; medication information such as MTX dosage, chemotherapy regimen, and tumor type; and physiological data including serum creatinine level (SCR) and serum alanine aminotransferase level (ALT), etc. Specific indicators are shown in the Table 1.
The dataset was split into training and testing sets in an 8:2 ratio (Table 2). Normality was tested using the Shapiro–Wilk test. For variables that followed a normal distribution, a t-test was used; for variables that did not follow a normal distribution, the Mann–Whitney U-test was employed. For categorical variables, the Chi-square (χ²) test was used to assess associations.
 |
Table 2 Partition of the Dataset |
Missing data were handled according to the extent of the missingness. Variables with a missing rate greater than 50% were excluded, while variables with a missing rate of less than 50% were imputed using the median value. This is determined by the skewed distribution of the data. Categorical variables were processed using one-hot encoding to address feature discretization issues and to expand the feature space. Ultimately, 68 variables were retained for further analysis.
Due to limitations in incidence rates and sample collection, the amount of available data was relatively small. To address this issue, we employed the k-Nearest Neighbor (k-NN) algorithm for data augmentation to facilitate predictive modeling. Using the k-NN method, set the parameter ‘num_neighbors’ to 3, which means selecting 3 nearest neighbors for interpolation for each target sample. k-NN does not make assumptions about data distribution, making it suitable for datasets with various distribution forms. The algorithm works by measuring distances between different feature values and is relatively simple in concept. For specific populations, k-NN can generate synthetic data similar to the original samples, thereby supplementing the sample size for modeling purposes. The tools and libraries used for data processing and modeling are shown in Table 3.
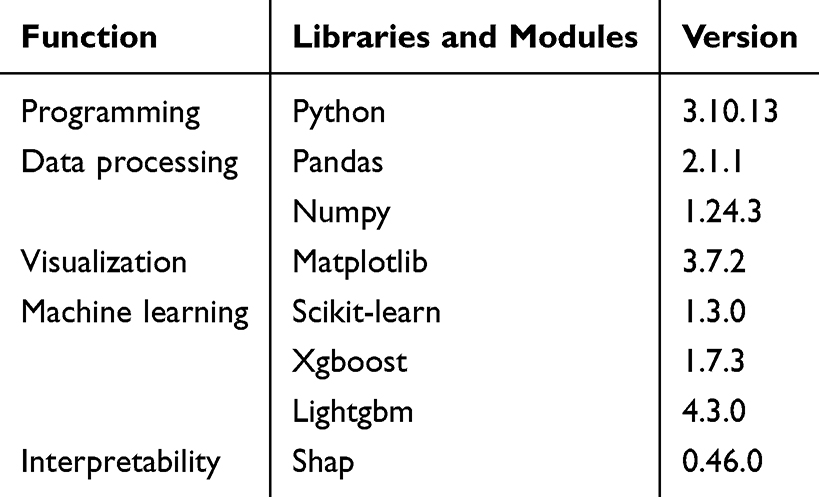 |
Table 3 Tools and Library Used in Research |
Variable Selection
Based on the processed methotrexate (MTX) patient medical data, the random forest algorithm was applied to identify key variables from multiple influencing factors. Initially, we attempted data transformations to optimize the data structure and improve training performance. However, after comparison, we found that transformations such as logarithmic transformation and Cox transformation adversely affected the model’s ability to assess the variables. Therefore, after careful consideration, the original data was used for variable selection.
Next, all variables were incorporated into the random forest model for fitting, and the variables were ranked according to their importance. The model’s performance was evaluated using several metrics, including R², mean absolute error (MAE), and root mean-squared error (RMSE). The coefficient of determination (R²) is a measure of the proportion of variance explained by the model, with values ranging from 0 to 1; the higher the value, the better the model’s fit. Mean-squared error (MSE) represents the average of the squared differences between predicted and actual values, and the square root of MSE yields RMSE. RMSE is sensitive to outliers due to the squaring of errors, making it especially useful for assessing model performance when the target variable does not follow a normal distribution. MAE measures the average of the absolute differences between predicted and actual values. To optimize the model, a visualization of the relationship between the number of features and the evaluation metrics (R2, MAE, RMSE) was performed to select the appropriate number of features.


In the formula,  represents the true value,
  represents the predicted value, and
  represents the average value.
Exploratory Data Analysis
The process of feature selection in the random forest model is illustrated in the Figure 1. It can be observed that the inclusion of features significantly improved the model’s fit and reduced the error at the initial stage. However, as the number of features continued to increase, the performance enhancement became gradual and eventually plateaued, reaching a threshold. Although the model achieved relatively accurate predictions with just seven features, we conservatively selected ten features for further model construction, taking into account various evaluation metrics, previous literature, and clinical considerations. The ten features selected by the random forest model include: hydration value, red blood cell distribution width coefficient of variation (RDW-CV), platelet distribution width (PDW), creatinine (CREA), γ-glutamyl transferase (GGT), large platelet ratio (PLCC), serum potassium (K), lactate dehydrogenase (LDH), body weight, and prealbumin (PA).
 |
Figure 1 Number of features and random forest performance. |
Model Building
Using the predictor variables filtered through random forest, seven machine learning regression models were constructed and analyzed. Prior to model construction, the k-Nearest Neighbor (k-NN) method was applied to generate synthetic samples to address the issue of insufficient sample size. The algorithms evaluated in the study included extreme gradient boosting (XGBoost), random forest, gradient boosting regression, light gradient boosting machine (LightGBM), elastic net regression, ridge regression, and least absolute shrinkage and selection operator (Lasso).
Model selection was conducted using 5-fold cross-validation and performance metrics discussed in section Variable Selection. Cross-validation was used to test the robustness of the models, while predictive capability was assessed using evaluation metrics. The ideal predictive model should exhibit a high R², along with low MAE, MSE, and RMSE.
Clinical Interpretation
Feature importance reflects the contribution of each variable in the model. Therefore, we used the best-performing model to calculate the importance scores of the features and rank them accordingly. Shapley Additive exPlanation (SHAP) is a method that calculates the marginal contribution of features to the model’s output, with the advantages of local accuracy and global consistency.43 This enables SHAP to not only precisely explain individual prediction variables but also to identify features that contribute similarly to the model. Moreover, if the model undergoes changes, the importance of features (SHAP values) in predictions remains unchanged. This consistency ensures the stability and reliability of SHAP. Therefore, we employed SHAP to visualize the influence of these important variables and provide interpretability for the selected model, addressing the “black-box” issue often associated with machine learning models.
Result
Model Performance
By utilizing the ten important features, and after performing cross-validation and comprehensive comparison, we selected LightGBM as the final predictive model due to its lowest mean-squared error (MSE) and the best generalization ability (Table 4). The final LightGBM model achieved an impressive performance with R² = 0.87, MAE = 0.065, MSE=0.020, and RMSE = 0.141, making it the most effective model for predicting MTX blood concentrations. This suggests that the model exhibits excellent predictive power and generalization capability. It is worth noting that although the gradient boosting model performed slightly worse in cross-validation compared to LightGBM, it still outperformed other models in both the training and testing sets. This indicates that while the gradient boosting model has superior predictive ability, its generalization performance is slightly weaker. With a larger dataset in the future, this limitation may be addressed. Additionally, the three boosting algorithms (LightGBM, XGBoost, AdaBoost) showed similar performance, while the extended linear regression models (Lasso, Ridge, and ElasticNet) did not perform as well.
 |
Table 4 Performance of 7 Machine Learning Models |
Clinical Interpretation
In the Figure 2, the vertically arranged features are sorted by their influence, from top to bottom, with the feature impact ranked from strong to weak. The features, in order of their influence on the final result, are: Weight, RDW-CV, LDH, PA, P-LCR, GGT, CREA, Hydration, Serum Potassium, and PLCC. The wider the color area, the greater the influence of that feature on the final result. As observed, Weight, RDW-CV, and LDH have the largest color areas, indicating their significant impact on the prediction. The color intensity reflects the values of the features: red indicates higher feature values, blue indicates lower feature values, and purple represents values closer to the mean. The horizontal axis represents the SHAP values, which show the magnitude of each feature’s impact on the model’s prediction. The further a point is from the central zero line, the larger the effect of the feature on the model’s output. Positive SHAP values indicate a positive influence, while negative SHAP values indicate a negative influence. For instance: For lower Weight, RDW-CV, LDH, PA, GGT, and Hydration, the model tends to output higher drug concentration values. Conversely, for P-LCR, CREA, K, and PLCC, the model’s output is more aligned with the input values—as these features increase, the predicted drug concentration increases accordingly.
 |
Figure 2 SHAP values of important features. |
Discussion
In this study, 7 machine learning models was developed to predict the methotrexate blood concentration in osteosarcoma patients following chemotherapy. The variable selection process was conducted using a random forest algorithm, and the predictive performance of linear models and boosting models was compared. Ultimately, the LightGBM model was selected, yielding a prediction model with an R² of 0.87. Additionally, models based on boosting algorithms, including XGBoost, LightBoost, and gradient boosting, demonstrated strong predictive performance across various metrics. In contrast, linear algorithms such as Lasso, Ridge, and ElasticNet performed poorly. Further investigation revealed that their performance was highly dependent on sample size and distribution, which we hypothesize is due to the nonlinear nature of blood concentration features. When dealing with unevenly distributed and poorly defined medical data, machine learning models based on boosting algorithms outperform traditional linear kernel methods in predictive accuracy.
Among the important variables identified by the random forest model, some have been mentioned in previous studies, while others are new factors discovered in this research. In the LightGBM predictive model, these influencing factors were reordered, and the SHAP analysis further confirmed their impact. For example, hydration status has long been recognized as a critical component in high-dose methotrexate chemotherapy regimens. Hydration and urine alkalinization are essential protective measures to safeguard the kidneys and prevent adverse drug events, whether in hematologic malignancies or osteosarcoma.44 Additionally, studies have highlighted the statistical significance of weight, albumin levels, and urine output in the distribution of methotrexate blood concentrations.45,46 The key features identified in this study, such as weight and prealbumin, align with previous research; however, urine output was excluded during variable selection, possibly due to overlap with the effects of hydration and renal function-related indicators. Further research is needed to confirm the significance of urine output as an influencing factor.
Liver and kidney functions play an essential role in drug metabolism.23 GGT is commonly used as an indicator of liver health, and its expression is particularly active in the proliferation and differentiation of bone marrow and the progression of hematologic malignancies.47,48 Kidney function directly impacts the deposition of methotrexate and its metabolites in the renal tubules, with CREA levels reflecting renal filtration capacity. Furthermore, we identified that LDH, RDW-CV, PLCC, and P-LCR also influence methotrexate blood concentrations. LDH is closely associated with hematologic disorders and is related to tumor proliferation, invasion, and severity, aiding in early diagnosis and efficacy monitoring. Some studies have suggested LDH as a novel biomarker.49–52 RDW-CV is typically used to differentiate anemia types, but it can also serve as a new predictive indicator for cardiovascular diseases and general population prognosis. PLCC and P-LCR are hematological biomarkers used to assess platelet status. For methotrexate, a drug that can cause significant bone marrow suppression, these indicators reflect the patient’s hematopoietic system status.
These findings suggest that both methotrexate dosage and rescue treatment should be carefully considered based on the patient’s hematopoietic function, liver, and kidney function. The random forest model has proven to be highly comprehensive in feature selection, effectively identifying important influencing factors from multiple variables while maintaining strong interpretability. When combined with highly predictive machine learning models and SHAP analysis techniques, it offers valuable assistance in the analysis of medical data.
Previous studies have applied machine learning techniques to analyze methotrexate (MTX) dosage indicators for the precise prediction of adverse drug reactions or delayed drug excretion. However, no studies have yet focused on predicting methotrexate blood concentrations. In contrast, research on the drug tacrolimus has successfully integrated machine learning with real-world data to develop a predictive model for tacrolimus blood concentration in autoimmune disease populations. This model, constructed using nine features and the XGBoost algorithm, achieved an R² of 0.54 and a mean absolute error (MAE) of 0.25.53 Research on methotrexate has largely concentrated on predicting delayed elimination and adverse reactions, with populations mainly consisting of hematologic cancer and rheumatoid arthritis patients.54–56 For instance, a model predicting hepatotoxicity and delayed elimination for low-dose methotrexate achieved an ROC of 0.97.55 Compared to classification problems, regression tasks require larger sample sizes and higher data quality. Using appropriate methods for sample augmentation can reduce the cost of data collection, which is especially useful in situations where some medical data is difficult to accumulate or requires long collection periods. However, whether these models can be further applied depends on the accumulation and validation of real-world data.
Traditional pharmacokinetic models are based on the atrioventricular theory or physiological pharmacokinetics to describe drug metabolism processes through parameters such as clearance rate and distribution volume. The mechanism is clear and can maintain stability in small samples, allowing for direct understanding of clinical decisions. However, the process of obtaining and calculating parameters is difficult to capture nonlinear relationships between individuals, and the accuracy of simulating complex drug organ interactions is limited.57,58 Machine learning models directly learn the correlation pattern between blood drug concentration and influencing factors through feature engineering, which has advantages in predicting population heterogeneity and nonlinear relationships.59 However, relying on large-scale labeled data and extrapolating to new drugs or special populations poses risks.60 The explainable tool SHAP can partially explain the feature contribution, but the “black box” attribute still restricts its application. Both methods have limitations, but attempts to integrate them may be able to compensate for their respective shortcomings. Although the k-NN algorithm was used for sample amplification, the sample size of this study is still relatively small and lacks controls. The model needs to be validated and improved. In the future, further accumulation of cases can be considered for dose adjustment experiments, or PK parameters can be incorporated into machine learning modeling to enhance the interpretability of the model and guide clinical decision-making.
The convergence of osteosarcoma treatment, high-dose methotrexate administration, and the innovative application of machine learning and model-informed precision dosing for predicting blood drug concentrations underscores a critical area of ongoing research. By adjusting the patient’s medication dosage based on the predicted blood drug concentration and existing recommended administration methods using our research model, it may be possible to avoid delayed elimination of drugs and the occurrence of drug-related adverse reactions. Simultaneously providing a new predictive paradigm distinct from pharmacokinetic models. The potential to personalize therapy through advanced computational methods holds significant promise for improving survival rates and quality of life in affected patients. Continued exploration into the integration of ML and model-informed precision dosing (MIPD) in clinical settings, alongside robust pharmacokinetic studies, will be essential for refining treatment protocols and maximizing therapeutic efficacy.
Conclusion
In summary, based on real-world data from 68 cases of methotrexate therapeutic drug monitoring, this study utilized data augmentation and machine learning techniques to identify and select 10 key variables that significantly influence methotrexate blood concentrations. These variables include hydration status, red blood cell distribution width coefficient of variation, platelet distribution width, creatinine, γ-glutamyl transferase, large platelet ratio, serum potassium, lactate dehydrogenase, weight, and prealbumin, along with their quantitative relationships. A predictive model for methotrexate blood concentration following high-dose chemotherapy in osteosarcoma patients was then constructed, with SHAP analysis used for model interpretation. After comparing with other models, the LightGBM algorithm demonstrated the best predictive performance.
To date, this study is the first to apply real-world data, data augmentation, and machine learning techniques to predict high-dose methotrexate blood concentrations, offering valuable insights and modeling approaches for utilizing small sample sizes in the medical field. In addition, machine learning methods have broken through the bottleneck of traditional monitoring, providing possibilities for reducing patient blood collection pain, improving the safety of methotrexate medication, and promoting personalized use of methotrexate in primary hospitals. They also provide ideas for the development of pharmacokinetics and optimization of dose adjustment. The limitation of this study lies in its single-source sample, relatively small dataset, and lack of multi-center external validation to confirm the model’s generalizability. In the future, through data accumulation and external collaborations, the reliability and applicability of the model will be further validated and optimized.
Data Sharing Statement
This study was conducted in compliance with data protection regulations. The use of personal data was approved by the Liaoning Cancer Hospital & Institution Ethics Committee, ensuring that all data was anonymized and securely stored.
Ethics Statement
This retrospective study was approved by the Institutional Review Board of Liaoning Cancer Hospital & Institution (Approval Number: KT20240320). Given the retrospective nature of the study and the use of de-identified patient data, the requirement for informed consent was waived by the IRB. The study was conducted in accordance with the ethical standards of the Declaration of Helsinki and its later amendments.
Author Contributions
All authors made a significant contribution to the work reported, whether that is in the conception, study design, execution, acquisition of data, analysis and interpretation, or in all these areas; took part in drafting, revising or critically reviewing the article; gave final approval of the version to be published; have agreed on the journal to which the article has been submitted; and agree to be accountable for all aspects of the work.
Funding
This work was supported by the Liaoning Provincial Science and Technology Joint Program (No. 2024-MSLH-273).
Disclosure
The authors report no conflicts of interest in this work.
References
1. Ritter J, Bielack SS. Osteosarcoma. Ann Oncol. 2010;21(7):vii320–5. doi:10.1093/annonc/mdq276
2. Isakoff MS, Bielack SS, Meltzer P, Gorlick R. Osteosarcoma: current treatment and a collaborative pathway to success. J Clin Oncol. 2015;33(27):3029–3035. doi:10.1200/JCO.2014.59.4895
3. Moukengue B, Lallier M, Marchandet L, et al. Origin and therapies of osteosarcoma. review. Cancers. 2022;14(14):3503. doi:10.3390/cancers14143503
4. Bielack SS, Kempf-Bielack B, Delling G, et al. Prognostic factors in high-grade osteosarcoma of theextremities or trunk: an analysis of 1702 patients treated on neoadjuvant cooperative osteosarcoma study group protocols. J Clin Oncol. 2023;41(27):4323–4337. doi:10.1200/jco.22.02767
5. Mirabello L, Troisi RJ, Savage SA. Osteosarcoma incidence and survival rates from 1973 to 2004: data from the surveillance, epidemiology, and end results program. Cancer. 2009;115(7):1531–1543. doi:10.1002/cncr.24121
6. Cole S, Gianferante DM, Zhu B, Mirabello L. Osteosarcoma: a surveillance, epidemiology, and end results program-based analysis from 1975 to 2017. Cancer. 2022;128(11):2107–2118. doi:10.1002/cncr.34163
7. Balamuth NJ, Womer RB. Ewing’s sarcoma. Lancet Oncol. 2010;11(2):184–192. doi:10.1016/S1470-2045(09)70286-4
8. Chen X, Bahrami A, Pappo A, et al. Recurrent somatic structural variations contribute to tumorigenesis in pediatric osteosarcoma. Cell Rep. 2014;7(1):104–112. doi:10.1016/j.celrep.2014.03.003
9. Wu C, Gong S, Duan Y, et al. A tumor microenvironment-based prognostic index for osteosarcoma. J Biomed Sci. 2023;30(1):23. doi:10.1186/s12929-023-00917-3
10. Tran KA, Kondrashova O, Bradley A, Williams ED, Pearson JV, Waddell N. Deep learning in cancer diagnosis, prognosis and treatment selection. Genome Med. 2021;13(1). doi:10.1186/s13073-021-00968-x
11. Rosen G, Marcove RC, Caparros B, Nirenberg A, Kosloff C, Huvos AG. Primary osteogenic sarcoma: the rationale for preoperative chemotherapy and delayed surgery. Cancer Jun. 1979;43(6):2163–2177. doi:10.1002/1097-0142(197906)43:6<2163::aid-cncr2820430602>3.0.co;2-s
12. Jolivet J, Cowan KH, Curt GA, Clendeninn NJ, Chabner BA. The pharmacology and clinical use of methotrexate. N Engl J Med. 1983;309(18):1094–1104. doi:10.1056/NEJM198311033091805
13. Esteva A, Robicquet A, Ramsundar B, et al. A guide to deep learning in healthcare. Nat Med. 2019;25(1):24–29. doi:10.1038/s41591-018-0316-z
14. Jaffe N. Recent advances in the chemotherapy of metastatic osteogenic sarcoma. Cancer. 1972;30(6):1627–1631. doi:10.1002/1097-0142(197212)30:6<1627::Aid-cncr2820300631>3.0.Co;2-h
15. Jaffe N, Frei E, Traggis D, Bishop Y. Adjuvant methotrexate and citrovorum-factor treatment of osteogenic sarcoma. N Engl J Med. 1974;291(19):994–997. doi:10.1056/nejm197411072911902
16. Jaffe N. Osteosarcoma: review of the past, impact on the future. the American experience. In: Jaffe N, Bruland OS, Bielack SS, editors. Pediatric and Adolescent Osteosarcoma. Cancer Treatment and Research; 2009:239–262.
17. Weinstein GD. Methotrexate. Ann Intern Med. 1977;86(2):199–204. doi:10.7326/0003-4819-86-2-199
18. Jaffe N, Prudich J, Knapp J, et al. Treatment of primary osteosarcoma with intra-arterial and intravenous high-dose methotrexate. J Clin Oncol. 1983;1(7):428–431. doi:10.1200/JCO.1983.1.7.428
19. Schornagel JH, McVie JG. The clinical pharmacology of methotrexate. Cancer Treat Rev. 1983;10(1):53–75. doi:10.1016/S0305-7372(83)80032-2
20. Song Z, Hu Y, Liu S, et al. Medication therapy of high-dose methotrexate: an evidence-based practice guideline of the division of therapeutic drug monitoring, Chinese pharmacological society. Br J Clin Pharmacol. 2022;88(5):2456–2472. doi:10.1111/bcp.15134
21. Jaffe N, Gorlick R. High-dose methotrexate in osteosarcoma: let the questions surcease--time for final acceptance. J Clin Oncol. 2008;26(27):4365–4366. doi:10.1200/JCO.2007.14.7793
22. Crom WR, Pratt CB, Green AA, et al. The effect of prior cisplatin therapy on the pharmacokinetics of high-dose methotrexate. J Clin Oncol. 1984;2(6):655–661. doi:10.1200/JCO.1984.2.6.655
23. Howard SC, McCormick J, Pui C-H, Buddington RK, Harvey RD. Preventing and managing toxicities of high-dose methotrexate review. Oncologist. 2016;21(12):1471–1482. doi:10.1634/theoncologist.2015-0164
24. Martin-Loeches I. Therapeutic drug monitoring (TDM) in real-time: a need for the present future. Expert Rev Anti Infect Ther. 2022;20(10):1245–1247. doi:10.1080/14787210.2022.2110070
25. Dupuis C, Mercier C, Yang C, et al. High-dose methotrexate in adults with osteosarcoma: a population pharmacokinetics study and validation of a new limited sampling strategy. Anticancer Drugs. 2008;19(3):267–273. doi:10.1097/CAD.0b013e3282f21376
26. Peters SA, Dolgos H. Requirements to establishing confidence in Physiologically Based Pharmacokinetic (PBPK) models and overcoming some of the challenges to meeting them. Clin Pharmacokinet. 2019;58(11):1355–1371. doi:10.1007/s40262-019-00790-0
27. Shimizu H, Nakayama KI. Artificial intelligence in oncology. Cancer Sci. 2020;111(5):1452–1460. doi:10.1111/cas.14377
28. Swanson K, Wu E, Zhang A, Alizadeh AA, Zou J. From patterns to patients: advances in clinical machine learning for cancer diagnosis, prognosis, and treatment. Cell. 2023;186(8):1772–1791. doi:10.1016/j.cell.2023.01.035
29. Zhang C, Xu J, Tang R, et al. Novel research and future prospects of artificial intelligence in cancer diagnosis and treatment. J Hematol Oncol. 2023;16(1). doi:10.1186/s13045-023-01514-5
30. Daldrup-Link H. Artificial intelligence applications for pediatric oncology imaging. Pediatr Radiol. 2019;49(11):1384–1390. doi:10.1007/s00247-019-04360-1
31. Bai BL, Wu ZY, Weng SJ, Yang Q. Application of interpretable machine learning algorithms to predict distant metastasis in osteosarcoma. Cancer Med. 2023;12(4):5025–5034. doi:10.1002/cam4.5225
32. Li S, Zheng Z, Wang B. Machine learning survival prediction using tumor lipid metabolism genes for osteosarcoma. Sci Rep. 2024;14(1):12934. doi:10.1038/s41598-024-63736-y
33. Li W, Liu Y, Liu W, et al. Machine learning-based prediction of lymph node metastasis among osteosarcoma patients. Front Oncol. 2022;12:797103. doi:10.3389/fonc.2022.797103
34. Jiang F, Jiang Y, Zhi H, et al. Artificial intelligence in healthcare: past, present and future. Stroke Vasc Neurol. 2017;2(4):230–243. doi:10.1136/svn-2017-000101
35. Baptista D, Ferreira PG, Rocha M. Deep learning for drug response prediction in cancer. Briefings Bioinf. 2021;22(1):360–379. doi:10.1093/bib/bbz171
36. Schulz M, Schmoldt A, Andresen-Streichert H, Iwersen-Bergmann S. Revisited: therapeutic and toxic blood concentrations of more than 1100 drugs and other xenobiotics. Crit Care. 2020;24(1):195. doi:10.1186/s13054-020-02915-5
37. Xue L, Singla RK, He S, et al. Warfarin-a natural anticoagulant: a review of research trends for precision medication. Phytomedicine. 2024;128:155479. doi:10.1016/j.phymed.2024.155479
38. Guo W, Yu Z, Gao Y, et al. A machine learning model to predict risperidone active moiety concentration based on initial therapeutic drug monitoring. Front Psychiatry. 2021;12:711868. doi:10.3389/fpsyt.2021.711868
39. Hsu C-W, Tsai S-Y, Wang L-J, et al. Predicting serum levels of lithium-treated patients: a supervised machine learning approach. article. Biomedicines. 2021;9(11):1558. doi:10.3390/biomedicines9111558
40. Huang X, Yu Z, Bu S, et al. An ensemble model for prediction of vancomycin trough concentrations in pediatric patients. Drug Des Devel Ther. 2021;15:1549–1559. doi:10.2147/dddt.S299037
41. Mo X, Chen X, Wang X, et al. Prediction of tacrolimus dose/weight-adjusted trough concentration in pediatric refractory nephrotic syndrome: a machine learning approach. Pharmgenomics Pers Med. 2022;15:143–155. doi:10.2147/pgpm.S339318
42. Taylor ZL, Vang J, Lopez-Lopez E, Oosterom N, Mikkelsen T, Ramsey LB. Systematic review of pharmacogenetic factors that influence high-dose methotrexate pharmacokinetics in pediatric malignancies. Cancers. 2021;13(11):2837. doi:10.3390/cancers13112837
43. Lundberg SM, Lee S-I. A unified approach to interpreting model predictions.
44. Mallipattu SK, Ross MJ. Methotrexate in the urine. Kidney Int. 2011;80(2):226. doi:10.1038/ki.2011.97
45. Gao X, Qian X-W, Zhu X-H, et al. Population pharmacokinetics of high-dose methotrexate in Chinese pediatric patients with acute lymphoblastic leukemia. Front Pharmacol. 2021;12. doi:10.3389/fphar.2021.701452
46. Li W, Mo J, Yang Z, Zhao Z, Mei S. Risk factors associated with high-dose methotrexate induced toxicities. Expert Opin Drug Metab Toxicol. 2024;20(4):263–274. doi:10.1080/17425255.2024.2332366
47. Graf C, Arncken J, Lange CM, et al. Hepatic sarcoidosis: clinical characteristics and outcome. JHEP Rep. 2021;3(6):100360. doi:10.1016/j.jhepr.2021.100360
48. Bardi E, Mulder RL, van Dalen EC, et al. Late hepatic toxicity surveillance for survivors of childhood, adolescent and young adult cancer: recommendations from the international late effects of childhood cancer guideline harmonization group. Cancer Treat Rev. 2021;100:102296. doi:10.1016/j.ctrv.2021.102296
49. Wu H, Xu G, Li Z, et al. Nomogram predicting leukopenia in osteosarcoma after high-dose methotrexate chemotherapy. Aging. 2022;14(12):5023–5033. doi:10.18632/aging.203978
50. Khan F, Lin Y, Ali H, et al. Lactate dehydrogenase A regulates tumor-macrophage symbiosis to promote glioblastoma progression. Nat Commun. 2024;15(1):1987. doi:10.1038/s41467-024-46193-z
51. Comandatore A, Franczak M, Smolenski RT, Morelli L, Peters GJ, Giovannetti E. Lactate dehydrogenase and its clinical significance in pancreatic and thoracic cancers. Semin Cancer Biol. 2022;86(Pt 2):93–100. doi:10.1016/j.semcancer.2022.09.001
52. Van Wilpe S, Koornstra R, Den Brok M, et al. Lactate dehydrogenase: a marker of diminished antitumor immunity. Oncoimmunology. 2020;9(1):1731942. doi:10.1080/2162402x.2020.1731942
53. Zheng P, Yu Z, Li L, et al. Predicting blood concentration of tacrolimus in patients with autoimmune diseases using machine learning techniques based on real-world evidence. Front Pharmacol. 2021;12:727245. doi:10.3389/fphar.2021.727245
54. Duong SQ, Crowson CS, Athreya A, et al. Clinical predictors of response to methotrexate in patients with rheumatoid arthritis: a machine learning approach using clinical trial data. Arthritis Res Ther. 2022;24(1):162. doi:10.1186/s13075-022-02851-5
55. Hu Q, Wang H, Xu T. Predicting hepatotoxicity associated with low-dose methotrexate using machine learning. J Clin Med. 2023;12(4):1599. doi:10.3390/jcm12041599
56. Lim AJW, Lim LJ, Ooi BNS, et al. Functional coding haplotypes and machine-learning feature elimination identifies predictors of methotrexate response in rheumatoid arthritis patients. EBioMedicine. 2022;75:103800. doi:10.1016/j.ebiom.2021.103800
57. Yates JWT. Integrated pharmacokinetic-pharmacodynamic and agent-based modelling in drug development: current status and future perspectives. Adv Drug Deliv Rev. 2025;216:115474. doi:10.1016/j.addr.2024.115474
58. Minichmayr IK, Dreesen E, Centanni M, et al. Model-informed precision dosing: state of the art and future perspectives. Adv Drug Deliv Rev. 2024;215:115421. doi:10.1016/j.addr.2024.115421
59. Huang S, Xu Q, Yang G, Ding J, Pei Q. Machine learning for prediction of drug concentrations: application and challenges. Clin Pharmacol Ther. 2025;117(5):1236–1247. doi:10.1002/cpt.3577
60. Santos CS, Amorim-Lopes M. Externally validated and clinically useful machine learning algorithms to support patient-related decision-making in oncology: a scoping review. BMC Med Res Methodol. 2025;25(1):45. doi:10.1186/s12874-025-02463-y
 © 2025 The Author(s). This work is published and licensed by Dove Medical Press Limited. The
full terms of this license are available at https://www.dovepress.com/terms.php
and incorporate the Creative Commons Attribution
- Non Commercial (unported, 4.0) License.
By accessing the work you hereby accept the Terms. Non-commercial uses of the work are permitted
without any further permission from Dove Medical Press Limited, provided the work is properly
attributed. For permission for commercial use of this work, please see paragraphs 4.2 and 5 of our Terms.
© 2025 The Author(s). This work is published and licensed by Dove Medical Press Limited. The
full terms of this license are available at https://www.dovepress.com/terms.php
and incorporate the Creative Commons Attribution
- Non Commercial (unported, 4.0) License.
By accessing the work you hereby accept the Terms. Non-commercial uses of the work are permitted
without any further permission from Dove Medical Press Limited, provided the work is properly
attributed. For permission for commercial use of this work, please see paragraphs 4.2 and 5 of our Terms.