")
Back to Journals » Drug Design, Development and Therapy » Volume 19
Single-Cell Transcriptional Analysis Reveals the Mechanism of AZD6738 in HCC Immunotherapy via EZH2 Targeting
Authors Li RP, Wu GZ, Fang XD, Yang WW , Zhang HY, Yue HX, Zheng Y, Wang YP , Zhou YN
Received 5 January 2025
Accepted for publication 5 April 2025
Published 14 April 2025 Volume 2025:19 Pages 2897—2920
DOI https://doi.org/10.2147/DDDT.S508709
Checked for plagiarism Yes
Review by Single anonymous peer review
Peer reviewer comments 2
Editor who approved publication: Professor Yan Zhu
Ren-peng Li,1– 3,* Guo-zhi Wu,1– 3,* Xi-dong Fang,1– 3,* Wen-wen Yang,1– 3 Hui-yun Zhang,1– 3 Han-xun Yue,1– 3 Ya Zheng,2,3 Yu-ping Wang,2,3 Yong-ning Zhou2,3
1The First Clinical Medical College, Lanzhou University, Lanzhou, People’s Republic of China; 2Department of Gastroenterology, The First Hospital of Lanzhou University, Lanzhou, People’s Republic of China; 3Gansu Province Clinical Research Center for Digestive Diseases, The First Hospital of Lanzhou University, Lanzhou, People’s Republic of China
*These authors contributed equally to this work
Correspondence: Yong-ning Zhou, Department of Gastroenterology, The First Hospital of Lanzhou University, Lanzhou, Gansu, 730000, People’s Republic of China, Email [email protected] Yu-ping Wang, Department of Gastroenterology, The First Hospital of Lanzhou University, Lanzhou, Gansu, 730000, People’s Republic of China, Email [email protected]
Objective: This study aims to identify specific molecular targets sensitive to AZD6738 through the integration of network pharmacology and transcriptomic methods, and to assess their potential role in the treatment of hepatocellular carcinoma (HCC). Additionally, we explore the specific effects of AZD6738 on the tumor microenvironment and its ability to regulate immune responses.
Methods: We employed a combination of network pharmacology and transcriptomic analysis to identify specific molecules associated with HCC, including EZH2, CCNB1, PRKDC, CTSL, PSEN1, SLC6A3, and FKBP1A. Using these molecules and clinical features, we constructed a robust prognostic model for HCC. We further used single-cell transcriptomic technology to screen for core targets and performed spatial transcriptomic analysis to determine their spatial distribution. To validate the efficacy of AZD6738 in vivo, we established a subcutaneous tumor model, with the experimental group receiving oral administration of AZD6738 (75 mg/kg). Finally, we assessed the changes in the immune cell expression profile in tumor tissues post-AZD6738 treatment using flow cytometry.
Results: Our study indicates that the high expression of genes such as EZH2, CCNB1, PRKDC, and PSEN1 is associated with poor prognosis in HCC patients. Molecular docking and RT-PCR validation demonstrated that AZD6738 exhibits high affinity for these targets and significantly reduces the mRNA levels of EZH2, PRKDC, and CCNB1 in HCC cell lines, with EZH2 showing the most pronounced decrease. Animal experiments revealed that AZD6738 can enhance the immune microenvironment in liver cancer; specifically, AZD6738 not only promotes the proliferation of CD8+ T cells but also enhances their differentiation into effector memory T cells, indicating that the drug can potentiate anti-tumor immune responses.
Conclusion: This study reveals that AZD6738 demonstrates significant therapeutic efficacy by targeting the key molecule EZH2, thereby modulating the tumor microenvironment and enhancing anti-tumor immunity.
Keywords: hepatocellular carcinoma, AZD6738, molecular docking, targeted therapy
Introduction
Hepatocellular carcinoma (HCC) stands as the fifth most prevalent malignancy globally and ranks as the second principal contributor to cancer-related mortality.1,2 HCC is one of several subtypes of primary liver cancer (PLC), which also includes intrahepatic cholangiocarcinoma (iCCA), mixed hepatocellular-cholangiocarcinoma (HCC-iCCA), and other rare forms such as fibrolamellar carcinoma and hepatic angiosarcoma.3,4 Each subtype presents distinct biological characteristics and therapeutic challenges.5 HCC primarily arises from hepatocytes and is often associated with chronic liver diseases like hepatitis B virus (HBV) or hepatitis C virus (HCV) infections, alcoholic liver disease (ALD), and non-alcoholic fatty liver disease (NAFLD).6 In contrast, iCCA originates from the epithelial cells lining the bile ducts within the liver, and its risk factors include biliary tract diseases and certain genetic syndromes.7 Patients with HCC have a poor prognosis, as most are diagnosed at advanced stages that are refractory to surgery and treatment.8,9 Compared to other types of cancer, no effective medical therapy is available to improve the outcome of patients with primary HCC, namely HCC and cholangiocarcinoma.10 Studies have shown that genetic abnormalities associated with DNA damage and repair are often present in the hepatocytes of HCC patients. These abnormalities may lead to increased sensitivity of cells to DNA damage while attenuating the ability of cells to repair DNA damage, thereby increasing the risk of HCC development.11 Mixed HCC-iCCA represents a unique challenge due to its dual cellular origin, combining features of both hepatocellular and cholangiocarcinoma components, which complicates diagnosis and treatment strategies.12
The DNA damage response constitutes a sophisticated and intricately interconnected signaling network that is pivotal in safeguarding the integrity of the human genome against a spectrum of exogenous and endogenous genotoxic stressors, including UV radiation, ionizing radiation, and reactive oxygen species.13 Ataxia telangiectasia and rad3-related (ATR) is a serine/threonine protein kinase that serves as a pivotal regulator of DNA replication stress response and activation of DNA damage checkpoints.14 The targeting of ATR has demonstrated compelling antitumor efficacy in preclinical models, with several ATR inhibitors (ATRi) progressing through Phase I/II clinical trials as potential anticancer therapeutics.15,16 AZD6738 (ceralasertib) is an oral, selective ATR inhibitor currently undergoing clinical development, either as a standalone treatment or in conjunction with chemotherapy, ionizing radiation, PARP inhibitors, or immunotherapy.17 AZD6738 has exhibited the capability to augment radiation-induced lymphocyte infiltration and activation within tumor tissues, thereby culminating in enhanced anticancer effects.18,19 A recent experimental investigation proposed that AZD6738 could serve as a promising synergistic therapy when combined with radioimmunotherapy to effectively inhibit the proliferation of HCC cells, extend survival, and deter tumor recurrence in HCC patients by enhancing the immune microenvironment.20
Based on this information, there is a growing need to elucidate the therapeutic mechanism of AZD6738 in HCC. Despite the ambiguity surrounding the specific target of AZD6738 in HCC, the primary objective of this study was to delineate the impact of AZD6738 on modulating the tumor immune microenvironment in HCC and identify precise therapeutic targets. Our research offers a potential therapeutic avenue for individuals with advanced HCC, especially considering the diverse biological characteristics of different PLC subtypes, and this treatment approach merits further assessment in future clinical trials.
Materials and Methods
Ethical Compliance
All experimental protocols were approved by the Animal Ethics Committee of the First Hospital of Lanzhou University (LDYYLL2023-382). We strictly followed the Guidelines for the Welfare and Ethics of Laboratory Animals (Ministry of Science and Technology of the People’s Republic of China) for the management and care of the laboratory animals. Additionally, we adhered to the ARRIVE guidelines (https://arriveguidelines.org) for the reporting of in vivo experiments to ensure transparency and reproducibility. According to the provisions of Article 32, Items 1 and 2 of the “Ethical Review Measures for Life Science and Medical Research Involving Humans” issued on February 18, 2023, our human research has been exempted from the approval by the Ethics Committee of the First Hospital of Lanzhou University.
Screening for Differential Genes in AZD6738-HCC
Downloaded transcriptome data of HCC patients (tumor=424, normal=50) from TCGA database (the inclusion criteria are as follows: patients diagnosed with HCC; patients with complete mRNA data and clinical information. During the screening of clinical information, samples with a follow-up time of less than 30 days were excluded), along with the structural formula of AZD6738 from PubChem (https://pubchem.ncbi.nlm.nih.gov/), and 107 putative targets were identified using the Swiss Target Prediction online platform (http://www.swisstargetprediction.ch/). The “ggplot2” package was harnessed for the graphical representation of differentially expressed genes in TCGA-HCC and AZD6738, while the “limma” package was employed to generate a ranked plot of differentially expressed genes, facilitating the discernment of significant alterations. Subsequently, the “ComplexHeatmap” package was utilized to create a visual representation in the form of a heatmap, elucidating functional insights into the interaction between AZD6738 and HCC.
Enrichment Analyses and Network Visualization
We conducted functional enrichment analyses of the differentially expressed genes related to TCGA_HCC, AZD6738, and AZD6738-HCC, visualizing the Gene Ontology (GO) and Kyoto Encyclopedia of Genes and Genomes (KEGG) pathways of TCGA_HCC, AZD6738, and the overlapping genes between the two groups using the “ggplot2” and “clusterProfiler” packages. Chord plots were generated using the “GOplot” package for the AZD6738-HCC intersection genes to dissect the specific functional categories corresponding to the targets.
Construction of PPI Network and Prognostic Analysis of Hub Gene
Initially, the AZD6738-HCC intersection genes were fitted using LASSO regression, resulting in the identification of 11 pivotal genes. Subsequently, analyses encompassing Cox univariate and multivariate regression of critical proteins were carried out using the Kaplan-Meier “survival” package and depicted through forest plots. Cytoscape software facilitated the intricate exploration of TCGA HCC differential gene interactions with the AZD6738 target for Protein-Protein Interaction (PPI) analysis. Furthermore, utilizing the STRING platform (https://cn.string-db.org/cgi/input), a detailed visualization of the protein interactions of key targets was conducted, leading to the identification of seven crucial targets. For a comprehensive comparative assessment, patients were stratified into high- and low-risk categories based on the coefficients derived from the LASSO model. Finally, to assess their clinical significance and prognostic value, Kaplan-Meier survival curves were meticulously constructed for the identified key targets.
Correlation of Key Targets of AZD6738-HCC With Immune Cells and Levels of Invasion in Humans
The TISIDB database (http://cis.hku.hk/TISIDB/) was used to analyze the expression patterns of critical genes in human cancers in conjunction with human immune cells. Using the TIMER algorithm, we elucidated the potential associations between the expression of key targets and immune cell infiltration. Additionally, immunohistochemical images depicting key targets in both normal liver tissue and HCC were obtained from the HPA Online database (https://www.proteinatlas.org/).
Establishment of Prognostic Risk Score Model and Nomogram
A nomogram was crafted for the seven selected key targets in AZD6738-HCC utilizing the “rms” and “survival” packages to forecast the prognosis of HCC patients. The model’s precision was assessed using the concordance index (C-index) and calibration curves, with the “rms” and “survival” packages utilized for validation. Proportional hazards regression models were used to evaluate the impact of these seven key targets on survival outcomes. Additionally, the differentially expressed genes incorporated into the model were subjected to multivariate Cox regression analysis to ascertain whether these pivotal genes served as independent prognostic indicators.
Single-Cell RNA-Seq Data Analysis
The single-cell spatial transcriptome dataset (EGAS00001005204) was acquired from the European Genome-Phenome Archive and included 10 hCC patients. Within this dataset, 295 circulating tumor cells (CTCs) were extracted from four distinct vascular locations: hepatic vein (HV), peripheral artery (PA), peripheral vein (PV), and portal vein (PoV). Additionally, data from the PRHCCdb (Fig. https://db.cngb.org/PRHCCdb/) were collected, comprising transcriptome data from approximately 17,000 cells originating from 18 primary or early recurrent HCC cases. Subsequently, preprocessing of the single-cell RNA sequencing (scRNA-seq) data was conducted using the R package ‘Seurat’ with a methodology aligned with previous research. Principal component analysis (PCA) was then employed for dimensional reduction, and a uniform manifold approximation and projection (UMAP) algorithm was executed on the initial 15 dimensions of PCA for downstream analysis and visualization. The K-nearest neighbor (KNN) algorithm was then used for further categorization with a specified processing resolution of 0.1.
Molecular Docking
Molecular docking is a valuable technique for drug repositioning, target analysis in polypharmacology, and the prediction of adverse reactions. The molecular structure of AZD6738 was obtained from PubChem. Critical molecules were selected from the Protein Data Bank (PDB; https://www.rcsb.org/) to obtain crucial backbone structures. The Yinfu cloud computing platform (https://cloud.yinfotek.com/console/tools) was then used to optimize the compound structures by removing water molecules and adding hydrogen atoms, using MM2 force fields. Subsequently, virtual ensembles of protein structures were generated to predict their binding pockets. Lastly, molecular docking simulations were conducted using the CB-Dock2 tool (https://cadd.labshare.cn/cb-dock2/php/index.php), selecting binding energies below −5 kcal/mol for further docking analysis.
Cell Culture and Real-Time PCR
L-02 (normal liver epithelial cells), Huh-7, PLC/PRF/5 (human-derived HCC cell lines), and Hepa-1-6 (murine HCC cell line) were cultured in DMEM (L110KJ; BasalMedia, Shanghai, China), while SMMC-7721 (human-derived HCC cell line) was cultured in RPMI-1640 (L210KJ; BasalMedia, Shanghai, China). The cell lines were obtained from the Key Laboratory of Digestive System Diseases at the First Hospital of Lanzhou University in Lanzhou, Gansu Province, China. The cell culture media were supplemented with 10% fetal bovine serum (FBS; ST30-3302; PAN-Biotech, Germany), and cells were maintained in a humidified incubator at 37 °C with 5% CO2.
Total RNA was extracted from cultured cells using TRIzol reagent, following the manufacturer’s instructions, and subsequently reverse transcribed. All gene expression results were normalized to those of β-actin. Relative quantification was performed using the 2−ΔΔCT method. The primers used for qRT-PCR were as follows: β-actin: forward primer 5’-CTGGGACGACATGGAGAAAA-3’, reverse primer 5’-AGCACAGCCTGGATAGCAAC-3’; EZH2: forward primer 5’-GTACACGGGGATAGAGAATGTGG-3’, reverse primer 5’-GGTGGGCGGCTTTCTTTATCA-3’; PRKDC: forward primer 5’-CCTGGCCGGTCATCAACTG-3’, reverse primer 5’-AGTAAGGTGCGATCTTCTGGC-3’; CCNB1: forward primer 5’-AATAAGGCGAAGATCAACATGGC-3’, reverse primer 5’-TTTGTTACCAATGTCCCCAAGAG-3’; PSEN1: forward primer 5’-TGGCTACCATTAAGTCAGTCAGC-3’, reverse primer 5’-CCCACAGTCTCGGTATCTTCT-3’. HCC cells (PLC/PRF/5 and Hepa-1-6) were treated with 5 nmol/mL AZD6738 (S7693, Selleck, China) for 24h, and cDNA was extracted for RT-PCR experiments (n=6).
Establishment of Subcutaneous Tumor Model
To further elucidate the therapeutic potential of AZD6738 in managing liver cancer, we meticulously designed and executed a preclinical study. Initially, male C57BL/6 mice (SPF grade, SCXK-2020-0007), aged 4 to 6 weeks, were procured from the Animal Center of Lanzhou University (SYXK-2023-0004) as experimental subjects. Subsequently, according to the method described by Sheng H et al20 for establishing an HCC tumor model, we successfully created a hepatoma model by subcutaneously implanting 5 × 10^6 hepa1-6 cells into the right posterior flank of each mouse (n=12). Upon reaching an approximate tumor volume of 200 mm³, designated as day 0 of the investigation, we initiated a randomization process for the animals (6 mice in the AZD6738 group and 6 mice in the control group) and conducted regular assessments of tumor size every three days using a standardized formula (0.5 × length × width²) to monitor growth dynamics.
During the treatment phase, AZD6738 (S7693, Selleck) was administered intragastrically at a dosage of 75 mg/kg on days 1, 3, and 5, targeting the AZD6738 group of mice to evaluate the agent’s impact on tumor proliferation (n=6).20 Adhering to ethical guidelines governing animal experimentation, we stipulated that the study would be promptly concluded and the mice euthanized when the tumor volume reached 1500 mm³.
Animal Lymphocyte Extraction
On day 7 post-intervention, we implemented meticulous procedures to acquire and process tumor tissue and associated cell samples for an in-depth analysis of the drug’s impact on tumor growth. Following euthanasia, tumor tissues were promptly dissected and isolated before being placed in phosphate-buffered saline (PBS) (B310KJ, BasalMedia) supplemented with 2% fetal bovine serum (FBS) to ensure tissue viability and integrity. The tumor tissues were then sectioned into small fragments, approximately 1 mm³ in size, using tissue scissors and immersed in PBS containing 0.5 mg/mL collagenase type IV (Sigma, 11088858001) and 0.1 mg/mL deoxyribonuclease type I (DNAse I, Stemcell, 7900). This mixture was incubated with shaking at 37°C for one hour to facilitate cell dissociation. The dissociated tissues were mechanically homogenized on frosted slides and then resuspended in 2% FBS in PBS to achieve optimal cell dispersion. For further purification, the resultant tumor cell suspensions were filtered through a 70 µm cell strainer (BD, 352350) to yield pure single-cell suspensions. Concurrently, blood samples were processed by lysing red blood cells with 1 mL of RBC lysis buffer (BD FACS™ Lysing Solution, 349202) for three minutes at room temperature to eliminate erythrocyte components. This was followed by quenching with 5 mL of 1640 culture medium containing 10% FBS to safeguard the viability of the remaining cells. Following cell enumeration, 1 × 10⁶ cells were seeded into a 6-well round-bottom plate and cultured in an incubator set at 37°C with 5% CO2 in preparation for subsequent experimental analyses. Spleen tissues underwent similar processing protocols, beginning with mechanical grinding, followed by lysis of erythrocytes using 1 mL of RBC lysis buffer for five minutes at room temperature, and concluding with quenching in 5 mL of 1640 culture medium containing 10% FBS to ensure cell viability. After filtration through a 70 µm cell strainer, the cell suspensions were similarly counted, and 1 × 10⁶ cells were seeded in a 6-well round-bottom plate and cultured under the same conditions to provide high-quality cell samples for further experimental evaluation.
Flow Cytometric Analysis
To investigate lymphocyte functionality, we stimulated lymphocytes at a concentration of 1 × 10^6 cells/mL with Leuko Act Cktl and GolgiPlug (BD, 550583) for 4 to 6 hours, enhancing cytokine expression. Following stimulation, the cells were incubated for 30 minutes at 4 °C in the dark for surface molecule staining using fluorescently labeled antibodies. After this, the cells were washed twice with phosphate-buffered saline (PBS) to prepare for intracellular factor staining. For intracellular factor analysis, cells were treated with Cytofix/Cytoperm (BD, 554714) at 4 °C for 20 minutes to permeabilize the cell membrane, followed by washing with Perm/Wash (BD, 554714). Subsequently, fluorescently labeled antibodies targeting intracellular factors were added, and the cells were incubated in the dark at 4 °C for an additional 40 minutes before undergoing a final wash for flow cytometric analysis. For nuclear factor staining, a parallel protocol was employed. Following 40 minutes of incubation in Cytofix/Cytoperm (BD, 562574), the cells were prepared using the same washing procedures prior to flow cytometry. During this step, fluorescently labeled antibodies specific to nuclear factors were applied and incubated for 30 minutes at 4 °C in the dark, ensuring a comprehensive analysis of both intracellular and nuclear factors related to lymphocyte activity.
Results
Bioinformatics Analysis Identifies Differentially Expressed Genes Targeted by AZD6738 in HCC
In this study, the differential expression profiles of 5684 genes associated with HCC and 107 genes linked to AZD6738 were meticulously examined. Utilizing volcano plots (Figure 1A and B) and a differential ranking plot (Figure 1C), the analysis unveiled 4604 genes were up-regulation and 1080 genes were downregulated. Furthermore, pivotal genes crucial to the interaction between AZD6738 and HCC were identified through heat map analysis (Figure 1D). Subsequent GO and KEGG functional enrichment analyses of the key proteins from TCGA dataset highlighted the predominant involvement of hub genes in regulating protein serine/threonine kinase activity and central carbon metabolism in the context of cancer (Figure 2A). Similarly, functional enrichment analysis of key proteins associated with AZD6738 indicated their significant roles in protein serine/threonine/tyrosine kinase activity and central carbon metabolism in cancer settings (Figure 2B). Notably, these findings underscore the analogous effects of AZD6738 and HCC in modulating protein modifications and carbon ion metabolism. By overlaying the proteins implicated in HCC with the targets influenced by AZD6738, 80 AZD6738 hub genes targeting HCC were identified (Figure 2C). Subsequent functional enrichment analysis of these 80 hub genes revealed their strong association with crucial biological processes and pathways, predominantly mapped to GO: 0004712, GO: 0004674, GO: 0018209, GO: 0018105, and hsa05230 (Figure 2D and Table 1).
 |
Table 1 GO and KEGG Analysis of TCGA-HCC, AZD6738 and Intersection Genes |
 |
Figure 1 Differential gene analysis of AZD6738-HCC. (A) Volcano plot of differential genes in TCGA-HCC. (B) Volcano plot of AZD6738 differential gene. (C) AZD6738-HCC differential genes were analyzed in descending order of differential expression. (D) Top differential gene heat map for AZD6738-HCC. |
 |
Figure 2 Functional analysis of AZD6738-HCC intersection genes. (A) GO and KEGG analysis of TCGA-HCC intersection genes. (B) GO and KEGG analysis of AZD6738 intersection genes. (C) Wayne diagram of intersection genes of TCGA and AZD6738. (D) 80 hub genes GO and KEGG map to the chord map of the corresponding plate. |
These comprehensive analyses provided valuable insights into the intricate molecular mechanisms underlying the interaction between AZD6738 and HCC, offering promising avenues for further exploration and potential therapeutic interventions.
Identify Core Targets of AZD6738-HCC
Differential genes in TCGA-HCC were analyzed for PPI protein interactions with AZD6738-related targets, and the central targets of the PPI network with AZD6738-HCC were calculated to target HCC. Seven core targets (EZH2, CCNB1, PRKDC, CTSL, PSEN1, SLC6A3, and FKBP1A) were identified by final analysis, and ROC curve analysis of these seven core targets revealed that they all had high specificity and sensitivity in diagnosing HCC (Figure 3).
 |
Figure 3 PPI protein interaction analysis screening of core targets in AZD6738-HCC. |
Prognostic Analysis of AZD6738-HCC-Related Genes
After integrating 80 genes associated with AZD6738-HCC into the LASSO regression analysis (Figure 4A), optimal model fitting was achieved at a λ value of 3, involving the inclusion of 11 differentially expressed genes (Figure 4B). Subsequently, comprehensive univariate and multivariate Cox regression analyses were conducted on the 80 AZD6738-HCC-associated differential genes. Among these, 11 genes, specifically “rearranged during transfection (RET)”, “enhancer of zeste homolog 2 (EZH2)”, “Cyclin B1 (CCNB1)”, “FMS-like tyrosine leukinase-3 (FLT3)”, “protein kinase, DNA-dependent, catalytic subunit (PRKDC)”, “cathepsin L (CTSL)”, “isomerase 1 (PSEN1)”, “IL-2 inducible kinase (ITK)”, “kinesin family member 1 (SLC6A3)”, “leukotriene B4 receptor (LTB4R)”, and “FKBP prolyl isomerase 1A (FKBP1A)”, were identified as closely associated with AZD6738-HCC (Figure 4C and D, Tables 2 and 3). Furthermore, the patients were stratified into high- and low-risk categories based on the identified risk factors. The findings revealed a proportional relationship between the heightened expression levels of the relevant genes and an increased risk score, as shown in Figure 4E. Consequently, the high-risk group exhibited a significantly higher mortality rate than the low-risk group. Importantly, risk factor analysis underscored the significant prognostic impact of these seven key factors on the clinical outcomes of patients with HCC (Figure 4F).
 |
Table 2 Univariate Cox Proportional Hazards Regression Analysis of AZD6738-HCC Genes |
 |
Table 3 Multivariate Cox Proportional Hazards Regression Analysis of AZD6738-HCC Genes |
 |
Figure 4 Prognostic value of AZD6738 and HCC intersection genes. (A) Risk curve of intersection genes. (B) Prognostic outcomes in high-risk versus low-risk groups. (C) Forest plot of univariate Cox analysis for 11 hub genes. (D) Forest plot of multivariate Cox analysis for 11 hub genes. (E) Risk scores for risk groups. (F) Survival status of risk score. |
In addition, survival analysis showed a significant (HR = 2.83, 95% CI = 1.96–4.10, P < 0.01) difference in overall survival (OS) between the high-risk and low-risk groups (Figure 5A). Survival analysis of each of the seven selected genes showed that high levels of EZH2, CCNB1, PRKDC, CTSL, PSEN1, SLC6A3, and FKBP1A expression were associated with poor overall survival (OS) (Figure 5B–H). These research findings indicate that these seven genes (EZH2, CCNB1, PRKDC, CTSL, PSEN1, SLC6A3, and FKBP1A) are significantly associated with high-risk scores in patients, highlighting their crucial role in regulating HCC progression. High expression levels of these genes are directly linked to higher mortality rates and poor prognoses, suggesting that they may be critical determinants of patient survival. The identification of these seven genes as significant risk factors underscores their importance in both the progression and prognosis of HCC. Specifically, their elevated expression levels correlate strongly with adverse clinical outcomes, indicating that they could be pivotal in determining disease severity and overall patient survival. This finding suggests that monitoring and targeting these genes could offer new avenues for personalized treatment strategies.
 |
Figure 5 Risk score and OS analysis of 7 hub genes. (A) Risk score. (B) EZH2. (C) CCNB1. (D) PRKDC. (E) CTSL. (F) PSEN1. (G) SLC6A3. (H) FKBP1A. |
Relationship Between AZD6738-HCC Hub Gene and Clinical Features
Clinicopathological analysis of these seven genes revealed distinct differences across various clinical features (Table 4). Increased expressions of EZH2, CCNB1, PRKDC, CTSL, PSEN1, SLC6A3, and FKBP1A were notably associated with higher T stages (T1 vs T2 vs T3 and T4), as illustrated in Figure 6A, with a corresponding correlation between elevated risk scores and advanced T stages (Figure 6B). Within the realm of pathologic staging (Stage I vs Stage II vs stages III and IV), heightened expression of these seven hub genes displayed a clear association with higher stages (Figure 6C), a linkage that was mirrored in the elevated risk scores related to advanced pathologic stages (Figure 6D).
 |
Table 4 Clinical Correlation Analysis of AZD6738-HCC Hub Genes |
 |
Figure 6 Risk score and clinical correlation of 7 hub genes. (A) Association of seven hub genes with T stage in HCC patients. (B) Risk score correlates with T stage in HCC patients. (C) Seven hub genes were associated with pathologic stage. (D) Risk score and pathologic stage correlation. (E) Seven hub genes were associated with AFP. (F) Risk score gene is associated with AFP. (G), seven hub genes were associated with vascular invasion. (H) Risk score correlates with vascular invasion. Significance is denoted as *p < 0.05, **p < 0.01, ***p < 0.001. |
Additionally, when examining alpha-fetoprotein (AFP) levels (≤ 400 vs > 400) and the presence of vascular invasion (no vs yes), overexpression of these seven hub genes was correlated with elevated AFP levels exceeding 400 (Figure 6E) and the presence of vascular invasion (Figure 6G). This pattern was also observed in the analysis of high-risk scores (Figure 6F–H), further emphasizing the significance of these genetic markers in relation to both AFP levels and vascular invasion.
Construction of Nomograms and Prognostic Value of Hub Genes
We developed nomograms that incorporated a range of clinicopathological features to accurately evaluate the prognosis of patients with HCC. These nomograms were designed to provide a comprehensive prognosis prediction for patients with HCC by integrating and aggregating the scores of each individual variable (Figure 7A). An impressive nomogram C-index of 0.725 was obtained, indicating the predictive reliability of the approach. Furthermore, the inclusion of risk scores that combined key genetic markers with clinical variables proved to be more predictive than relying solely on traditional clinical prognostic factors. Nomograms that amalgamated multiple facets of clinical information demonstrated the highest predictive accuracy (Figure 7B). Subsequent model calibration analysis (Figure 7C) and decision curves evaluating the net benefit of the prediction model (Figure 7D–F) corroborated the superior clinical utility of our nomogram in forecasting the 1-, 3-, and 5-year prognosis for HCC patients.
 |
Figure 7 Evaluation of key gene risk signals and establishment of prognostic models. (A) 1, 3, and 5-year nomograms used to predict overall survival in HCC. (B) Proportional hazards regression models to assess the impact of risk scores on survival. (C) Decision curve analysis to assess the net benefit of constructed nomograms. (D) Degree of fit of constructed nomograms in predicting 1 year. (E) Degree of fit of constructed nomograms in predicting 3-year. (F) The degree of fit of the constructed nomogram in predicting 5 years. |
The outcomes of these analyses underscored the enhanced predictive power and clinical applicability of our nomogram model in guiding treatment decisions and prognosis assessments for individuals with HCC.
Hub Gene Differences in HCC Versus Normal Liver Tissue
We downloaded immunohistochemical images of hub genes in normal liver tissue as well as HCC using the HPA online database and showed that six key genes (EZH2, CCNB1, PRKDC, CTSL, PSEN1, and FKBP1A) were highly expressed in HCC, while SLC6A3 was weakly expressed in HCC (Supplementary Figure 1A–G).
Single Cell Spatial Transcriptional Differences of Hub Genes in HCC Patients and Differences in the Distribution of Different Vascular Sources
A rigorous single-cell spatial transcriptomic analysis was conducted on HCC liver samples with the primary objective of delineating the precise distribution of hub genetic elements. Employing advanced nonlinear dimensionality reduction techniques, we successfully embedded high-dimensional data of liver cells into two-dimensional and three-dimensional low-dimensional spaces, thereby enabling visualization and subsequent classification into 14 distinct cellular clusters (Figure 8A). A comparative assessment of cell numbers across various sources after dimensionality reduction revealed that the HV category exhibited the highest cell count, surpassing 40, while the PV category closely trailed with a cell count slightly below 40. The PoV category contained approximately 15 cells, and the PA category demonstrated the lowest cell count, falling below 15 cells (Figure 8B). Furthermore, the key genes of interest, including EZH2 (Figure 8C), CCNB1 (Figure 8E), PRKDC (Figure 8G), CTSL (Figure 8I), PSEN1 (Figure 8K), SLC6A3 (Figure 8M), and FKBP1A (Figure 8O), were extracted using dimensionality reduction techniques, such as PCA. These genes play pivotal roles in facilitating the clustering and classification of the aforementioned four cell types. Notably, we observed low expression of SLC6A3 in positive number cancers and adjacent negative-number cancers, accompanied by high expression of FKBP1A in both cancer and adjacent-cancer states. Similarly, the remaining genes exhibited elevated expression levels, specifically in cancer cells. To unravel the origin of tumor cells, we conducted a comprehensive comparative analysis of these key genes across different sources or conditions (HV, PA, PV, and PoV). The genes highly expressed in cancer, namely, EZH2 (Figure 8D), CCNB1 (Figure 8F), PRKDC (Figure 8H), and PSEN1 (Figure 8L), exhibited varied expression patterns between the different sources, with the highly expressed fraction predominantly accumulating in the HV source. In contrast, CTSL (Figure 8J), SLC6A3 (Figure 8N), and FKBP1A (Figure 8P) showed no significant differences in expression across the investigated sources.
 |
Figure 8 Single-cell spatial transcriptome analysis in HCC patients. (A) Dimensionality reduction clustering of tSNE; (B) CTC classification of vascular origin; (C) EZH2 expression in liver single cells; (D) EZH2 expression in different vascular sources of CTC; (E) CCNB1 expression in liver single cells; (F) CCNB1 expression in different vascular sources of CTC; (G) PRKDC expression in liver single cells; (H) PRKDC expression in different vascular sources of CTC; (I) CTSL expression in liver single cells; (J) CTSL expression in different vascular sources of CTC; (K) PSEN1 expression in liver single cells; (L) PSEN1 expression in different vascular sources of CTC; (M) SLC6A3 expression in liver single cells; (N) SLC6A3 expression in different vascular sources of CTC; (O) FKBP1A expression in liver single cells; (P) FKBP1A expression in different vascular sources of CTC. |
Consequently, based on their stable and elevated expression profiles, we selected EZH2, CCNB1, PRKDC, and PSEN1 for further in-depth investigations in the subsequent phases of our research.
Differential Expression and Clustering of Core Targets in Primary and Secondary HCC: Unveiling the Diversity of Cellular Subpopulations
To understand the intricate expression dynamics of pivotal targets, namely EZH2, CCNB1, PRKDC, and PSEN1, in primary and secondary HCC, we meticulously applied dimensionality reduction techniques to single liver cells. Subsequently, we meticulously scrutinized the gene expression patterns post-clustering of single liver cells into distinct categories of HCC and neighboring non-cancerous cells. Further delving into the nuances of gene expression, we discerned notable variations by segregating HCC into primary and recurrent categories. Our comprehensive analysis revealed a conspicuous accumulation of EZH2 within HCC, underscoring its heightened expression levels in tumor samples compared to adjacent non-cancerous tissues (Figure 9A and B). It is noteworthy that the discernible elevation of EZH2 expression levels was specific to primary HCC (Figure 9C). Similarly, CCNB1 (Figure 9D–F), PRKDC (Figure 9G–I), and PSEN1 (Figure 9J–L) exhibited prominent clustering within HCC, signifying their augmented expression levels within tumor samples in contrast to their adjacent non-cancerous counterparts, with peak expression observed in primary HCC.
 |
Figure 9 Differential expression of core targets in liver. (A) EZH2 expression clustering in liver; (B) EZH2 clustering followed by differential expression between cancer and adjacent non-cancerous; (C) EZH2 differential expression between primary HCC and secondary HCC; (D) CCNB1 expression clustering in liver; (E) CCNB1 clustering followed by differential expression between cancer and adjacent non-cancerous; (F) CCNB1 differential expression between primary HCC and secondary HCC; (G) PRKDC expression clustering in liver; (H) PRKDC clustering followed by differential expression between cancer and adjacent non-cancerous; (I) PRKDC differential expression between primary HCC and secondary HCC; (J) PSEN1 expression clustering in liver; (K) PSEN1 clustering followed by differential expression between cancer and adjacent non-cancerous; (L) PSEN1 differential expression between primary HCC and secondary HCC. |
Clustering analysis of primary Hepatocellular Carcinomas (HCCs), intricately color-coded to differentiate the clustering intensity of critical targets – EZH2 (Figure 10A and B), CCNB1 (Figure 10C and D), PRKDC (Figure 10E and F), and PSEN1 (Figure 10G and H) – within individual single cells across the dataset, distinctly delineated their predominant clustering within mono cells, NKT cells, and Kupffer cells.
 |
Figure 10 Major cellular clustering sources for core targets. (A) Dimensional reduction analysis of EZH2 in primary HCC; (B) Difference of EZH2 in different liver cells; (C) Dimensional reduction analysis of PRKDC in primary HCC; (D) Difference of PRKDC in different liver cells; (E) Dimensional reduction analysis of CCNB1 in primary HCC; (F) Difference of CCNB1 in different liver cells; (G) Dimensional reduction analysis of PSEN1 in primary HCC; (H) Difference of PSEN1 in different liver cells. |
Validation of Core Target Binding to AZD6738 via Molecular Docking Analysis
To verify the binding efficacy of the core targets with AZD6738, we conducted molecular docking analyses. Initial virtual simulations targeting EZH2 led to the identification of the optimal binding pocket, characterized by a cavity volume (Å3) of 5170, signifying the most probable binding site (Figure 11A). Selection of molecular links exhibiting a vina score of −9.9 Kcal/mol, with a center (x, y, z) at 34, 3, −47 and docking size (x, y, z) of 35, 28, 29, ultimately culminated in the stable linkage of the final 3D structure of EZH2, denoted as AZD6738-5VK3 (Figure 11B). Upon virtual identification of the binding site for PRKDC, a pocket with Å3 = 5482 emerged as the predominant binding site (Figure 11C). Subsequent selection of template strand connections yielding a vina score of −8.6 kcal/mol, with a center (x, y, z) at 153, 115, 167 and docking size (x, y, z) of 33, 35, 22, facilitated the robust binding of PRKDC’s structure 6ZFP to AZD6738 via the template chain A (Figure 11D). Similarly, the virtual simulations pinpointed the binding site for CCNB1 at pocket Å3 = 725, designating it as the primary binding site (Figure 11E). The backbone scoring −7.0 kcal/mol was chosen for docking, with a center (x, y, z) at 315, 229, and 185 and docking sizes (x, y, z) of 22, 22, and 22, eventually confirming the stable binding of CCNB1’s 3D structure 6GU2 to AZD6738 through the main chain A-chain B (Figure 11F). Furthermore, identification of the binding site for PSEN1 revealed that the pocket with Å3 = 2793 was the most probable binding site (Figure 11G). Template strand connections scoring −8.3 Kcal/mol, with a center (x, y, z) at 111, 107, 91 and docking size (x, y, z) of 22, 22, 30, facilitated the robust binding of PSEN1’s structure 8OQY to AZD6738 through the template chain B-chain D (Figure 11H). In conclusion, our findings affirm the high affinity of AZD6738 towards core targets (EZH2, PRKDC, and CCNB1), suggesting its potential as a direct target of AZD6738, whereas PSEN1 exhibited a comparatively weaker binding affinity.
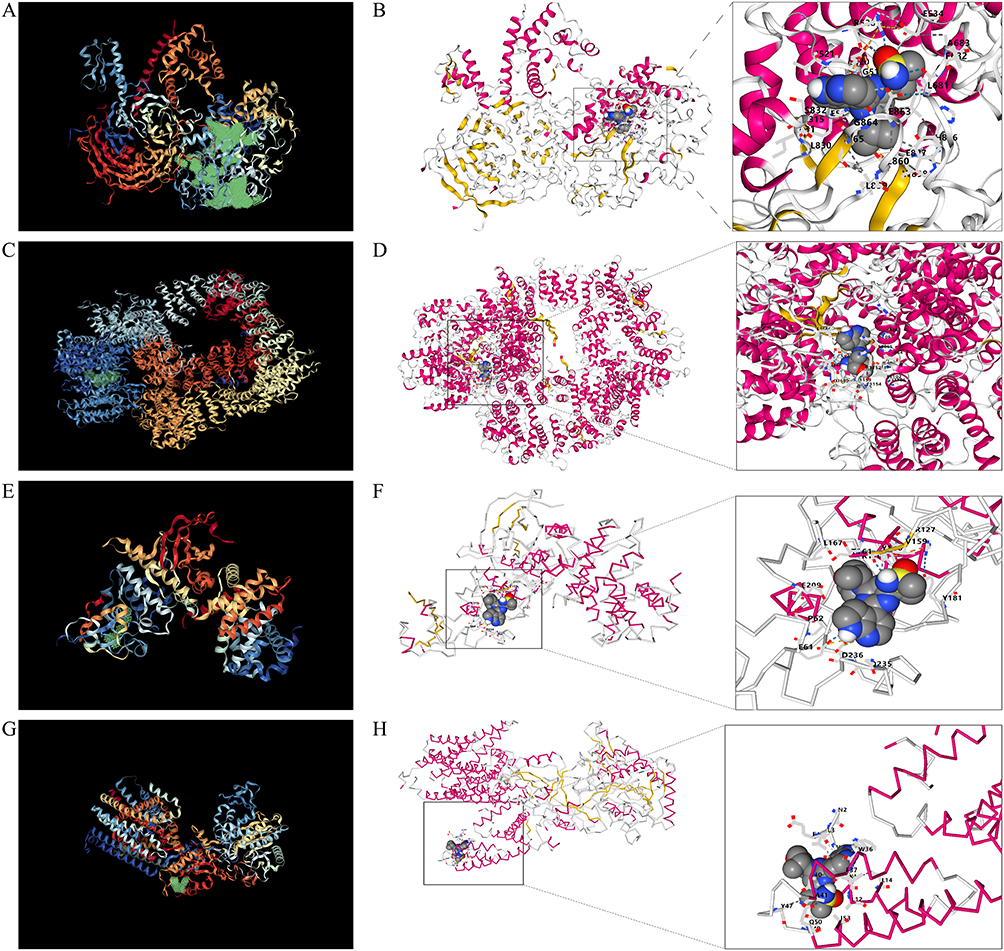 |
Figure 11 Molecular docking. (A) EZH2 virtual simulation to find the binding pocket. (B) EZH2 construct 5VK3 docked to AZD6738. (C) PRKDC virtual simulation searching for binding pockets. (D) PRKDC construct 6ZFP docked AZD6738. (E) CCNB1 virtual simulation for binding pocket. (F) CCNB1 construct 6GU2 docked AZD6738. (G) PSEN1 virtual simulation searching for binding pockets. (H) PSEN1 structure 8OQY docked AZD6738. |
AZD6738-HCC Core Target Validation
To explore the potential involvement of EZH2, PRKDC, CCNB1, and PSEN1 in HCC progression, in vitro investigations were conducted. Initially, mRNA expression levels were assessed in L-02 liver epithelial cells and various HCC cell lines, including Huh-7, PLC/PRF/5, SMMC-7721, and the murine line Hepa-1-6. Notably, elevated expression of EZH2 (Figure 12A), PRKDC (Figure 12B), and CCNB1 (Figure 12C) was observed in the HCC cell lines compared to L-02, with PSEN1 (Figure 12D) displaying distinct expression patterns, which were lower in human-derived HCC lines yet markedly higher in murine models. In particular, heightened levels of these genes were noted in the PLC/PRF/5 and Hepa-1-6 cell lines, prompting their selection for subsequent experimentation. To assess the direct impact of AZD6738 on these target genes, the compound was introduced, revealing substantial reductions in EZH2 (Figure 12E), PRKDC (Figure 12F), and CCNB1 (Figure 12G) mRNA levels following treatment, although a minimal impact was observed on PSEN1 (Figure 12H) expression.
 |
Figure 12 Validation of mRNA levels. (A) Differential expression of EZH2 in liver epithelial cells and HCC cell lines (n=6). (B) Differential expression of PRKDC in liver epithelial cells and HCC cell lines (n=6). (C) Differential expression of CCNB1 in liver epithelial cells and HCC cell lines (n=6). (D) Differential expression of PSEN1 in liver epithelial cells and HCC cell lines (n=6). (E) mRNA levels of EZH2 in HCC cells treated with AZD6738 (n=6). (F) mRNA levels of PRKDC after AZD6738 treatment in HCC cells (n=6). (G) mRNA levels of CCNB1 in HCC cells treated with AZD6738 (n=6). (H) mRNA levels of PSEN1 in HCC cells treated with AZD6738 (n=6). Significance is denoted as *p < 0.05, **p < 0.01, ***p < 0.001, #p < 0.0001. |
AZD 6738 Impacts T-Cell Infiltration Following Radioimmunotherapy
To elucidate the mechanism by which AZD6738 targets EZH2 within the tumor microenvironment, we conducted a series of meticulous experimental procedures. Initially, we performed dimensionality reduction analysis on single-cell data from the tumor microenvironment (Figure 13A), which allowed us to delineate the distribution characteristics of EZH2 at the single-cell level and elucidate its localization across different cell types (Figure 13B). Further analysis revealed a significant accumulation of EZH2 in T cells (Figure 13C), highlighting an overlapping functionality with these immune cells (Figure 13D). This finding suggests that AZD6738 may influence tumor growth by modulating T cell activity within the tumor microenvironment. Based on this premise, we harvested lymphocytes from tumors on day 8 of the experiment to evaluate the impact of AZD6738 on the tumor immune microenvironment. Our results demonstrated that treatment with AZD6738 considerably increased the quantity of CD8+ T cells (25.99 ± 4.542 for AZD6738 versus 9.233 ± 1.634 for the control, p = 0.0039; Figure 13E) and CD4+ T cells (15.66 ± 1.845 for AZD6738 versus 9.217 ± 1.927 for the control, p = 0.0139; Figures 13F–G) among tumor-infiltrating lymphocytes (TILs) compared to the control group. Concurrently, AZD6738 exhibited a notable reduction in the infiltration of regulatory T cells (Tregs) (12.50 ± 1.751 for AZD6738 versus 30.72 ± 9.756 for the control, p = 0.0334; Figures 13H–J).
 |
Figure 13 Effect of AZD6738-EZH2 in the tumor microenvironment. (A) UMAP mapping by cell type; (B) UMAP mapping showing EZH2 expression; (C) EZH2 expression in different single cell types of the immune microenvironment; (D) Heat mapping of the relationship between EZH2 and the immune cell population; (E) Flow cytometry analysis of CD4 + and CD8 + T cells (control group) (n=5); (F) Flow cytometry analysis of CD4 + and CD8 + T cells (AZD6738 treatment group) (n=5); (G) Quantitative analysis of CD4 + and CD8 + T cells (n=5); (H) Flow cytometry analysis of T cell memory subsets (control group) (n=5); (I) Flow cytometry analysis of T cell memory subsets (AZD6738 treatment group) (n=5); (J) Quantitative analysis of effector memory T cells (n=5). Significance is denoted as *p < 0.05, **p < 0.01. |
The observed increases in CD8+ and CD4+ T cell populations, along with the reduction in Treg infiltration, indicate that AZD6738 has a profound impact on the tumor immune microenvironment. Specifically, the enhanced presence of CD8+ T cells, which are critical for anti-tumor immunity, suggesting that AZD6738 may enhance cytotoxic T cell responses against tumor cells. Similarly, the increase in CD4+ T cells, which play a central role in orchestrating immune responses, implies that AZD6738 could boost overall immune activation within the tumor microenvironment. The significant decrease in Treg infiltration is particularly noteworthy, as Tregs typically suppress anti-tumor immune responses and promote tumor immune evasion. By reducing Treg numbers, AZD6738 may alleviate immunosuppression, thereby improving the efficacy of anti-tumor immune responses. These findings collectively suggest that AZD6738 not only directly affects tumor cells but also modulates the tumor microenvironment to favor immune-mediated tumor elimination.
In summary, our results highlight the multifaceted impact of AZD6738 on the tumor microenvironment, indicating its potential as a promising therapeutic strategy for HCC.
AZD6738 Enhances Immune Memory in Mouse Tumors
In our continued analysis of immune infiltration, we discovered that EZH2, the target of AZD6738, exhibited a significant correlation with the infiltration of T cells (Figure 14A). This association was closely tied to the prognosis of cancer patients (Figure 14B), suggesting the potential involvement of EZH2 in the tumor immune microenvironment. To gain deeper insight into how AZD6738 influences T cell populations, we examined the proliferation of tumor-infiltrating lymphocytes (TIL) with a focus on Ki-67+ labeled cells - a well-known marker for cell proliferation - using flow cytometry. The results revealed that AZD6738 significantly elevated the percentage of TIL CD8+ Ki-67+ T cells compared to the control group (58.52 ± 5.102 for AZD6738 versus 32.48 ± 5.325 for control, p = 0.0036; Figure 14C–E). This indicates that AZD6738 effectively enhances the proliferation of CD8+ T cells, which could strengthen their anti-tumor efficacy. Additionally, we assessed the memory status of CD8+ T cells to determine whether AZD6738 fosters the differentiation of effector memory T (Tem) cells, which are crucial for long-term immune memory and anti-tumor responses. On day 8 of the experiment, treatment with AZD6738 led to a significant increase in the percentage of TIL CD8+ effector Tem cells when compared with controls (48.88 ± 7.884 for AZD6738 versus 22.91 ± 0.6740 for control, p = 0.0047; Figures 14F–H). This finding suggests that AZD6738 not only promotes the proliferation of CD8+ T cells but also enhances their potential to differentiate into effector memory T cells with long-lasting memory functions.
 |
Figure 14 Potential role of AZD6738 in enhancing anti-tumor immune responses. (A) Correlation analysis between AZD6738-EZH2 expression level and immune infiltration; (B) Survival analysis between AZD6738-EZH2 and immune cells; (C) Ki-67 positive cell ratio of CD8 + T cells (control group) (n=5); (D) Ki-67 positive cell ratio of CD8 + T cells (AZD6738 treatment group) (n=5); (E) Quantitative analysis of Ki-67 in positive CD8 + T cells (n=5); (F) Proportion of regulatory T cells (Treg) (control group) (n=5); (G) Proportion of regulatory T cells (Treg) (AZD6738 treatment group) (n=5); (H) Quantitative analysis of Treg cells (n=5). Significance is denoted as *p < 0.05, **p < 0.01. |
Collectively, these results underscore the role of AZD6738 in modulating T cell proliferation and memory status, further highlighting the potential of EZH2 as an immunoregulatory target. This provides a robust experimental foundation for developing innovative strategies in cancer immunotherapy.
Discussion
Given the global absence of targeted therapies for HCC patients, our research has unveiled molecular targets and their associated effective binding sites for AZD6738 in the context of HCC patients, employing a multifaceted approach encompassing single-cell omics, network pharmacology, and molecular docking. Our study suggests that EZH2, CCNB1, PRKDC, CTSL, PSEN1, SLC6A3, and FKBP1A are potential treatment targets for AZD6738 in an HCC patient cohort. Through a comprehensive examination of clinical attributes, these identified genes (EZH2, CCNB1, PRKDC, CTSL, PSEN1, SLC6A3, and FKBP1A) not only demonstrated prognostic value for HCC patients but also exhibited advantages when considered in concert with clinical characteristics.
To delineate the specific roles of these key genes within distinct liver cell types, we conducted dimensionality reduction analysis of individual liver cells, demonstrating that EZH2, PRKDC, CCNB1, and PSEN1 tend to accumulate within the liver epithelium and are primarily expressed within Monocytes, Kupffer cells, and NKT cells. In contrast, the behavior of the other genes appeared more uniform and less distinctive. This observation suggests an immunotherapeutic influence of these genes and a potential interplay with these specific cell types.
The aberrant expression of EZH2 plays a pivotal role in various aspects of tumor biology, including cell proliferation, invasiveness, metastatic potential, and resistance to therapeutic agents.21 Consequently, the targeted inhibition of EZH2 has emerged as a promising avenue for cancer treatment. Research findings have shown that the depletion of EZH2 within actively proliferating tumor cells promptly elicits a DNA damage response, leading to the upregulation of the p16 gene and the effective activation of genes associated with the aging-related secretory phenotype.22 This cascade of events underscores the critical role of EZH2 in tumor pathobiology and highlights its potential as a target for intervention in cancer therapy. Research has demonstrated that the EZH2-IL-6 signaling axis plays a crucial role in promoting the development of HCC. This signaling pathway recruits and activates myeloid-derived suppressor cells (MDSCs) and leads to the dysfunction of cytotoxic CD8 T cells. Targeting this axis may offer a novel therapeutic strategy to enhance the response of HCC patients to anti-PD-1 immunotherapy.23 Additionally, a study that integrated targeting strategies with chemotherapeutic agents revealed that PRKDC inhibitors significantly improved the effectiveness of doxorubicin in C-Myc mouse and human hepatoblastoma xenograft models.24 Furthermore, these findings suggest that patients with tumors characterized by DNA repair defects may benefit significantly from PRKDC inhibitors. This highlights the potential of these inhibitors as targeted therapies in such cases.25,26 CCNB1 expression undergoes periodic fluctuations during the cell cycle, playing a crucial role as both an initiator and checkpoint for quality control during mitosis.27 Several studies have indicated that CCNB1 exerts substantial inhibitory effects on the proliferation, migration, and invasion of HCC cells.28–30 Cairo et al31 demonstrated that inhibitors targeting CCNB1 suppress the phosphorylation of the PI3K/AKT signaling pathway, thereby inhibiting HCC cell development. This highlights the potential therapeutic significance of targeting CCNB1 to mitigate HCC progression and warrants further investigation of its role as a therapeutic target in strategies for HCC treatment. The primary function of PSEN1 is to participate in the assembly and function of γ-secretase, regulating the cleavage and activation of various membrane proteins. It also plays a crucial role in cellular signaling and function. Mutations in PSEN1 are linked to the development of early-onset familial Alzheimer’s.32 While the role of PSEN1 in HCC has been less explored, recent research has identified it as one of the hub genes associated with high-risk scores in patients with HCC, showing positive correlations with disease stage and grade.
Although hub genes, including EZH2, PRKDC, CCNB1, and PSEN1, have been implicated in HCC progression, our understanding of drug targeting for these genes is limited. Through network pharmacology analysis, AZD6738 was identified as a potential therapeutic agent for HCC patients by targeting these core genes. This finding underscores the potential for further exploration of AZD6738 as a treatment option for HCC, based on its interactions with key genes involved in HCC pathogenesis.
AZD6738 is an specific inhibitor of ATR that has been demonstrated to enhance radiation-induced infiltration and activation of lymphocytes within tumor tissue, leading to more potent anticancer effects.19 Studies suggest that AZD6738 induces strong immunostimulatory effects, potentially synergizing with immunotherapy to manage tumors effectively and enhance overall survival rates.33 Additionally, research indicates that combining AZD6738 with radioimmunotherapy can activate the cGAS/STING pathway, resulting in anti-HCC effects.20 This highlights the promising potential of AZD6738 to enhance the immune response against HCC and warrants further investigation into its therapeutic applications in managing the disease.
We conjectured that AZD6738 could affect disease progression in HCC patients to some extent, but its specific target for HCC remains to be further investigated. Therefore, we further verified by molecular docking that structure 5VK3 of EZH2 had a good binding ability to AZD6738, and structure 6ZFP of PRKDC had a good binding ability to AZD6738. The CCNB1 construct 6GU2 showed a good binding ability to AZD6738. The PSEN1 construct, 8OQY, binds AZD6738 slightly less effectively. Furthermore, we verified by RT-PCR that EZH2, PRKDC, and CCNB1 were significantly highly expressed in HCC cells, whereas PSEN1 was lowly expressed in human HCC and highly expressed in murine HCC cells. When AZD6738 was used to intervene in HCC cells, the expression levels of EZH2 and PRKDC were significantly decreased, while CCNB1 was decreased to some extent, and the change in PSEN1 was not significant. Therefore, we hypothesized that AZD6738 may work in HCC treatment by directly targeting EZH2. Despite our study revealing the potential targets of AZD6738 in HCC treatment and providing support through various methods including single-cell omics, network pharmacology, and molecular docking, there are several limitations. First, the sample size in this study is relatively small, which limits the generalizability and reliability of the results. Future research will require larger-scale experiments to validate these findings. Secondly, while we provided preliminary evidence through molecular docking and RT-PCR experiments (indicating that AZD6738 targets EZH2), we lack validation using in vivo animal models. This step is crucial for confirming the efficacy and safety of AZD6738 targeting EZH2 in HCC. Additionally, detailed mechanistic studies have yet to be conducted. Further exploration of the precise mechanisms by which AZD6738 interacts with these targets will provide deeper insights into its therapeutic potential. Lastly, translating these findings into clinical practice will necessitate clinical trials to evaluate factors such as drug dosage, administration routes, and potential side effects, ensuring the safety and efficacy of AZD6738 in real-world applications. Therefore, addressing these limitations in future research is essential to advance the application of AZD6738 in HCC treatment.
Conclusion
The identification of pivotal targets EZH2, PRKDC, and CCNB1 has profound implications for the therapeutic strategies and clinical outcomes of HCC patients. Moreover, our investigation demonstrated a robust binding affinity between AZD6738 and these targets, as revealed by network pharmacology and molecular docking analyses. Importantly, our findings substantiate the therapeutic potential of AZD6738 in specifically targeting EZH2, PRKDC, and CCNB1 in patients with HCC.
Data Sharing Statement
The datasets used and/or analysed during the current study available from the corresponding author on reasonable request.
Funding
This study was supported by the National Natural Science Foundation of China (grant number 82260122).
Disclosure
The authors declare no competing interests in this work.
References
1. Liang Y, Liu Z, Zuo D, et al. Single cell glycan-linkages profiling for hepatocellular carcinoma early diagnosis using lanthanide encoded bacteriophage MS2 based ICP-MS. Talanta. 2024;274:126056. doi:10.1016/j.talanta.2024.126056
2. Wei H, Yang J, Chen X, et al. BAIAP2L2 is a novel prognostic biomarker related to migration and invasion of HCC and associated with cuprotosis. Sci Rep. 2023;13(1):8692. doi:10.1038/s41598-023-35420-0
3. Sakano Y, Noda T, Kobayashi S, et al. Clinical significance of acylphosphatase 1 expression in combined HCC-iCCA, HCC, and iCCA. Dig Dis Sci. 2022;67(8):3817–3830. doi:10.1007/s10620-021-07266-x
4. Sia D, Villanueva A, Friedman SL, et al. Liver cancer cell of origin, molecular class, and effects on patient prognosis. Gastroenterology. 2017;152(4):745–761. doi:10.1053/j.gastro.2016.11.048
5. Rumgay H, Ferlay J, de Martel C, et al. Global, regional and national burden of primary liver cancer by subtype. Eur J Cancer. 2022;161:108–118. doi:10.1016/j.ejca.2021.11.023
6. Thilakarathna WPDW, Rupasinghe hpvridgway ND, Ridgway ND. Mechanisms by which probiotic bacteria attenuate the risk of hepatocellular carcinoma. Int J mol Sci. 2021;22(5):2606. doi:10.3390/ijms22052606
7. Beaufrère A, Calderaro J, Paradis V. Combined hepatocellular-cholangiocarcinoma: an update. J Hepatol. 2021;74(5):1212–1224. doi:10.1016/j.jhep.2021.01.035
8. Ali FEM, Ibrahim IM, Althagafy HS, et al. Role of immunotherapies and stem cell therapy in the management of liver cancer: a comprehensive review. Int Immunopharmacol. 2024;132:112011. doi:10.1016/j.intimp.2024.112011
9. Yang Y, Wu G, Li Q, et al. Angiogenesis-related immune signatures correlate with prognosis, tumor microenvironment, and therapeutic sensitivity in hepatocellular carcinoma. Front Mol Biosci. 2021;8:690206. doi:10.3389/fmolb.2021.690206
10. Marin JJG, Macias RIR, Asensio M, et al. Strategies to enhance the response of liver cancer to pharmacological treatments. Am J Physiol Cell Physiol. 2024;327(1):C11–C33. doi:10.1152/ajpcell.00176.2024
11. Hung MH, Chang CW, Wang KC, et al. Purine anabolism creates therapeutic vulnerability in hepatocellular carcinoma through m 6 A-mediated epitranscriptomic regulation. Hepatology. 2023;78(5):1462–1477. doi:10.1097/HEP.0000000000000420
12. Gruttadauria S, Barbera F, Pagano D, et al. Liver transplantation for unresectable intrahepatic cholangiocarcinoma: the role of sequencing genetic profiling. Cancers. 2021;13(23):6049. doi:10.3390/cancers13236049
13. Mei L, Zhang J, He K, et al. Ataxia telangiectasia and Rad3-related inhibitors and cancer therapy: where we stand. J Hematol Oncol. 2019;12(1):43. doi:10.1186/s13045-019-0733-6
14. Yazinski SA, Zou L. FunctionsRegulation, and therapeutic implications of the ATR checkpoint pathway. Annu Rev Genet. 2016;50(1):155–173. doi:10.1146/annurev-genet-121415-121658
15. Barnieh FM, Loadman PMFalconer RA, Falconer RA. Progress towards a clinically-successful ATR inhibitor for cancer therapy. Curr Res Pharmacol Drug Discov. 2021;2:100017. doi:10.1016/j.crphar.2021.100017
16. Sundar R, Brown J, Ingles Russo A, et al. Targeting ATR in cancer medicine. Curr Probl Cancer. 2017;41(4):302–315. doi:10.1016/j.currproblcancer.2017.05.002
17. Foote KM, Nissink JWM, McGuire T, et al. Discovery and characterization of AZD6738, a potent inhibitor of ataxia telangiectasia mutated and Rad3 related (ATR) kinase with application as an anticancer agent. J Med Chem. 2018;61(22):9889–9907. doi:10.1021/acs.jmedchem.8b01187
18. Vendetti FP, Karukonda P, Clump DA, et al. ATR kinase inhibitor AZD6738 potentiates CD8+ T cell-dependent antitumor activity following radiation. J Clin Invest. 2018;128(9):3926–3940. doi:10.1172/JCI96519
19. Dillon MT, Bergerhoff KF, Pedersen M, et al. ATR inhibition potentiates the radiation-induced inflammatory tumor microenvironment. Clin Cancer Res. 2019;25(11):3392–3403. doi:10.1158/1078-0432.CCR-18-1821
20. Sheng H, Huang Y, Xiao Y, et al. ATR inhibitor AZD6738 enhances the antitumor activity of radiotherapy and immune checkpoint inhibitors by potentiating the tumor immune microenvironment in hepatocellular carcinoma. J Immunother Cancer. 2020;8(1):e000340. doi:10.1136/jitc-2019-000340
21. Yu W, Liu N, Song X, et al. EZH2: an accomplice of gastric cancer. Cancers. 2023;15(2):425. doi:10.3390/cancers15020425
22. Ito T, Teo YV, Evans SA, et al. Regulation of cellular senescence by polycomb chromatin modifiers through distinct DNA damage- and histone methylation-dependent pathways. Cell Rep. 2018;22(13):3480–3492. doi:10.1016/j.celrep.2018.03.002
23. Wang L, Zhu L, Liang C, et al. Targeting N6-methyladenosine reader YTHDF1 with siRNA boosts antitumor immunity in NASH-HCC by inhibiting EZH2-IL-6 axis. J Hepatol. 2023;79(5):1185–1200. doi:10.1016/j.jhep.2023.06.021
24. Fang J, Singh S, Cheng C, et al. Genome-wide mapping of cancer dependency genes and genetic modifiers of chemotherapy in high-risk hepatoblastoma. Nat Commun. 2023;14(1):4003. doi:10.1038/s41467-023-39717-6
25. Song H, Bucher S, Rosenberg K, et al. Single-cell analysis of hepatoblastoma identifies tumor signatures that predict chemotherapy susceptibility using patient-specific tumor spheroids. Nat Commun. 2022;13(1):4878. doi:10.1038/s41467-022-32473-z
26. Cairo S, Armengol C, Maibach R, et al. A combined clinical and biological risk classification improves prediction of outcome in hepatoblastoma patients. Eur J Cancer. 2020;141:30–39. doi:10.1016/j.ejca.2020.09.026
27. Jin P, Hardy SMorgan DO, Morgan DO. Nuclear localization of cyclin B1 controls mitotic entry after DNA damage. J Cell Biol. 1998;141(4):875–885. doi:10.1083/jcb.141.4.875
28. Gu J, Liu X, Li J, et al. MicroRNA-144 inhibits cell proliferation, migration and invasion in human hepatocellular carcinoma by targeting CCNB1. Cancer Cell Int. 2019;19(1):15. doi:10.1186/s12935-019-0729-x
29. Zhou L, Du Y, Kong L, et al. Identification of molecular target genes and key pathways in hepatocellular carcinoma by bioinformatics analysis. Onco Targets Ther. 2018;11:1861–1869. doi:10.2147/OTT.S156737
30. Shen Z, Yu X, Zheng Y, et al. CDCA5 regulates proliferation in hepatocellular carcinoma and has potential as a negative prognostic marker. Onco Targets Ther. 2018;11:891–901. doi:10.2147/OTT.S154754
31. Xia P, Zhang H, Xu K, et al. MYC-targeted WDR4 promotes proliferation, metastasis, and sorafenib resistance by inducing CCNB1 translation in hepatocellular carcinoma. Cell Death Dis. 2021;12(7):691. doi:10.1038/s41419-021-03973-5
32. Morales AL, Figueroa MI, Navarro P, et al. Volga German surnames and Alzheimer’s disease in argentina: an epidemiological perspective. J Biosoc Sci. 2024;56(6):998. doi:10.1017/S002193202400018X
33. Hardaker EL, Sanseviero E, Karmokar A, et al. The ATR inhibitor ceralasertib potentiates cancer checkpoint immunotherapy by regulating the tumor microenvironment. Nat Commun. 2024;15(1):1700. doi:10.1038/s41467-024-45996-4
 © 2025 The Author(s). This work is published and licensed by Dove Medical Press Limited. The
full terms of this license are available at https://www.dovepress.com/terms.php
and incorporate the Creative Commons Attribution
- Non Commercial (unported, 4.0) License.
By accessing the work you hereby accept the Terms. Non-commercial uses of the work are permitted
without any further permission from Dove Medical Press Limited, provided the work is properly
attributed. For permission for commercial use of this work, please see paragraphs 4.2 and 5 of our Terms.
© 2025 The Author(s). This work is published and licensed by Dove Medical Press Limited. The
full terms of this license are available at https://www.dovepress.com/terms.php
and incorporate the Creative Commons Attribution
- Non Commercial (unported, 4.0) License.
By accessing the work you hereby accept the Terms. Non-commercial uses of the work are permitted
without any further permission from Dove Medical Press Limited, provided the work is properly
attributed. For permission for commercial use of this work, please see paragraphs 4.2 and 5 of our Terms.
Recommended articles
Sintilimab Plus Lenvatinib with or Without Radiotherapy for Advanced Hepatocellular Carcinoma with Pulmonary Metastasis
Liu C, Jiang W, Sun J, Cui J, He D, Cheng S, Shi J
Journal of Hepatocellular Carcinoma 2024, 11:2283-2292
Published Date: 19 November 2024
Combined TACE with Targeted and Immunotherapy versus TACE Alone Improves DFS in HCC with MVI: A Multicenter Propensity Score Matching Study
Chen X, Wu X, Peng W, Liu L, Liu X, Wan X, Xu H, Zheng Y, Zhao H, Mao Y, Lu X, Sang X, Chang X, Zhou K, Pan J, Guan M, Hu D, Tan H, Zhang Y, Du S
Journal of Hepatocellular Carcinoma 2025, 12:561-577
Published Date: 19 March 2025
Engineered E. coli OMVs Carrying the Membrane-Binding hGC33 Fragment Precisely Target Liver Cancer and Effectively Treat Tumor
Deng Y, Yang B, Yang Z, Xiao H, Zou Y, Zou C, Yang S, Sun X, Wang Y, Bai J, Fang L, Wang Z
International Journal of Nanomedicine 2025, 20:6573-6590
Published Date: 22 May 2025